


1. Introduction
The Hirnantian Age in the latest Ordovician is of wide international interest due to its association with the peak of the early Palaeozoic Icehouse (EPI; Page et al. Reference Page, Salasiewicz, Popov, Williams, Haywood, Gregory and Schmidt2007), the Late Ordovician Mass Extinction (LOME; Finnegan et al. Reference Finnegan, Heim, Peters and Fischer2012; Harper et al. Reference Harper, Hammarlund and Rasmussen2014; Ling et al. Reference Ling, Zhan, Wang, Wang, Amelin, Tang, Liu, Jin, Huang, Wu, Xue, Fu, Bennett, Wei, Luan, Finnegan, Harper and Rong2019; Rasmussen et al. Reference Rasmussen, Kröger, Nielsen and Colmenar2019; Wang et al. Reference Wang, Zhan and Percival2019) and an associated major anomaly to the global carbon cycle, the Hirnantian Isotope Carbon Excursion (HICE; Brenchley et al. Reference Brenchley, Carden, Hints, Kaljo, Marshall, Martma, Meidla and Nõlvak2003; Kaljo et al. Reference Kaljo, Hints, Männik and Nõlvak2008; Bergström et al. Reference Bergström, Eriksson, Young, Ahlberg and Schmitz2013; Subías et al. Reference Subías, Villas and Álvaro2015; Mauviel & Desrochers, Reference Mauviel and Desrochers2016). The possibility of assessing the Hirnantian Stage and demonstrating the precise interrelationship of stage boundaries, biostratigraphy, sea-level trends and the temporal development of the HICE is hampered by the global rarity of complete sections: the HICE is to date recorded from several tens of localities worldwide, but few, if any, of the associated outcrops or core sections have a continuous sedimentary record due to the contemporaneous glacio-eustasy (e.g. Loi et al. Reference Loi, Ghienne, Dabard, Paris, Botquelen, Christ, Elaouad-Debbaj, Gorini, Vidal, Videt and Destombes2010; Ghienne et al. Reference Ghienne, Desrochers, Vandenbroucke, Achab, Asselin, Dabard, Farley, Loi, Paris and Wickson2014). Formally, the base of the Hirnantian is defined as the First Appearance Datum (FAD) of the graptolite Metabolograptus extraordinarius 0.39 m below the Kuanyinchiao Bed in the Wangjiawan North Section, Hubei province, China (Chen et al. Reference Chen, Rong, Fan, Zhan, Mitchell, Harper, Melchin, Peng, Finney and Wan2006; Gorjan et al. Reference Gorjan, Kaiho, Fike and Xu2012). At the immediately adjacent Wangjiawan Riverside Section, the HICE starts very close to the FAD of M. extraordinarius (Gorjan et al. Reference Gorjan, Kaiho, Fike and Xu2012). Recent U–Pb dates from a continuous section at Wanhe in southwest China suggest that the duration of the entire Hirnantian Age is as little as 0.47 ± 0.34 Ma, and thus considerably shorter than previously understood (Ling et al. Reference Ling, Zhan, Wang, Wang, Amelin, Tang, Liu, Jin, Huang, Wu, Xue, Fu, Bennett, Wei, Luan, Finnegan, Harper and Rong2019). Bergström et al. (Reference Bergström, Xu, Gutiérrez-Marco and Dronov2009) subdivided the Hirnantian Stage into two stage slices, named Hi1 and Hi2. Hi1 is defined as strata between the base of the Metabolograptus extraordinarius Graptolite Zone and the end of HICE. Hi2 is thus defined as strata between the end of the HICE and the base of the Akidograptus ascensus Graptolite Zone, marking the top of the Ordovician.
In Baltoscandia the HICE has been particularly studied from sections in the East Baltic area (Kaljo et al. Reference Kaljo, Hints, Martma and Nõlvak2001, Reference Kaljo, Hints, Martma, Nõlvak and Oraspõld2004a, Reference Kaljo, Martma and Saadre2007, Reference Kaljo, Hints, Männik and Nõlvak2008, Reference Kaljo, Männik, Martma and Nõlvak2012; Ainsaar et al. Reference Ainsaar, Meidla and Martma2004, Reference Ainsaar, Kaljo, Martma, Meidla, Männik, Nõlvak and Tinn2010; Meidla et al. Reference Meidla, Ainsaar, Backman, Dronov, Holmer, Sturesson, Hints and Ainsaar2004; Hints et al. Reference Hints, Hints, Kaljo, Kiipli, Männik, Nõlvak and Pärnaste2010, Reference Hints, Martma, Männik, Nõlvak, Põldvere, Shen and Viira2014; Bauert et al. Reference Bauert, Ainsaar, Põldsaar and Sepp2014; Ainsaar, Reference Ainsaar, Truumees, Meidla and Ramkumar2015). Important data have also emerged from Sweden (Schmitz & Bergström, Reference Schmitz and Bergström2007; Bergström et al. Reference Bergström, Lehnert, Calner and Joachimski2012, Reference Bergström, Eriksson, Young, Ahlberg and Schmitz2013; Ebbestad et al. Reference Ebbestad, Högström, Frisk, Martma, Kaljo, Kröger and Pärnaste2015) where the preserved Hirnantian Stage is normally only a few metres thick and associated with marked disconformities (e.g. Bergström et al. Reference Bergström, Lehnert, Calner and Joachimski2012, Reference Bergström, Eriksson, Young, Ahlberg and Schmitz2013).
This study aims to establish a δ13Ccarb chemostratigraphy for the Hirnantian Stage of the Oslo–Asker district of Norway. This region represents the margin of Baltoscandia and faced the closing Iapetus Ocean towards the west during the early stages of the Caledonian Orogeny. We present δ13C data from six outcrops (Fig. 1; Appendix 1), including from the Norwegian type section for the Hirnantian Stage and the Ordovician–Silurian boundary at Hovedøya Island and from an incised valley fill that represents the ‘missing strata’ at a major unconformity resulting from Hirnantian glacio-eustasy (Bockelie et al. Reference Bockelie, Baarli and Johnson2017). Our primary goal has been to identify the HICE in order to understand the degree of preservation of Hirnantian strata, and thus illustrate the stratigraphic completeness of the exposed successions in the area. This is particularly warranted as Norway is largely a white spot on the map in terms of Ordovician carbon isotope stratigraphy. Bergström et al. (Reference Bergström, Schmitz, Young and Bruton2010) documented the Katian Guttenberg Carbon Isotope Excursion (GICE) from the Nes-Hamar district north of Oslo. Apart from this, only a few previous studies have shown a partial record of the upper Katian and/or Hirnantian stages from localities in the Oslo–Asker district (Brenchley et al. Reference Brenchley, Marshall, Hints and Nõlvak1997; Brenchley & Marshall, Reference Brenchley, Marshall, Kraft and Fatka1999; Kaljo et al. Reference Kaljo, Martma, Neuman, Rønning, Hints and Ainsaar2004b; Bergström et al. Reference Bergström, Saltzman and Schmitz2006; Amberg et al. Reference Amberg, Vandenbroucke, Nielsen, Munnecke and McLaughlin2017).

Fig. 1. Map showing the location of the six sampled outcrops (names in italics) in the Oslo metropolitan area, southern Norway. The two localities on Hovedøya refer to the Ordovician–Silurian type section (the SE locality; Brenchley & Newall Reference Brenchley and Newall1975) and the locality where the incised valley was studied (the SW locality).
2. Geological setting and stratigraphy
At the end of the Ordovician period, present-day southern Norway was situated near latitude 30°S (Scotese & McKerrow, Reference Scotese, McKerrow, Barnes and Williams1991; Torsvik & Cocks, Reference Torsvik and Cocks2013). The Ordovician rocks exposed in and around Oslo city and in the many islands in the upper Oslo Fjord area form part of a fault-controlled graben with a c. 2500 m thick lower Palaeozoic succession (Bruton & Williams, Reference Bruton and Williams1982; Nakrem & Rasmussen, Reference Nakrem, Rasmussen, Calner, Ahlberg, Lehnert and Erlström2013). The Ordovician part of this succession is c. 400 m thick and comprises fossiliferous limestone alternating with units of fine-grained siliciclastic strata (Bockelie, Reference Bockelie, Ramberg and Neumann1978, Reference Bockelie, Bruton and Williams1982; Owen et al. Reference Owen, Bruton, Bockelie and Bockelie1990). The study of these rocks, and reconstruction of depositional environments and palaeogeography of the area, is complicated by crustal shortening related to the Caledonian Orogeny and associated nappe displacement, resulting in folding and thrusting of the pre-orogenic strata (Bruton et al. Reference Bruton, Gabrielsen and Larsen2010). This shortening is very clear in the Oslo area, where a large number of anticlines and synclines with steep limbs strike from the southwest towards the northeast.
The stratigraphy of the Hirnantian Stage and the Ordovician–Silurian transition in the Oslo area has been studied for more than 150 years, and several key papers have successively contributed to a better understanding of the interval (Kiær, Reference Kiær1902, Reference Kiær1908; Spjeldnæs, Reference Spjeldnæs1957; Brenchley & Newall, Reference Brenchley and Newall1975, Reference Brenchley and Newall1980; Brenchley & Cocks, Reference Brenchley and Cocks1982; Brenchley & Marshall, Reference Brenchley, Marshall, Kraft and Fatka1999; Bockelie et al. Reference Bockelie, Baarli and Johnson2017; Johnson & Baarli, Reference Johnson and Baarli2018). Folding of the succession in combination with scattered distribution of the rocks on the many islands, however, still makes a full understanding of especially the boundary interval challenging. The immediate Ordovician–Silurian boundary succession was studied in detail along the southwestern shore of Hovedøya by Spjeldnæs (Reference Spjeldnæs1957) who concluded that there was an angular unconformity below the Silurian deposits. Brenchley & Newall (Reference Brenchley and Newall1975) studied the sedimentology and palaeontology of the Katian through Hirnantian and produced palaeogeographical maps for the upper Fjord area. They showed that the facies pattern in Oslo–Asker was complex, with an ‘eastern’ and ‘western’ facies subdivision; the western parts being richer in carbonates whereas siliciclastics are more important in the eastern part. Johnson & Baarli (Reference Johnson and Baarli2018) further elaborated on this subdivision and showed that, in the late Hirnantian, higher land areas existed in the northwest, whereas marginal marine areas were found to the southeast, and that incised valleys were situated between these areas. The stratigraphic interfingering of the ‘eastern’ and ‘western’ facies is obvious in central positions where distinct lithostratigraphic units therefore are recurrently occurring in a stratigraphic section; this is exemplified in the present study.
A recent paper by Bockelie et al. (Reference Bockelie, Baarli and Johnson2017) presents a historic background to the successive improvements in understanding that have taken place with regard to the Ordovician–Silurian boundary interval in the area, and also provides a detailed description and partial revision of the stratigraphy of these rocks. Their revised stratigraphy is followed in the present paper (Fig. 2).
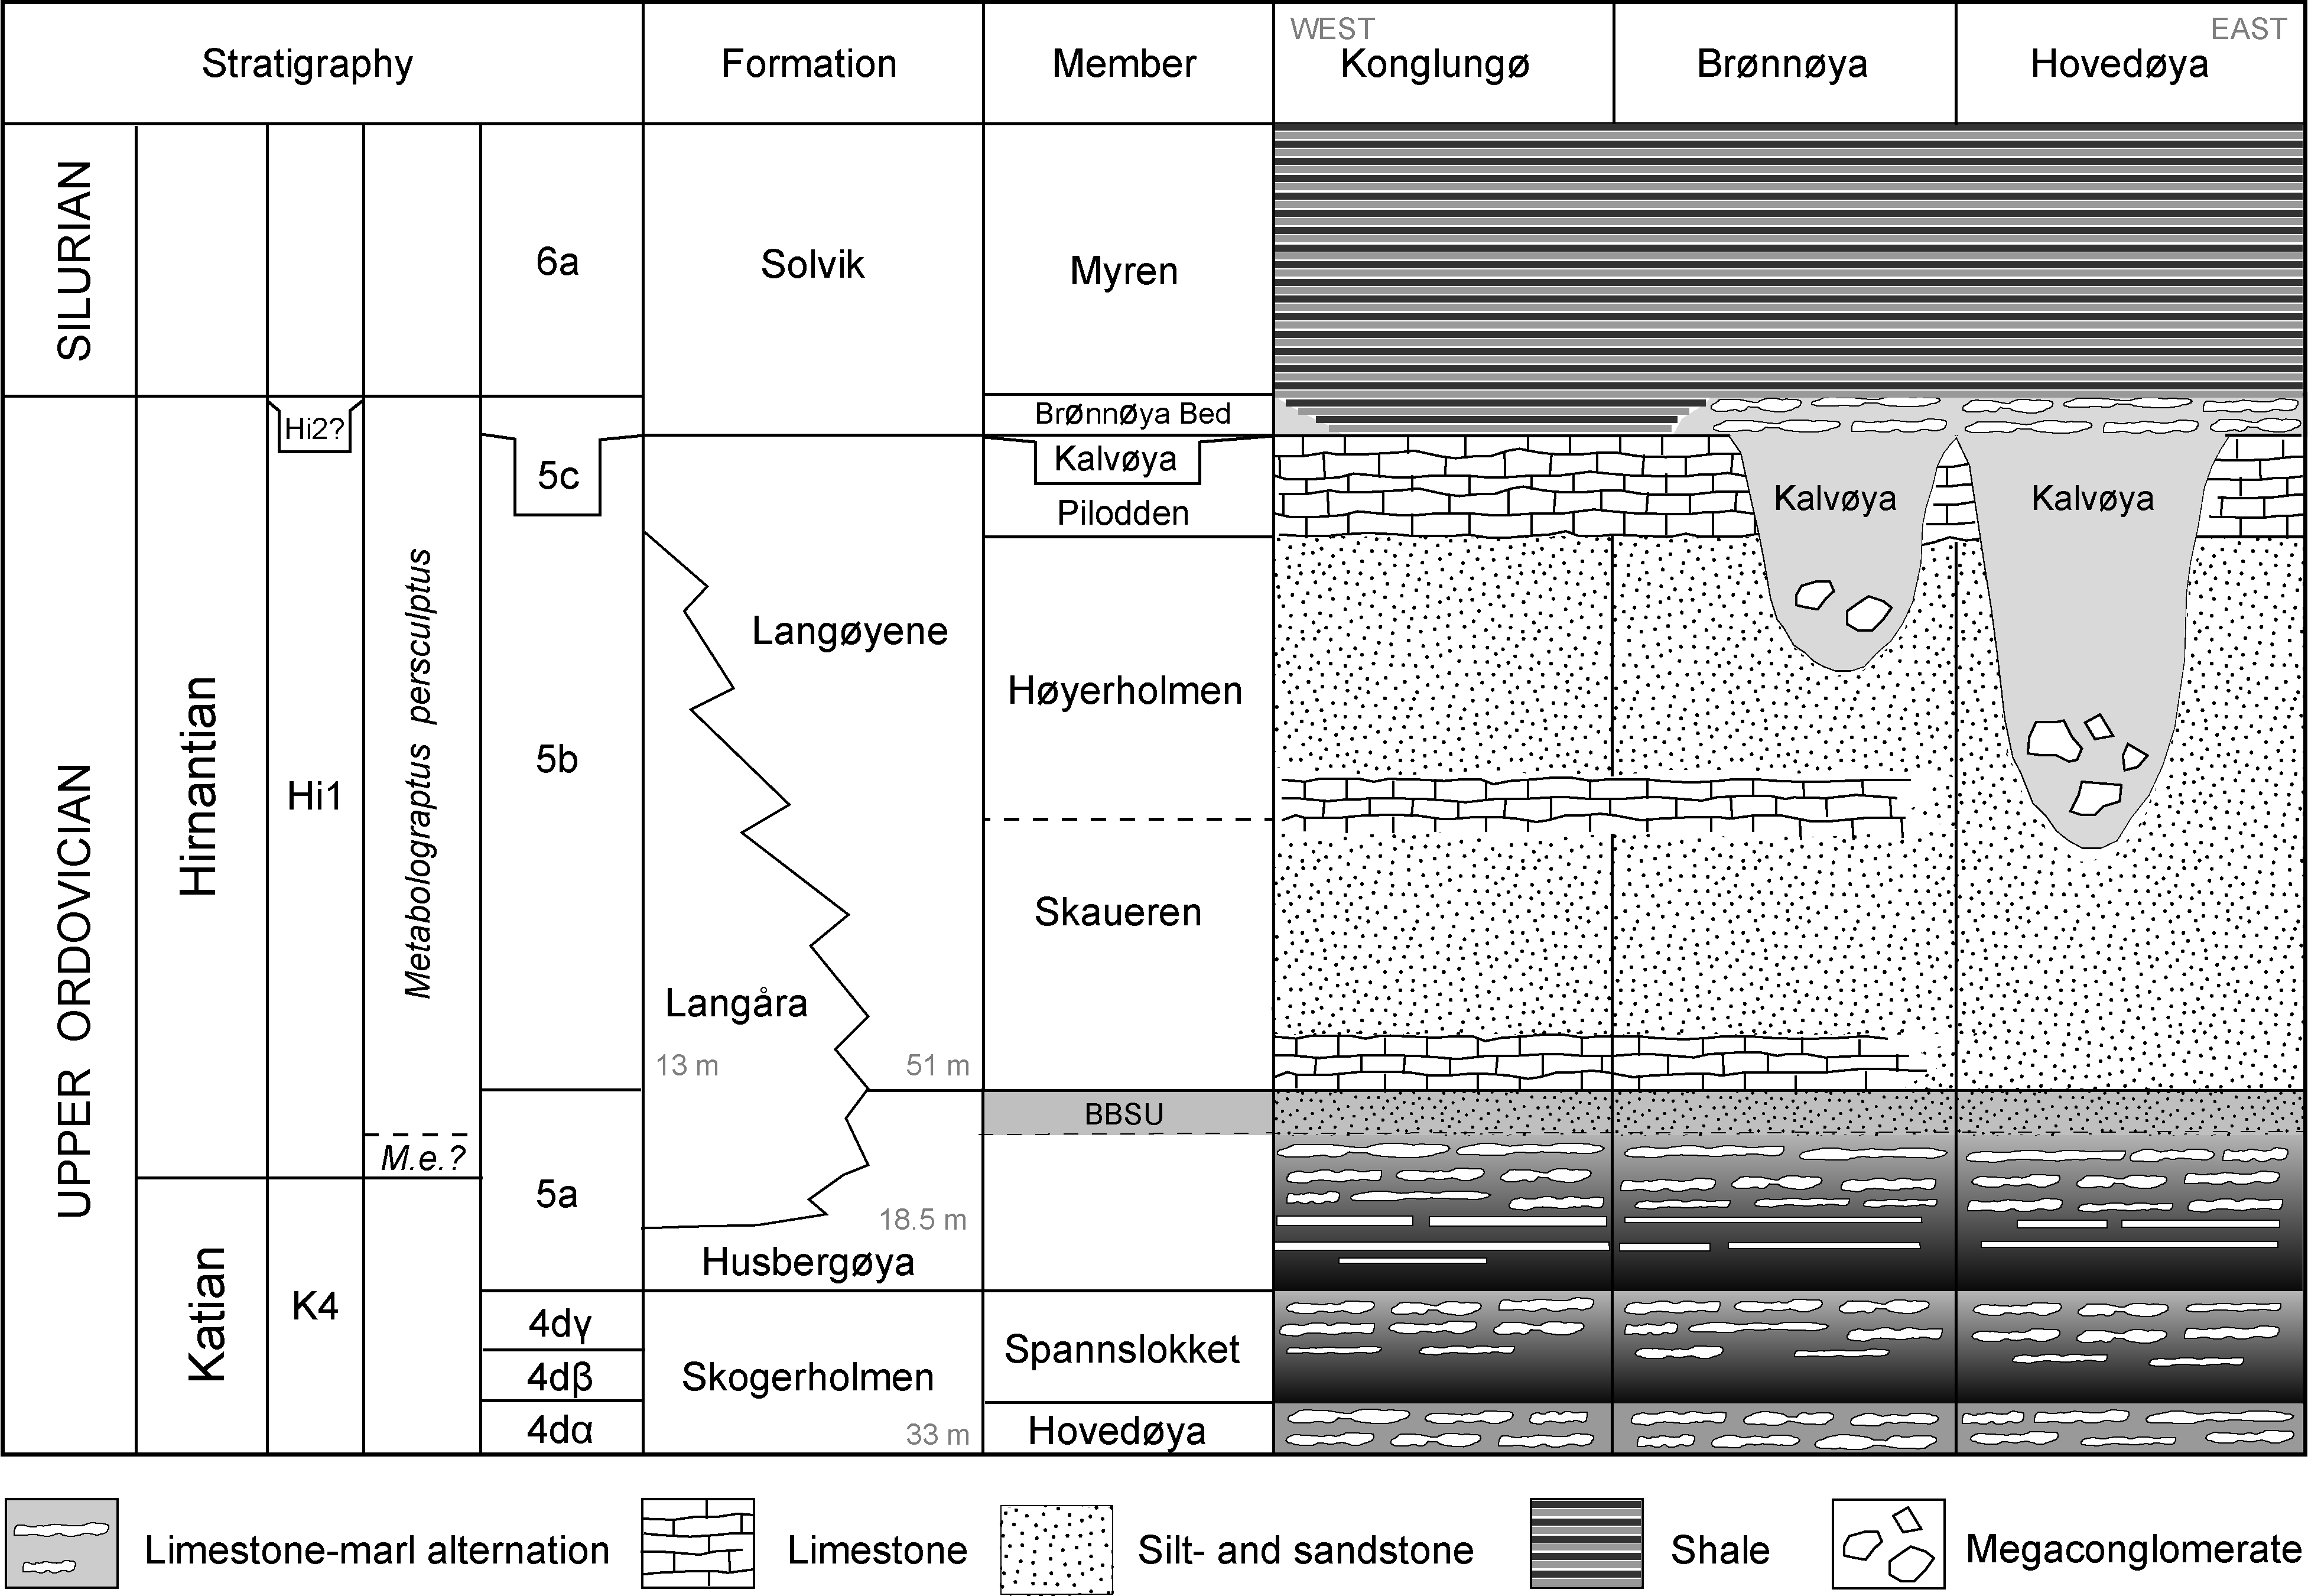
Fig. 2. Upper Ordovician and lower Silurian stratigraphic nomenclature of the Oslo–Asker district as revised by Bockelie et al. (Reference Bockelie, Baarli and Johnson2017). The grey numbers in the formations column mark the thickness of the formations in their respective type section (from Owen et al. Reference Owen, Bruton, Bockelie and Bockelie1990). The older local stratigraphic subdivision of the Skogerholmen Formation (4dα, 4dβ and 4dγ) is based on Størmer (Reference Størmer1953), whereas the local stages 5a–b were introduced by Kiær (Reference Kiær1902) and 5c by Spjeldnæs (Reference Spjeldnæs1957). BBSU = brown bioturbated sandstone unit (an informal but useful marker bed in the uppermost Husbergøya Formation). See Bockelie et al. (Reference Bockelie, Baarli and Johnson2017) for an extended discussion of the Hirnantian stratigraphy of the area.
3. Material and methods
For this paper we have studied and sampled five formations spanning the upper Katian through lowermost Silurian of the Oslo–Asker district: the Skogerholmen Formation, the Husbergøya Shale Formation, the Langåra Limestone–Shale Formation, the Langøyene Sandstone Formation and the Solvik Formation (Fig. 2). M.C. and H.C. studied natural outcrops at six locations during field seasons 2014–16, and J.F.B. participated in two of these fieldworks. The studied localities include the southwestern shore of the island Hovedøya (59° 53′ 30.01″ N, 10° 43′ 52.43″ E), Pilbogen Bay in western Brønnøya (base of section at 59° 51′ 10.90″ N, 10° 31′ 34.28″ E; top of section at 59°51′ 11.32″ N, 10° 31′ 33.95″ E), Store Ostsundet, more specifically near the intersection of Vierndroget and Viernveien in eastern Brønnøya (59° 51′ 47.24″ N, 10° 33′ 20.40″ E), Konglungø (base of section at 59° 50′ 24.46″ N, 10° 30′ 53.72″ E; top of section at 59° 50′ 22.77″ N, 10° 30′ 54.17″ E), Vettre road-cut (59° 49′ 47.35″ N, 10° 28′ 11.54″ E) and Olledalen skytebane (Olledalen shooting range, 59° 50′ 45.22″ N, 10° 22′ 47.61″ E; Fig. 1).
A total of 208 δ13Ccarb whole-rock samples were collected from these localities using a handheld micro-drill. The majority of our carbon isotope data derive from Konglungø (86 samples) and Hovedøya (49 samples), and for this reason these localities are discussed in greater depth. Note that Konglungø is a protected locality (‘Naturminne’) and private property that requires a special permit from both landowner and Fylkesmannen in Viken county to sample.
All δ13Ccarb analyses were carried out at the GeoZentrum of Northern Bavaria of the Friedrich-Alexander University Erlangen–Nuremberg (Germany). The carbonate powders were reacted with 100 % phosphoric acid at 70 °C using a Gasbench II connected to a ThermoFisher V Plus mass spectrometer. All values are reported in per mil relative to V-PDB. Reproducibility and accuracy of carbon isotope analyses was monitored by replicate analysis of laboratory standards calibrated by assigning δ13C values of +1.95 ‰ to NBS19 and −46.6 ‰ to LSVEC. Reproducibility of the δ13C analyses was in the range ±0.02 ‰ to ±0.04 ‰ (± 1 std dev.).
4. Results
4.a. Stratigraphy and sedimentary facies at Konglungø
The Konglungø locality constitutes well-exposed coastal sections displaying Katian through lower Silurian strata, with gravelly beach deposits covering only minor parts of the succession (Fig. 3). The strata represent the southern limb of an anticlinal that strikes SW–NE, and strata are overturned to a near-vertical position. The exposed strata become successively younger to the southeast and belong, in ascending order, to the Skogerholmen, Husbergøya, Langåra, Langøyene and Solvik formations (Figs 3–9). The Skogerholmen Formation (Owen et al. Reference Owen, Bruton, Bockelie and Bockelie1990, p. 33) outcrops in the northernmost end of the section and can be subdivided into three subunits based on lithology, in ascending order referred to as 4dα, 4dβ and 4dγ (sensu Størmer, Reference Størmer1953; Fig. 4a–b). These units, originally part of a local stage (etasje) nomenclature, were later renamed as the Hovedøya Member (4dα) and the Spannslokket Member (4dβ and 4dγ) by Owen et al. (Reference Owen, Bruton, Bockelie and Bockelie1990) but are included here also in their original form for the sake of detail. Only the uppermost c. 7 m of 4dα is exposed at Konglungø (Fig. 4a). Subunits 4dα (7+ m) and 4dγ (9.4 m) constitute nodular to continuous bands of limestone alternating with shale, whereas the intervening 4dβ (5.4 m) is composed of shale with a few laminated siltstone beds (in old literature the ‘Isotelus Shale’). The boundary between 4dβ and 4dγ is taken at the level for the uppermost (youngest) siltstone bed in this part of the section. The Skogerholmen Formation is sharply overlain by the Husbergøya Formation. The latter formation was defined by Brenchley & Newall (Reference Brenchley and Newall1975) and is a shale-dominated succession with an increasing number of calcareous, silty to sandy beds up-section. At Konglungø the formation is 24 m thick. It constitutes a distinct lower shale unit with few, laminated siltstone beds, interpreted as storm deposits (tempestites), which often have a slightly calcareous upper part (Fig. 4c). The siltstone beds become more frequent and thick up-section, suggesting a slight progradation of the depositional system. The lower part of the upper half of the formation is covered by modern beach deposits and could not be assessed. Above this level in the upper parts of the formation, nodular limestone beds become successively more important and here the facies resembles that of the lower Skogerholmen Formation (unit 4dα). This up-section increase in calcareous facies is restricted to the Asker district and does not occur at the type section for this formation at Husbergøya (Brenchley & Newall, Reference Brenchley and Newall1975, p. 256). Towards the top of this unit at Konglungø a rich shelly fauna appears (the first specimens at −21 m in the measured profile; Fig. 8). The topmost c. 2 m of the Husbergøya Formation is developed as a distinct unit of brown siltstone to fine-grained sandstone (Fig. 4e; unit D2 in Figs 3, 9) that is thoroughly bioturbated and homogenized. This unit was recognized at several localities by Brenchley & Newall (Reference Brenchley and Newall1975, figs 6–7) and is a good marker bed in the upper Oslo Fjord area. It is herein referred to as the brown bioturbated sandstone unit to separate it from other brown silt- and sandstone units in the succession that are mentioned in this text. Brenchley & Newall (Reference Brenchley and Newall1975, pp. 258–9) reported Tretaspis sp. from this unit. Later, Brenchley & Cocks (Reference Brenchley and Cocks1982, p. 786 and fig. 4) noted that Tretaspis had its last appearance datum (LAD) within the brown bioturbated sandstone unit and reported an abundant Hirnantia Fauna from the very top of the same unit at one locality in the Oslo Fjord. Based on these findings they placed the base of the Hirnantian Stage there. The brown bioturbated sandstone unit, which is fairly calcareous at Konglungø (but still easily identified), is sharply overlain by a 1.55 m thick, conspicuously light-grey limestone unit with abundant shelly fauna, including solitary streptelasmatid corals, brachiopods, crinoids, bryozoans and the cystoid Heliocrinites sp., sometimes in dense allochthonous concentrations (Figs 4f and 5; unit D1 in Figs 3, 9; see also Neuman, Reference Neuman1969). It also includes abundant, sub-centimetre-sized, reworked clasts of a dark fine-grained lithology implying nearby sea-floor erosion. This limestone belongs to the Langåra Formation, which has a westerly distribution in the Oslo–Asker district (Brenchley & Newall, Reference Brenchley and Newall1975; Bockelie et al. Reference Bockelie, Baarli and Johnson2017), but which interfingers with the sandy Langøyene Formation at Konglungø. Based on its lithology and abundant fossil content, this light-coloured limestone unit (D1) stands out as a higher-energy shallow-water deposit in the overall fine-grained and clastic-dominated facies of the Konglungø section. Its lower half is composed of massive beds of packstone and grainstone whereas the upper half is interbedded with thin shale beds (Fig. 4e). Macrofossils of the unit are disarticulated and relatively worn. The top of the limestone marks a pronounced shift to coarser-grained clastic deposition. These siliciclastics belong lithostratigraphically to the Langøyene Formation and form two sandstone intervals separated by a c. 2 m thick unit of argillaceous limestone and marl (units C3–C1 in Figs 3, 9). The lower sandstone unit (C3) is 6 m thick and characterized by thin to medium-thick hummocky cross-stratified sandstone beds (storm surge deposits of Brenchley et al. Reference Brenchley, Newall and Stanistreet1979; Fig. 6a) interbedded with thin shale beds. It is interpreted as corresponding to the Skaueren Member sensu Bockelie et al. (Reference Bockelie, Baarli and Johnson2017). Between 1.25 and 1.65 m below the top of the lower sandstone unit is a sandstone bed with abundant slump structures (Fig. 6b). The upper sandstone unit (C1) is 5.3 m thick and constitutes thick brown-coloured beds of amalgamated hummocky cross-stratified sandstone beds, i.e. it lacks the abundant shale beds that typify the lower sandstone unit. This unit is interpreted as corresponding to the Høyerholmen Member sensu Bockelie et al. (Reference Bockelie, Baarli and Johnson2017). A second distinct sandstone bed with slump structures occurs at the base of this upper sandstone unit. The calcareous unit (C2) separating the two sandstone intervals is, again, the expression of interfingering with the more westerly Langåra Formation (Fig. 6c). The upper sandstone unit is sharply overlain by a light-grey-coloured, c. 3 m thick and trough cross-bedded oolitic and strongly calcareous sandstone unit (Fig. 7a). This is the Pilodden Member of the Langøyene Formation (sensu Bockelie et al. Reference Bockelie, Baarli and Johnson2017) and unit B in Figures 3 and 9. It varies from being an oolitic sandstone to a sandy oolitic limestone or bioclastic grainstone and forms a distinct marker bed throughout the Oslo–Asker district. It attains a maximum thickness of c. 9 m in the northeastern part of Brønnøya (at 59° 52′ 1.46″ N, 10° 32′ 52.28″ E). The Pilodden Member is commonly trough cross-bedded with sharp, erosive lower and upper contacts. This is the case also at Konglungø where the scoured base of the oolitic sandstone includes scattered reworked clasts of the underlying sandstones (Fig. 7b). The top of the oolitic sandstone at Konglungø is overlain by a few decimetres thin, coarse-grained unit of pure quartz arenite. The quartz grains are well-rounded, sub-spherical and sometimes several millimetres in size and were referred to as ‘millet-seed’ sandstone facies by Brenchley & Newall (Reference Brenchley and Newall1975, p. 263; see also Fig. 7d). This coarse-grained veneer scours down in the underlying oolitic sandstone and includes frequent heavily reworked clasts from that bed. The top surface of the oolitic sandstone is therefore interpreted as an erosional unconformity and the overlying ‘millet-seed’ sandstone unit as a basal transgressive lag deposit (this interpretation is further supported by an offset in δ13C values of more than 2 ‰ across this boundary; see below and Fig. 9). The ‘millet-seed’ sandstone unit is in turn overlain by a yellowish-buff-coloured limestone bed (named ‘kaki-bed’ in Fig. 7). This bed is intriguing because it is a deviating facies to the entire Konglungø section and signals a total stop of influx of coarser siliciclastics to this part of the basin. It represents a brief period of carbonate production and preservation before further rapid deepening of the depositional environment reflected by the black shale of the overlying Solvik Formation (note that Baarli (Reference Baarli2014, fig. 3) formally included this limestone bed in the Solvik Formation). The lower Solvik Formation includes a few, thin limestone beds, notably also a few brachiopod coquinas just above the base of the formation at Konglungø (Fig. 7c). The exact position of the Ordovician–Silurian boundary is uncertain at this locality, but the presence here of the conodont Ozarkodina oldhamensis 8 m above the base of the Solvik Formation implies that the base of the Silurian System is within the lower 8 m of the formation at this locality (Aldridge et al. Reference Aldridge, Jeppsson and Dorning1993; Baarli, Reference Baarli2014, p. 30).
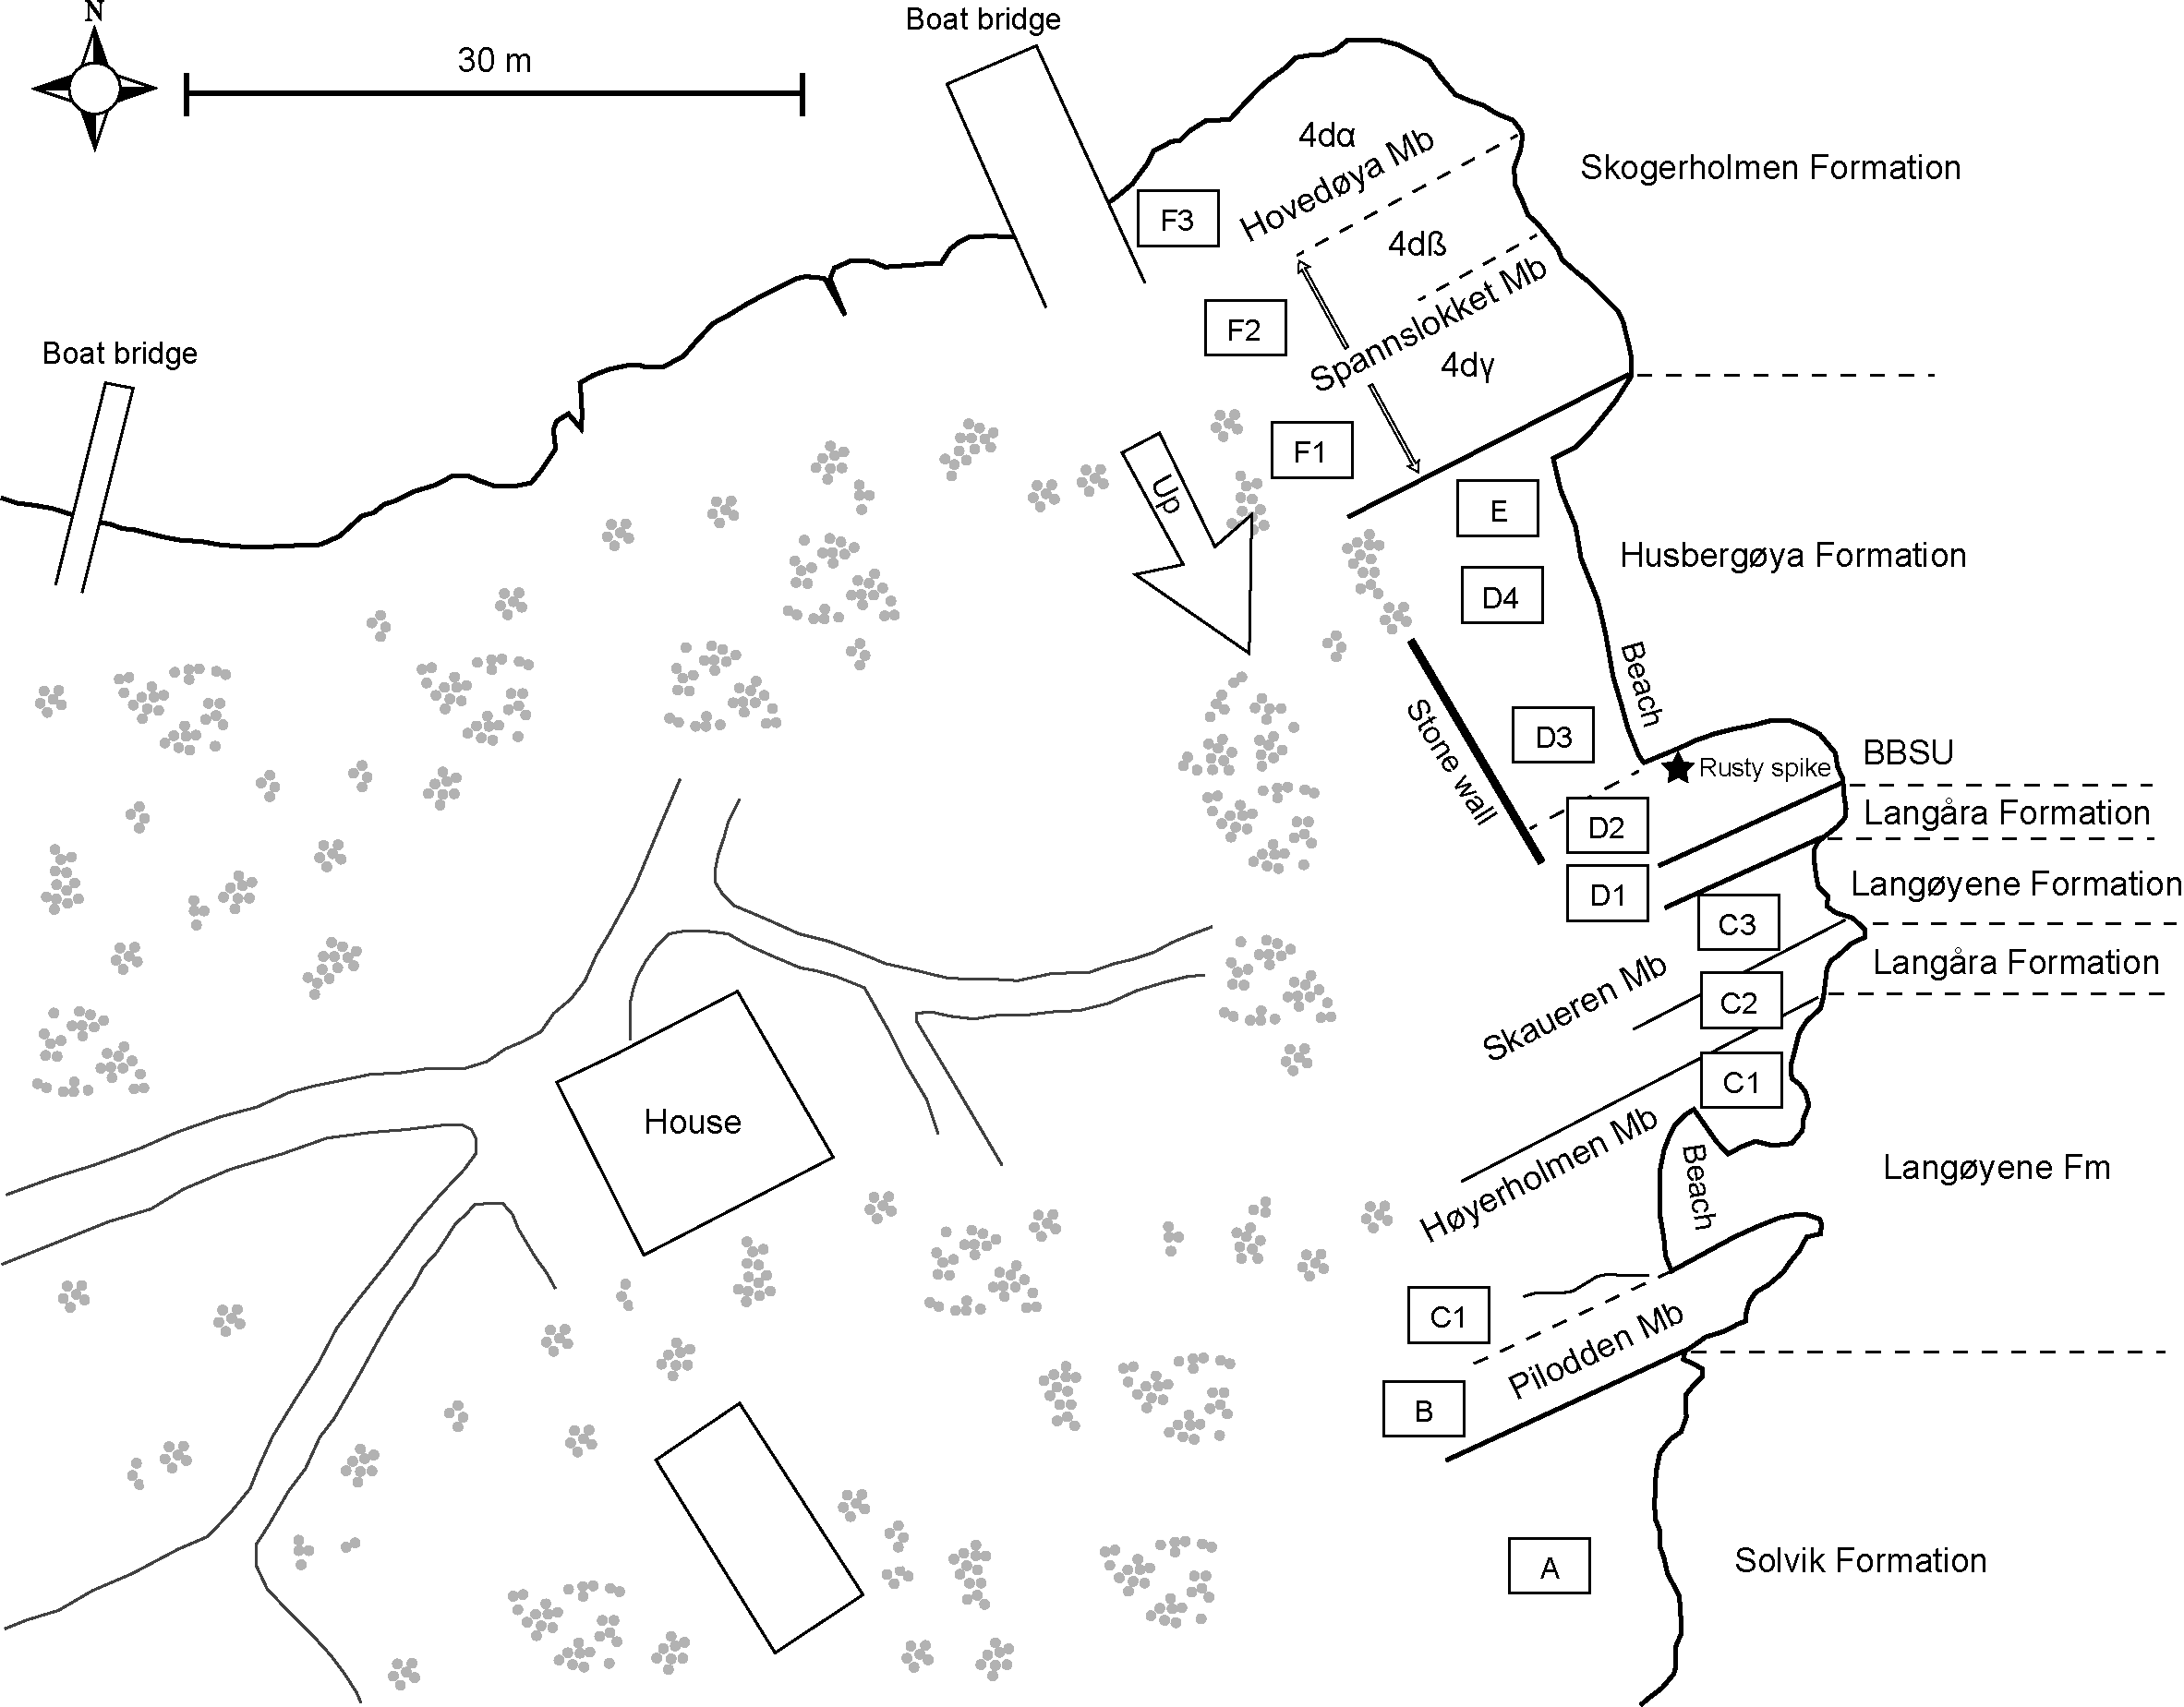
Fig. 3. Sketch showing the stratigraphy at the most expanded section sampled for this study: the eastern end of Konglungø. (Note that access to this private property and sampling here require permission.) The coding from A to F refers to stratigraphic subunits used during field work and therefore may or may not overlap with formal stratigraphic units. They are discussed in the text and are also shown in the photoplates and sedimentary profiles from Konglungø and Brønnøya to facilitate detail (Figs 8–9 and 11). Based on brachiopod faunas and the carbon isotope chemostratigraphy presented herein, the Katian–Hirnantian boundary is drawn in the higher parts of the Husbergøya Formation. BBSU = brown bioturbated sandstone unit.

Fig. 4. Photoplate showing stratigraphy and lithology of the lower parts of the Konglungø section. (a) The lowermost portions of the section at Konglungø exposing the Spannslokket Member of the Skogerholmen Formation, with further stratigraphic subdivision in 4dα, 4dβ and 4dγ (sensu Størmer, Reference Størmer1953). The transition from 4dα to 4dβ marks a deepening of the depositional environment, a decrease of carbonate deposition and a 1 ‰ lowering of δ13C values that may represent a part of either the ‘lower HICE’ or the Paroveja excursion (see text). (b) Limestone–marl alternation of the uppermost Skogerholmen Formation (4dγ) abruptly overlain by shale of the lower Husbergøya Formation. This transition from limestone–marl to shale can be traced throughout the Oslo–Asker district (Brenchley & Newall, Reference Brenchley and Newall1975) and marks a distinct transgression. (c) Lower parts of Husbergøya Formation showing shale succeeded by a gradual up-section increase in carbonate content. The lighter, carbonate-rich bands represent mixed carbonate–siliciclastic distal tempestites. (d) Detail of the middle Husbergøya Formation showing rhythmic bedding of calcareous shale and tempestites. (e) Stratigraphy of the early Hirnantian. The brown bioturbated sandstone unit in the top part of the Husbergøya Formation is c. 2 m thick at Konglungø and is a good marker bed in the area (see Brenchley & Newall, Reference Brenchley and Newall1975). It is rich in shallow-water fossils, notably corals. The rising limb of HICE is identified in the upper Husbergøya Formation and reaches δ13C values between 3 and 4 ‰ in this brown bioturbated sandstone unit (5.15 ‰ in the very top; sample KON66). Also the LAD of Tretaspis and the FAD of Hirnantia Fauna is within this unit (see text). The overlying limestone unit represents the Langåra Formation and marks the end of the rising limb of HICE with all values above 5 ‰ and a top value in its uppermost part of 6.01 ‰ (KON35). Above the limestone is a sharp transition to calcareous sandstone facies of the Langøyene Formation. (f) Solitary corals in the brown bioturbated sandstone unit.

Fig. 5. Polished slab showing abundant solitary streptelasmatid corals, large brachiopods and crinoidal debris in a bioclastic grainstone. This bed derives from the lower portion of unit D1, representing the only clean limestone interval in the succession at Konglungø (interfingering of the westerly Langåra Formation) and which marks shallowing above the fair-weather wave base. Its deposition corresponds to the end of the rising limb of HICE at Konglungø with δ13C values between 5 and 6 ‰. The width of the bed is c. 15 cm.

Fig. 6. Photoplate showing stratigraphy and lithology of the middle parts of the Konglungø section, including divisions of tempestites (sensu Brenchley, Reference Brenchley1989). (a) 30 cm-thick hummocky cross-stratificated, calcareous sandstone of the lower tempestite unit, Skaueren Member in the Langøyene Formation. The thickness of the tempestites and the preservation of only the lower divisions of idealized tempestite sequences suggest rapid deposition in relatively shallow waters, just below the wave base. (b) Calcareous sandstone with slump structures suggesting reworking of sands on relatively steep gradients, such as in a delta front environment. (c) Limestone–marl alternation between the lower and upper sandstone units, representing interfingering of the westerly Langåra Formation.

Fig. 7. Photoplate showing stratigraphy and lithology of the upper parts of the Konglungø section. (a) Transition from the upper Langøyene Formation to the Silurian Solvik Formation. The amalgamated storm beds of the upper tempestite unit (Høyerholmen Member) are overlain sharply by oolitic sandstone (Pilodden Member). The latter unit is a widespread marker bed in the upper Oslo Fjord, its maximum thickness reaching c. 9 m at Brønnøya. (b) Detail of the unconformable transition from tempestite facies to oolitic sandstone showing larger-scale trough cross-bedding. (c) The top of the Langøyene Formation at Konglungø. The upper boundary of the oolitic sandstone is overlain by a thin unit of unusually coarse quartz grains – the ‘millet-seed’ sandstone of previous authors. This small unit also contains several clasts reworked from the underlying oolitic sandstone. These clasts along with a drop of δ13C values exceeding 2 ‰ between the oolitic sandstone and the ‘millet-seed’ sandstone unit imply erosion below the latter unit. The ‘millet-seed’ sandstone unit thus is a transgressive lag deposit. It is overlain by a thin calcareous bed referred to herein to as the ‘kaki bed’ due to its kaki colour. (d) Detail of the ‘millet-seed’ sandstone unit above the eroded oolitic sandstone.
4.a.1. Carbon isotope stratigraphy at Konglungø and chitinozoan biostratigraphy
Eighty-six carbon isotope samples were taken at Konglungø (Figs 8–9; Appendix 1). The carbon isotope stratigraphy presented is not complete, due to the partial coverage of the succession by modern beach deposits, but still provides the best record so far for correlation of the strata and for a chemostratigraphic identification of the Hirnantian in Norway. Even if there are abundant shaly intervals in the succession, most of it has interlayered, slightly argillaceous micritic limestone or even clean limestone from which the samples were taken. This was the case for the Skogerholmen and much of the Husbergøya formations. In the lowermost Solvik Formation, samples were taken from thin limestone beds (brachiopod coquinas) interlayered in the shale. The two calcareous sandstone units in the Langøyene Formation include primary skeletal debris and are fairly calcareous in the Asker district; however, that part of the curve may partly reflect precipitation of cement during the early diagenesis.

Fig. 8. Sedimentary log profile and carbon isotope stratigraphy of the lower and middle parts of the Konglungø section. The lowermost five samples (KON72-KON76) may represent the falling limb of the ‘early HICE’ carbon isotope excursion or, less likely, the Paroveja excursion. The start of HICE is herein defined as at sample KON47, and the remainder of the section constitutes the rising limb of the HICE (see text for discussion). Note that the chitinozoans B. gamachiana and S. cf. taugourdeaui are approximated into the section based on findings in Hovedøya (Amberg et al. Reference Amberg, Vandenbroucke, Nielsen, Munnecke and McLaughlin2017). These levels are confidently correlated, however, based on the very similar facies development and carbon isotope data.

Fig. 9. Sedimentary log profile and carbon isotope stratigraphy of the upper parts of the Konglungø section. The vertical repetition of Langåra and Langøyene formations is due to interfingering of westerly carbonate (Langåra) and easterly siliciclastic (Langøyene) facies in this area. The δ13C values remain high throughout the Langøyene Formation. This is the plateau of the HICE. Note the offset in δ13C values of more than 2 ‰ at the top of the Pilodden Member, marking a major unconformity. Strata holding the falling limb of the HICE are clearly eroded along this unconformity.
The lower portions of the section, corresponding to the middle and upper Skogerholmen Formation through the middle parts of the Husbergøya Formation, have δ13C values between 0 and 1 ‰. There is one deviation from these baseline values that may be of importance for at least regional correlation of the strata, namely the distinctly higher δ13C values in the top of the Hovedøya Member (unit 4dα) of the Skogerholmen Formation (e.g. samples KON76: 1.39 ‰; and KON74: 1.55 ‰). The corresponding strata at Hovedøya include the chitinozoan Belonechitina gamachiana (Amberg et al. Reference Amberg, Vandenbroucke, Nielsen, Munnecke and McLaughlin2017), which in North American sections has been reassigned to the lowermost Hirnantian (Delabroye & Vecoli, Reference Delabroye and Vecoli2010; Amberg et al. Reference Amberg, Vandenbroucke, Nielsen, Munnecke and McLaughlin2017). The higher δ13C values in the top of the Hovedøya Member would then potentially reflect the falling limb of the ‘lower HICE’ identified in Anticosti Island, Canada (Mauviel & Desrochers, Reference Mauviel and Desrochers2016), and possibly in Mirny Creek, Siberia (Kaljo et al. Reference Kaljo, Männik, Martma and Nõlvak2012). The implications in the studied area would be significant as the preserved Hirnantian succession would then be more than 60 m thick. Further, the base of the Hirnantian would be situated more than 40 m below the FAD of the Hirnantia Fauna. It would also suggest – as inferred based on the data presented here – that the main part of the Skogerholmen and Husbergøya formations belonged in the M. extraordinarius Graptolite Zone, since high δ13C values globally appear to be restricted to the M. persculptus Zone.
Another option is that the higher δ13C values at the top of the Hovedøya Member reflect the falling limb of the Paroveja excursion of Ainsaar et al. (Reference Ainsaar, Kaljo, Martma, Meidla, Männik, Nõlvak and Tinn2010). This small positive excursion is known from the East Baltic area where δ13C values reach between 1.5 and 2 ‰ (very similar to the ‘lower HICE’) and form isotopic zone no. 14 (BC14; see Ainsaar et al. Reference Ainsaar, Kaljo, Martma, Meidla, Männik, Nõlvak and Tinn2010). It is, however, associated with the chitinozoan Conochitina rugata and the eponymous biozone and thus distinctly older than the B. gamachiana Biozone (cf. Nõlvak et al. Reference Nõlvak, Hints and Männik2006; Amberg et al. Reference Amberg, Vandenbroucke, Nielsen, Munnecke and McLaughlin2017). Future sampling of the lowermost c. 3 m of the exposed strata at Konglungø, and at the type section for the Skogerholmen Formation, may help to further constrain the relationship between B. gamachiana and carbon isotope stratigraphy and thus clarify this stratigraphic problem.
In the basal Spannslokket Member (unit 4dγ), sample KON83 represents the stratigraphic level of the lowest δ13C value of the whole Konglungø section (0.11 ‰) and reflects the turning point to constantly increasing δ13C values that reach slightly more than 1 ‰ in the top of the Skogerholmen Formation. δ13C data are lacking from the shales of the lower Husbergøya Formation. The next few metres of the section are covered by beach deposits, and no isotope data exist. Higher up in the more limy parts of the formation, δ13C steadily increases to values of almost 5 ‰ in the uppermost part of the Husbergøya Formation. We interpret this rise as the rising limb of the HICE and we assign the start of it to sample KON47 in Figure 8. The most rapid rate of change in δ13C values takes place between c. −23 m and −21 m in the section (thus very close to the ‘rusty spike’ in the section, marked in Figs 3 and 8). Here δ13C values increase by c. 1 ‰ per metre section.
In the fossiliferous packstone and grainstone of the Langåra Formation (unit D1), δ13C reaches peak values between c. 5.5 and 6 ‰ (Fig. 9). The top of the limestone marks a major change in sedimentation pattern and a rapid transition to coarser siliciclastic tempestites of the Langøyene Formation. The δ13C record shows less good stability through the overlying subunits (C3, C2 and C1); something that likely relates to the rhythmic sedimentation and high clastic influx during the corresponding time interval. It is possible, however, to see a weak falling trend in the δ13C values within this interval.
The erosional contact between the amalgamated sandstone beds of the Høyerholmen Member (unit C1) and the overlying oolitic quartz arenite of the Pilodden Member (unit B) is not associated with any marked offset in the δ13C record (Fig. 9). The top of the oolitic unit, however, clearly represents a stratigraphic gap of a more significant nature. A major part of the falling limb of the HICE is cut out at this level, and isotope values drop by more than 2 ‰ over a bedding plane (Fig. 9). Based on both sedimentology and carbon isotope stratigraphy, the unconformity is at the top of the oolitic sandstone unit and overlain by the thin but coarse-grained, dark sandstone unit referred to as the ‘millet-seed’ sandstone unit in Figures 7c–d and 9. The millet-seed sandstone unit is overlain by the ‘kaki bed’ in which two samples gave δ13C values of c. 1.5 ‰ and 1.9 ‰, respectively. The kaki bed is overlain by black shale of the Solvik Formation. A few limestone beds (brachiopod coquinas) occur in the lowermost metre of the Solvik Formation. The two lowermost of these have δ13C values of 0.96 ‰ and 0.83 ‰ (KON9 and KON10, respectively), suggesting a Silurian age. The next and highest sampled bed for this study, however, shows a distinct increase to 1.7 ‰ (KON11).
4.a.2. Biostratigraphical inference at Konglungø based on brachiopods
As the geological setting of the Oslo–Asker district is tectonically complex, stratigraphical correlations are sometimes difficult to make even within short distances. The studied succession, unfortunately, lacks graptolites, making it more difficult to correlate to global events. Some levels, though, are rich in shelly fossils, and brachiopod faunas in particular have traditionally been applied for resolving stratigraphical issues. The following stratigraphic data are largely owed to the information provided by Brenchley & Cocks (Reference Brenchley and Cocks1982) and Cocks (Reference Cocks1982).
Brenchley & Cocks (Reference Brenchley and Cocks1982) conducted a thorough palaeoecological study across the Hirnantian successions in the Oslo–Asker district, including the Konglungø section (their ‘Konglungen E 16’ locality; e.g. their fig. 3), in which they assigned laterally distinguishable brachiopod associations. Bockelie et al. (Reference Bockelie, Baarli and Johnson2017) resolved the regional Hirnantian lithostratigraphy, enabling an interpretation that placed the brachiopod associations of Brenchley & Cocks (Reference Brenchley and Cocks1982) in biostratigraphically discernible patterns across the region. As some of the faunas were found specifically at Konglungø – the main locality of the current study – we here place our main section into this biostratigraphical context.
Towards the top of the Husbergøya Formation, the Onniella Association is developed, which along with the trilobite Tretaspis contains the brachiopod species Onniella kalvoya, Eoplectodonta oscitanda, as well as a species of Nicolella. Partly overlapping and succeeding this fauna is a moderately diverse fauna assignable to the Hirnantia Fauna, with typical elements such as H. saggitifera, Dalmanella testudinaria, along with Cliftonia aff. psittacina, Eostropheodonta hirnantensis and Hindella cassidea (Brenchley & Cocks Reference Brenchley and Cocks1982, p. 795). This fauna, which historically denotes the lower-middle Hirnantian (Harper et al. Reference Harper, Hammarlund and Rasmussen2014), occurs at the top of the Husbergøya Formation and continues a few metres into the overlying Langøyene Formation. In a recent review, however, Rong et al. (Reference Rong, Harper, Bing, Li, Zhang and Chen2020) demonstrated that the Hirnantia Fauna is indeed diachronous, reaching into the M. persculptus Graptolite Zone in places. Our isotopic data support a late Hirnantian age for these strata. According to Brenchley & Cocks (Reference Brenchley and Cocks1982), this fauna is partly overlapping with the Cliftonia–Hindella Association, which is best developed in the more limestone-dominated western part of the outcrop area, corresponding to the two wedges of the Langåra Formation at Konglungø. The latter fauna consists of Hindella cassidea, Cliftonia aff. psittacina, Eostropheodonta hirnantensis and Triplesia sp., among others. The Dalmanella Association is a reduced variety of the Hirnantia and Hindella–Cliftonia associations and is strongly dominated by Dalmanella testudinaria, whereas all other brachiopod genera ‘occur sporadically and in low numbers’ (Brenchley & Cocks, Reference Brenchley and Cocks1982, p. 799). The Dalmanella Association occurs in the regressive facies immediately above the Hirnantia Association in the Langøyene Formation. According to Rong et al. (Reference Rong, Harper, Bing, Li, Zhang and Chen2020), both the Cliftonia–Hindella and the Dalmanella associations developed in the Oslo–Asker district may represent a low-diversity Hirnantia Fauna.
Lastly, the topmost strata of the Langøyene Formation contain the oolitic Pilodden Member. Brenchley & Cocks (Reference Brenchley and Cocks1982, pp. 802–4) reported on abundant coquinas of Brevilamnulella kjerulfi and Thebesia scopulosa together with elements typical of the Edgewood Fauna (sensu Rong & Harper, Reference Rong and Harper1988). These species were found in either oolitic–bioclastic limestone, siltstone or sandstone, and in both the eastern and western part of the herein studied area. The finds likely represent the Pilodden Member as well as stratigraphic levels within incised valleys cut in that member, thus the Kalvøya Member (cf. Brenchley & Cocks, Reference Brenchley and Cocks1982). Both the Brevilamnulella and the Thebesia associations are regarded as latest Hirnantian in age.
4.b. Stratigraphy and sedimentary facies at Brønnøya
The Husbergøya, Langåra and Langøyene formations are fairly well exposed along the shore at Pilbogen Bay in the western part of the island of Brønnøya (Fig. 10). The measured succession here starts in the upper Husbergøya Formation at a level that was covered by beach gravel at Konglungø (corresponding to somewhere between −31 and −24 m at that locality). The exposed strata are of the same thickness as at Konglungø, although the relative thickness of the constituent subunits differs. A notable similarity is the sudden appearance of a rich shelly fauna in the uppermost Husbergøya Formation, i.e. at the same level as at Konglungø and during the rising limb of the HICE.

Fig. 10. Photoplate showing stratigraphy and lithology of the lower parts of the section at Pilbogen bay and at Store Ostsundet, both at Brønnøya. (a) Measured section at Pilbogen bay in southwestern Brønnøya. The stratigraphy much resembles that at Konglungø, 1600 m to the southwest, with the rising limb of the HICE identified in the upper Husbergøya Formation in the left part of the photograph. As on Konglungø, the start of the HICE is associated with the appearance of abundant shelly fossils, including corals. (b) Trough cross-laminated sandstone overlain by thick-bedded hummocky cross-stratified sandstone (upper tempestite unit of the Høyerholmen Member, Langøyene Formation). (c) Conglomerate clasts (arrows) of oolitic sandstone embedded in fine clastic rocks at Store Ostsundet, southeastern Brønnøya. The clasts have δ13C values of 4.18 ‰ and 5.90 ‰ (samples BD5 and BD6 in Fig. 12), clearly indicating a Hirnantian age for the conglomerate.
4.b.1. Carbon isotope stratigraphy at Brønnøya
Twenty-five carbon isotope samples were taken at Pilbogen Bay (Fig. 11; Appendix 1). The sampling was not as dense as at Konglungø, but the rising limb of the HICE is nevertheless well indicated. The lowermost δ13C samples in the upper Husbergøya Formation scatter around 1.5–1.75 ‰ and thereafter rise steadily through the remainder of the formation to c. 4 ‰ (sample BR19) in the brown bioturbated sandstone unit at the top of the formation. δ13C values increase further to 5.5 ‰ in the higher parts of the interfingering Langåra Formation (subunit C2), similar to at Konglungø. The middle parts of the section at Pilbogen were not sampled, but the higher parts of the Langøyene Formation including the overlying oolitic sandstone (Pilodden Member) yield δ13C values above 4 ‰ and 5 ‰, respectively, also in good correspondence with nearby Konglungø.

Fig. 11. Log profile and carbon isotope stratigraphy of the Pilbogen bay locality showing the rising limb of the HICE in the upper part of the Husbergøya Formation. The oolitic sandstone is overlain by shales of the Solvik Formation, and, although the latter formation outcrops in near proximity, the contact is not readily exposed at the locality. In overall terms the stratigraphy much resembles that at nearby Konglungø. Note, however, the different thicknesses of the Skaueren and Høyerholmen members as compared to their thicknesses at Konglungø, suggesting locally complex depositional patterns.
4.b.2. Store Ostsundet, southeastern Brønnøya
A conglomerate that, based on lithologic similarity, derives from the oolitic sandstone in the topmost Langøyene Formation is exposed at Store Ostsundet on the southeastern shore of Brønnøya (Fig. 1). A carbon isotope sample from an oolitic sandstone clast here (Fig. 10c) gives a δ13C value of 5.9 ‰ (sample BD05, Fig. 12), which is consistent with the oolitic sandstone at Pilbogen Bay, Konglungø and Hovedøya. The stratigraphic origin of this conglomerate is thus confirmed. The conglomerate and the falling δ13C trend in the immediately overlying strata at Store Ostsundet imply that the conglomerate here represents reworked parts of the Pilodden Member and that the overlying strata represent the same type of incised valley fill that is demonstrated from Hovedøya (see below).

Fig. 12. Log profile and carbon isotope stratigraphy at Store Ostsundet section, southeastern Brønnøya. Note high δ13C values in the oolitic sandstone clasts (samples BD5 and BD6).
4.c. Stratigraphy and sedimentary facies at Hovedøya
The overturned strata along the southwestern shores of Hovedøya (Fig. 1) were assigned the Norwegian type section for the base of the Hirnantian Stage and the Ordovician–Silurian boundary by Brenchley & Newall (Reference Brenchley and Newall1975, p. 253; see also Kiær Reference Kiær1908; Spjeldnæs Reference Spjeldnæs1957; Bockelie et al. Reference Bockelie, Baarli and Johnson2017). Here, the oolitic sandstone of the Pilodden Member, Langøyene Formation, is separated from the overlying black shales of the Solvik Formation by a 0.6 m thick brown siltstone unit (Kalvøya Member of Bockelie et al. Reference Bockelie, Baarli and Johnson2017) followed by a 0.6 m thick nodular limestone unit (Brønnøya Bed of Bockelie et al. Reference Bockelie, Baarli and Johnson2017; Fig. 13a). These two units have been discussed previously with regard to both environmental significance and the placement of the Ordovician–Silurian boundary and have been loosely referred to as the ‘transitional beds’ between the Langøyene and Solvik formations. Kiær (Reference Kiær1908) placed the O–S boundary on the top of the brown siltstone unit, whereas Worsley (Reference Worsley1982) later placed it at the top of the nodular limestone. Based on the occurrence of Ordovician brachiopods at least 50 m into the Solvik Formation, Baarli (Reference Baarli2014, p. 30, and pers. comm., 2020) argues that the Ordovician–Silurian boundary should be placed far higher up in the east part of the Oslo–Asker district, although there is to date no detailed faunal information published from the sections to define a more precise level.

Fig. 13. Photoplate showing stratigraphy and lithology of the overturned Ordovician–Silurian stratotype section at Hovedøya (eastern part). (a) The top of the Langøyene Formation at the classical and often-visited Ordovician–Silurian boundary stratotype locality (for additional information see Calner et al. Reference Calner, Ahlberg, Lehnert and Erlström2013, stop 23). Here, grey oolitic sandstone is unconformably overlain by a brown siltstone unit and a nodular limestone unit (the ‘transitional beds’ in the early literature and now defined as the Kalvøya Member and Brønnøya Bed, respectively, by Bockelie et al. Reference Bockelie, Baarli and Johnson2017). Above the nodular limestone unit is a sharp transition to the black shales of the Solvik Formation. The base of the nodular limestone unit was defined as the Ordovician–Silurian boundary by Brenchley & Newall (Reference Brenchley and Newall1975, p. 253; their top ‘Stage 5’). The boundary has later been shown to be higher up in the Solvik Formation (see text), but δ13C values of 1.17 ‰ (sample H23) and 1.26 ‰ (sample H22) in the thin limestone horizons of the basal Solvik Formation support a Silurian age also for this part (see also Fig. 15). (b) Top of the Langøyene Formation west of the section depicted in (a). Here the brown siltstone unit and the nodular limestone unit are developed in a very similar way to at the section described above. Note, however, how the light-coloured oolitic sandstone unit (Pilodden Member) is eroded away and only exists as conglomerate clasts several metres above the nodular limestone unit (Brønnøya Bed). Note distinct thickening of the the Kalvøya Member. The corresponding facies represents the peripheral wing of the incised valley further to the west.
The stratigraphic and depositional meaning of the ‘transitional beds’, i.e. the brown siltstone unit and the nodular limestone, is now understood due to the exceptionally detailed mapping of the southwestern shores of the island by J.F.B. (first published by Bockelie Reference Bockelie, Calner, Ahlberg, Lehnert and Erlström2013, p. 82; Bockelie et al. Reference Bockelie, Baarli and Johnson2017): when these ‘transitional beds’ are traced a few hundred metres laterally from the section depicted in Figure 13a, towards the west along the present-day shore, it is clear that they are no longer underlain by the oolitic sandstone. Instead they are underlain by thinly bedded siltstone and limestone, and the oolitic sandstone only occurs as reworked clasts in a conspicuous conglomerate a few metres stratigraphically below the brown siltstone unit (Fig. 13b). The distance between this oolitic sandstone conglomerate and the brown siltstone unit then increases successively towards the west, and the size of conglomerate clasts increases substantially, the biggest clast reaching more than 1.5 m in width (Bockelie et al. Reference Bockelie, Baarli and Johnson2017; Fig. 14). Bockelie et al. (Reference Bockelie, Baarli and Johnson2017) showed that the strata between the conglomerate and the brown siltstone unit have the geometry of an incised valley fill, of which only the thin eastern flank or wing is represented at the often-visited, classical type section. To the west the valley fill, which may be partitioned into eight lithological units, cut at least 16 m into the deeper levels of the Langøyene Formation (Bockelie et al. Reference Bockelie, Baarli and Johnson2017, fig. 9). Of biostratigraphical importance to the current study, unit 6 – which only outcrops above present-day sea-level in the eastern part of this palaeovalley – contains abundant Hindella cassidea, along with rhynchonellid brachiopods (Stegerhynchus?). Towards the top of the overlying fossiliferous and 3.5 m thick unit 7, Hindella cassidea reoccurs, this time together with Thebesia scopulosa, among other taxa.

Fig. 14. Photoplate showing stratigraphy and lithology of the overturned Ordovician–Silurian stratotype section at Hovedøya (western part). (a) A major erosional unconformity is prominent along the southwestern shore of the island. The incised valley fill was subdivided into nine subunits by Bockelie et al. (Reference Bockelie, Baarli and Johnson2017) and sampled for carbon isotope stratigraphy in the present study. (b) Position of isotope samples 12 and 13 just beneath the deepest cut of the incised valley. Relatively high δ13C values of these samples imply that the topmost beds underlying the incised valley fill, i.e. lower portions of the Langøyene Formation, are still lower Hirnantian. (c) Reworked conglomerate slabs of light-coloured oolitic sandstone of the Pilodden Member, the largest c. 1.5 m across, in the lower portions of the incised valley fill. (d) Reworked clasts of the Pilodden Member within the incised valley fill.
4.c.1. Carbon isotope stratigraphy at Hovedøya
Forty-nine carbon isotope samples were taken at Hovedøya: 23 from the type section depicted in Figure 13a, and 26 from the incised valley fill (Figs 15–16; Appendix 1). Our first δ13C record from the type section clearly demonstrates the unconformity between the oolitic sandstone (Pilodden Member) and the brown siltstone, over which boundary there is a negative jump in δ13C values exceeding 3 ‰ (Fig. 15a), fairly similar to the corresponding transition at Konglungø. In May 2016 we returned to collect rock samples for δ13C analysis from a number of levels throughout the adjacent incised valley fill (Figs 14, 15b); starting just west of the type section and moving further west into the valley fill in order to cover the missing strata at the type section unconformity. These valley fill strata have been subdivided into nine subunits based on lithology (Bockelie et al. Reference Bockelie, Baarli and Johnson2017; units 8 and 9 representing the brown siltstone unit and the nodular limestone (Brønnøya Bed), respectively). The two lowermost carbon isotope samples from this section (H12 and H13) were taken in the strata immediately below the incised valley fill (Fig. 14b) and gave δ13C values of 2.6 ‰, suggesting an early Hirnantian age for the youngest preserved strata under the deepest part of the incised valley. Two samples (H1 and H2) from basal conglomerate clasts of oolitic sandstone c. 5 m west of the diabase dike west of the type section gave δ13C values of 4.2 ‰ and 4.1 ‰. Two samples (H14 and HOV24) from a similar conglomerate clast further west along the base of the incised valley gave δ13C values of c. 5.4 ‰ and 4.1 ‰, respectively. These four values are consistent with the oolitic sandstone of the Pilodden Member at the type section further east, at Konglungø, and with the peak values of the HICE in the area. Hence, not only lithological similarity and stratigraphical relationships, but also geochemical evidence, proves the clasts to be reworked parts of the Pilodden Member, which is widespread in outcrops in the Oslo Fjord area. Above the conglomerates, within the incised valley fill our carbon isotope data clearly show a falling trend from top values between 4.3 and 4.4 ‰ (samples H19, H21, H22) in the lower portions to values between 1 and 2 ‰ in the brown siltstone (unit 8 of Bockelie et al. Reference Bockelie, Baarli and Johnson2017). A sudden rise of values to c. 3 ‰ occurs in the nodular limestone unit (Brønnøya Bed) that marks the top of the incised valley fill at the point when most topography was levelled. Above the incised valley fill, in the type section, the values continue to decline to 1.2 ‰ and 1.3 ‰ (samples HOV22–23 in Fig. 8). In summary, (1) the erosion associated with the incised valley on Hovedøya never cut into Katian strata, (2) oolitic conglomerate clasts at the bottom of the valley fill are lithologically identical to the Pilodden Member and also record Hirnantian δ13C peak values, providing evidence for the timing of erosion, and (3) the major part of the falling limb of HICE is preserved in the valley fill succession immediately overlying the conglomerate.
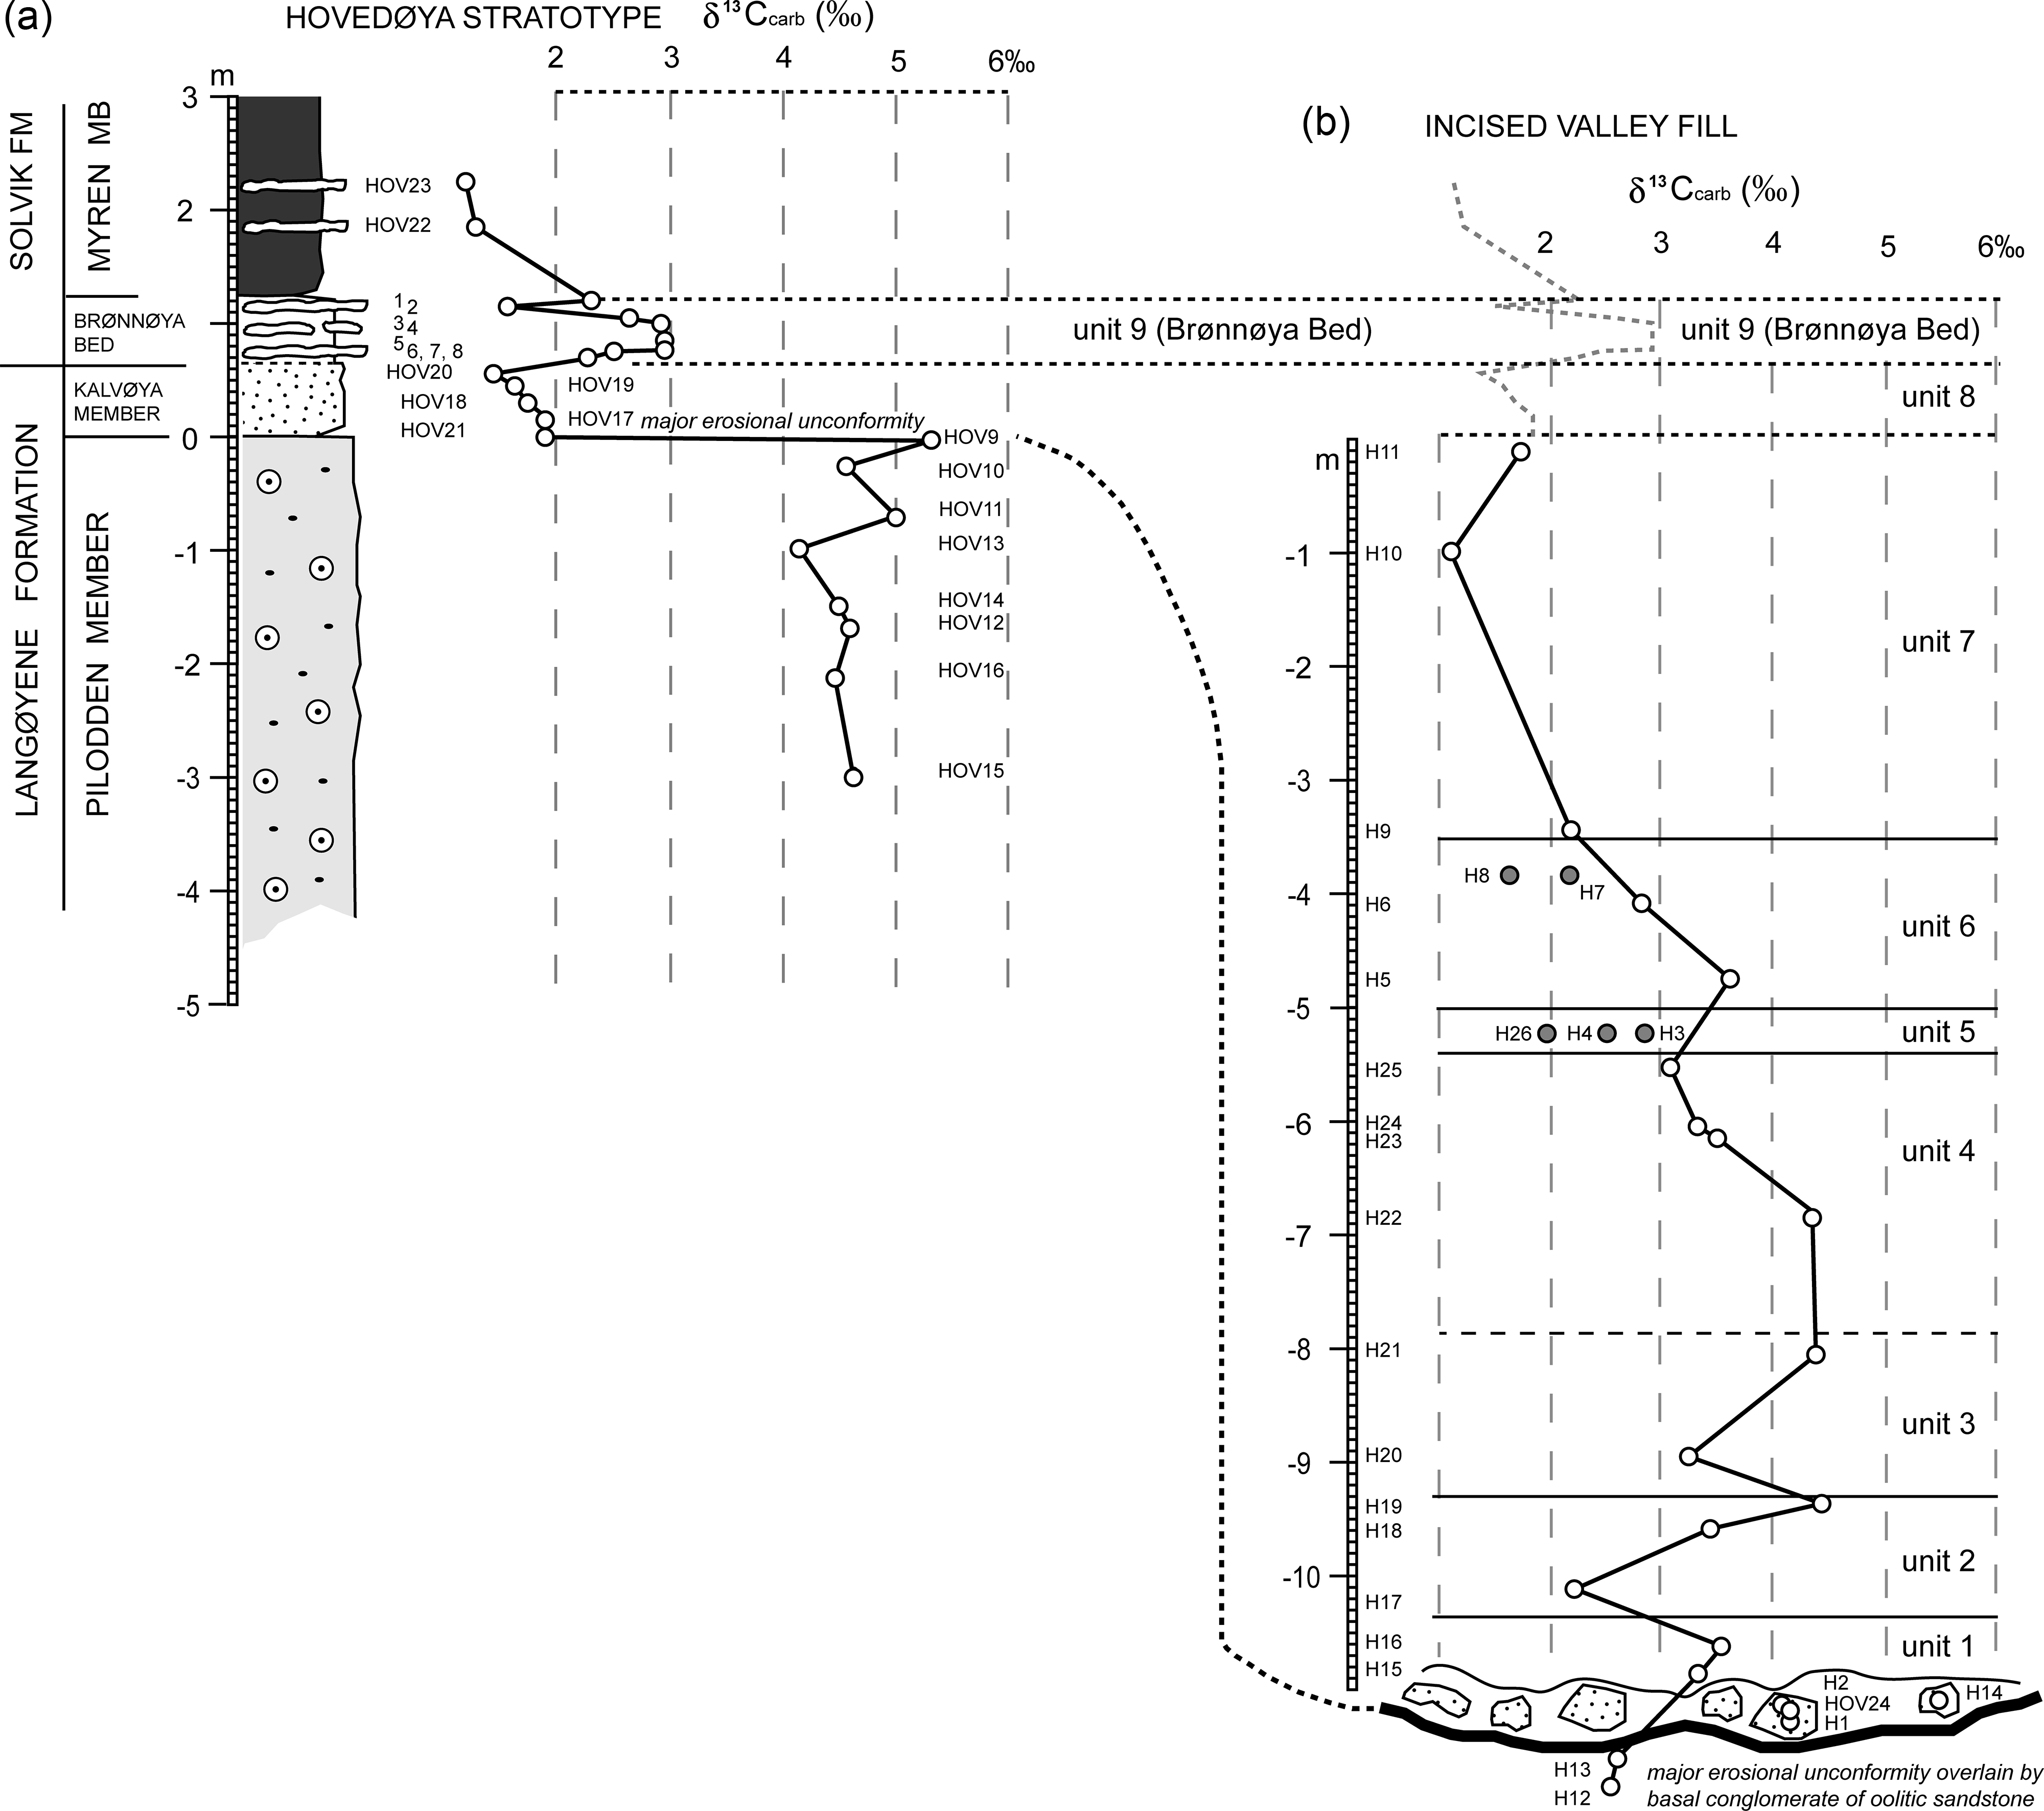
Fig. 15. Log profile and carbon isotope stratigraphy of the Hovedøya sections. (a) The stratotype section on southern Hovedøya (loc. Hovedøya 1 of Bockelie et al. Reference Bockelie, Baarli and Johnson2017). (b) Carbon isotope stratigraphy of the incised valley fill west of the stratotype section (loc. Hovedøya 2 of Bockelie et al. Reference Bockelie, Baarli and Johnson2017). The sedimentology and palaeontology of units 1–9 are described in detail by Bockelie et al. (Reference Bockelie, Baarli and Johnson2017).

Fig. 16. Profile from the southern shore of Hovedøya showing the geometry and sedimentary fill of a major incised valley, cutting into the lower portions of the Langøyene Formation. The fill represents the Kalvøya Member and is overlain by the more widespread Brønnøya Bed of the Solvik Formation. The valley fill represents an important sedimentary archive and time missing along the unconformity at the classical Ordovician–Silurian boundary stratotype section further to the east, where only the wing of the valley fill is preserved. Bockelie et al. (Reference Bockelie, Baarli and Johnson2017) subdivided the fill into nine units, of which only units 8 and 9 are represented at the classical type section. Sample points for carbon isotope stratigraphy in the present study are shown (H1–H26 + HOV24; see also Fig. 15 and Appendix 1). Profile is modified from Bockelie et al. (Reference Bockelie, Baarli and Johnson2017).
4.d. Stratigraphy and sedimentary facies at Vettre road-cut
Vettre road-cut represents the top of an anticline, and the strata are near horizontal and well exposed on the east side of Road 165 (Fig. 17a–b; Bockelie et al. Reference Bockelie, Baarli and Johnson2017, fig. 16). The lower portions of the section constitute clean oolite grainstone. The absence of quartz in this limestone stands in contrast to the oolitic sandstones or sandy oolites that are more common in the Hirnantian of the Oslo area; this is certainly due to the westerly position of Vettre, closer to the carbonate-dominated environments. The base of the oolite grainstone is not exposed, so its thickness at this locality is unknown. The oolite grainstone is conformably overlain by a bioclastic grainstone, which in turn is sharply overlain by a thin unit of hummocky cross-stratified, fine-grained sandstone interbedded with shale (Fig. 17a–b) indicating a deepening of the depositional environment. The upper part of the section constitutes brown, trough cross-laminated siltstone and sandstone and was interpreted as corresponding to the Brønnøya Bed on Hovedøya by Bockelie et al. (Reference Bockelie, Baarli and Johnson2017), i.e. as the later stages of the transgression that filled the incised valley there. The Solvik Formation is exposed on the opposite (west) side of the road, and field relationships suggest that it previously also followed on top of the brown, cross-bedded siltstone unit.

Fig. 17. Photoplate showing stratigraphy and lithology of Hirnantian strata at Vettre road-cut and at Olledalen skytebane, Asker district. (a) The section at Vettre with a transition from clean oolite and bioclastic grainstone to clastic deposition. The higher portion was interpreted as corresponding to the Brønnøya Bed by Bockelie et al. (Reference Bockelie, Baarli and Johnson2017), which is not supported by carbon isotope data of the present study. δ13C values above 5 ‰ rather suggest this is slightly older deposits of the Kalvøya Member, although it cannot be excluded that higher parts in the section corresponds to the Brønnøya Bed. (b) Detail showing Kalvøya Member (as interpreted herein) at Vettre, showing large-scale trough cross-bedding. (c) The lower portions of the section at Olledalen skytebane, showing the position of Holorhynchus giganteus (H) and the three isotope samples that support a Katian age for this brachiopod. (d) The higher portions of the section at Olledalen skytebane, showing the transition from argillaceous limestone to clean limestone (bioclastic grainstone). The steady rise of δ13C values through this interval from c. 0.5 ‰ to c. 2.7 ‰ supports an earliest Hirnantian age for the clean bioclastic limestone.
4.d.1. Carbon isotope stratigraphy at Vettre road-cut
Twenty-seven carbon isotope samples from Vettre road-cut are presented here (Fig. 18a; Appendix 1). The oolite grainstone and most of the overlying bioclastic limestone have high δ13C values, mostly scattering between 5 and 5.8 ‰. A sudden decline by more than a 1 ‰ occurs in the upper c. 0.5 m of the bioclastic limestone. More samples are necessary to evaluate the possible significance of this negative jump. δ13C values continue to decrease in the overlying calcareous sandstone and shale unit, and then return to values exceeding 5 ‰ again in the overlying Brønnøya Bed. A direct correlation with the Brønnøya Bed at Hovedøya, which has δ13C values near 3 ‰, is thus not confirmed by carbon isotope geochemistry.
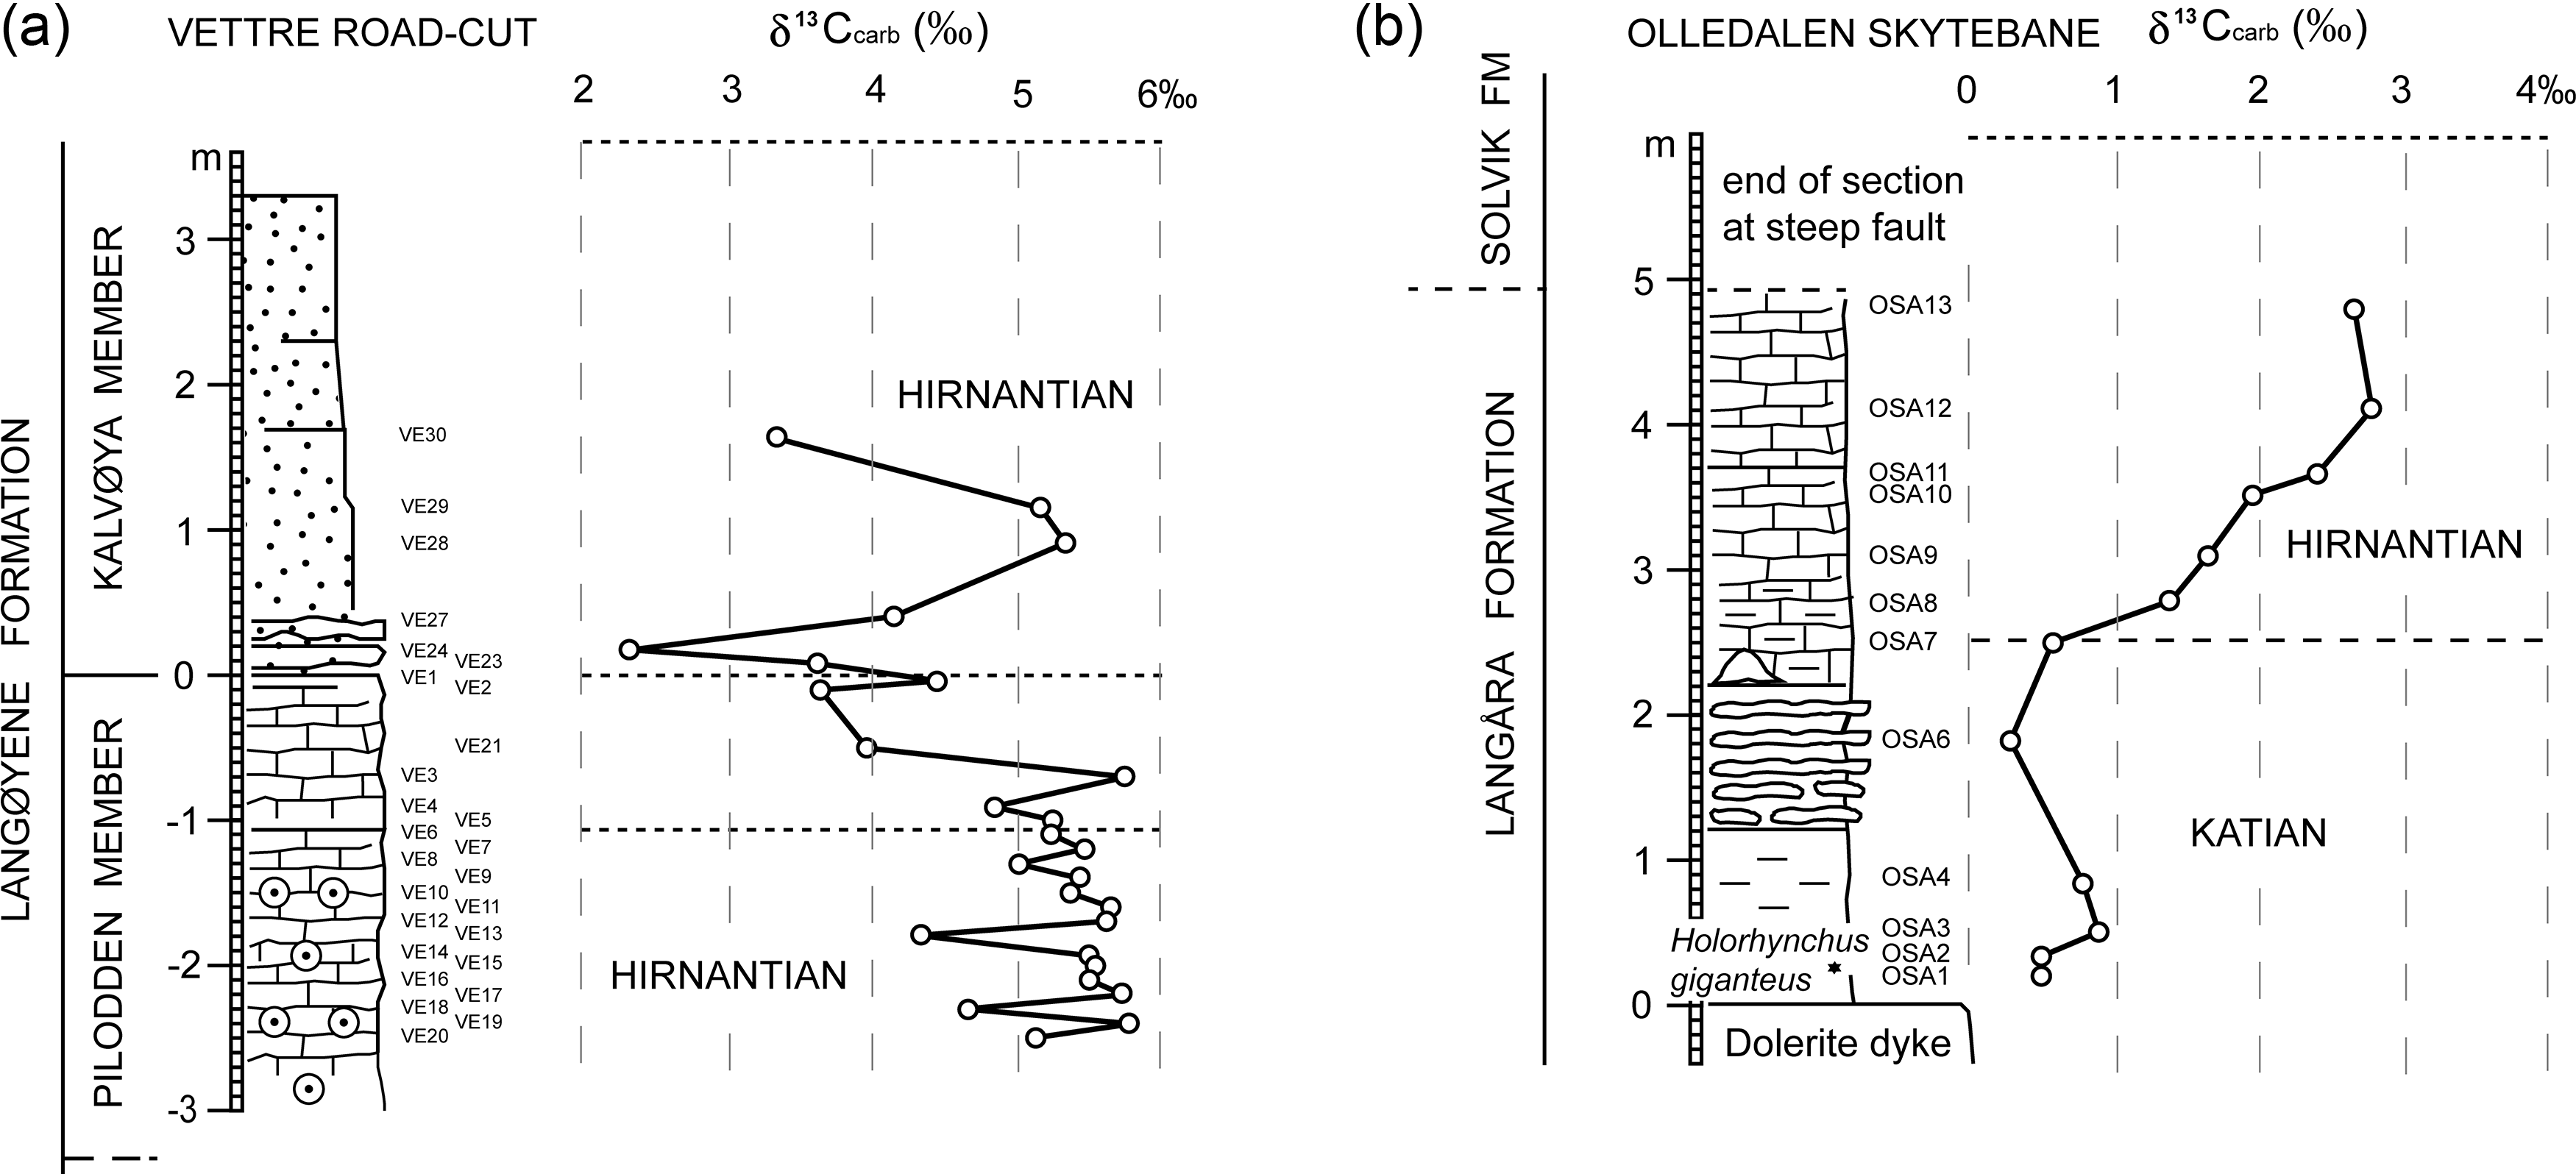
Fig. 18. Log profiles and carbon isotope stratigraphy of (a) Vettre road-cut and (b) Olledalen skytebane sections. The drop in δ13C values from above 5 ‰ to below 4 ‰ in the uppermost decimetres of the Pilodden Member at Vettre road-cut is intriguing but does not represent the falling limb of HICE since δ13C values rise above 5 ‰ again in the overlying unit. This latter unit is herein interpreted as part of the Kalvøya Member (incised valley fill), and its lower contact thus represents the sequence boundary. Diagenesis along this boundary may explain the lower δ13C values.
4.e. Stratigraphy and sedimentary facies at Olledalen skytebane
This is a c. 5 m thick and partly overgrown section measured at the Olledalen shooting range west of the village of Sem (Fig. 1). The strata are in near-vertical position and younger towards the northwest. The base of the section is at a weathered dolorite dike. Of particular stratigraphic importance in this section is the occurrence of the pentamerid brachiopod Holorhynchus giganteus. Based on δ13C analysis and chitinozoan assemblages from other localities in the Asker district, it was concluded to be of latest Katian age by Brenchley et al. (Reference Brenchley, Marshall, Hints and Nõlvak1997). This brachiopod occurs a few decimetres above the dike at Olledalen (Fig. 17c), implying a Katian age for the lower portions of the exposed section (see also Bockelie et al. Reference Bockelie, Baarli and Johnson2017). These parts constitute fine-grained clastic rocks with calcareous concretions overlain by a thin limestone–marl alternation. This in turn is overlain by marly limestone and above this is a clean bioclastic limestone unit that is c. 2 m thick (Fig. 17d). The limestone ends the section upwards due to faulting and cut-out of strata, but laterally it is clear that it is overlain by the Solvik Formation although the contact between the two units is not visible where our samples were taken.
4.e.1. Carbon isotope stratigraphy at Olledalen skytebane
Thirteen carbon isotope samples were taken from the section at Olledalen (Fig. 18b; Appendix 1). The level with H. giganteus is bracketed by two δ13C samples (OSA1 and OSA2), both having values of 0.44 ‰, i.e. pre-Hirnantian values (Fig. 17c). This compares well with the stratigraphic level of the Holorhynchus beds in the upper Ordovician section in Osmundsberget Quarry of the Siljan area (central Sweden), which falls in the interval just before the start of the rising limb of the HICE (Ebbestad et al. Reference Ebbestad, Högström, Frisk, Martma, Kaljo, Kröger and Pärnaste2015, fig. 9). Over the next 3 m, δ13C values increase steadily to a top value of 2.8 ‰ before the section ends at the fault plane. Thus the base of the Hirnantian is very close to the last occurrence of H. giganteus and most of HICE is cut out at this locality, only the lower parts of the rising limb being preserved. The steady increase in δ13C values corresponds to a change in facies from argillaceous limestone to a clean bioclastic limestone.
5. Sedimentary facies, environments and sea-level cycles
Bockelie et al. (Reference Bockelie, Baarli and Johnson2017) briefly discussed and presented a sea-level curve for the studied interval. Their sea-level curve included three regressive cycles, of which the last lowstand had the most profound effect on the shallow marine environments. We herein add new stratigraphic information, detail the sedimentology of the strata, and expand on their interpretation to provide a highly resolved Baltic perspective on the latest Ordovician sea-level oscillations.
The major sedimentary lithofacies of the studied interval includes shale, limestone–marl alternations, shale – calcareous-siltstone alternations, massive siltstones, laminated or cross-laminated sandstones, as well as pure bioclastic and cross-bedded limestones or mixtures of limestone and coarse sand. A majority of the siltstone and sandstone beds are typical storm deposits (tempestites; see Brenchley et al. Reference Brenchley, Newall and Stanistreet1979 and Brenchley & Newall, Reference Brenchley and Newall1980, for early detailed studies of similar facies in the Oslo area; see also Johnson & Baarli, Reference Johnson and Baarli2018). The temporal series of primary sedimentary structures within individual storm beds along with the frequency and thickness of such beds have frequently been used as bathymetric indicators and for interpreting proximality trends in shelf successions (Brenchley et al. Reference Brenchley, Newall and Stanistreet1979; Dott & Bourgeois, Reference Dott and Bourgeois1982; Brenchley, Reference Brenchley1989). In a facies model produced by Brenchley (Reference Brenchley1989), individual storm beds were subdivided into divisions B, P, H, F, X and M. These divisions reflect the successive changes in current regime and influence from waves during the build-up, peak and waning of an idealized storm event and the associated rip current that transport sediment from the foreshore and shoreface areas into the lower shoreface, where the resulting deposits rest largely protected from the post-storm, normal weather wave and current activity. The B (= basal scoured surface with tool marks) and P (= massive, normally graded or planar laminated) divisions reflect the erosion and rapid deposition from traction deposits, respectively, during the rip current. The H division (= hummocky and swale zone) is the result of combined decelerated current and strong wave action. The waning storm and post-storm depositional process give rise to the F (= flat laminae, suspension material) and X (= cross-lamination) divisions, whereas the M (= mudstone) division represents the finest grain sizes introduced by the current and/or the fair-weather background sedimentation between storm events.
The overall lithofacies succession at Konglungø together with the above facies model for storm deposits allow for interpretation of depositional depth along an idealized shelf profile including the foreshore, shoreface, lower shoreface and offshore areas. Based on our observations we identify four regressions of the sea-level, herein named R-I to R-IV, including two superimposed higher-order regressions (R-IIIA and R-IIIB; Fig. 19).

Fig. 19. Summary diagram of the Konglungø section showing formations, subunits A–F, main sedimentary facies, carbon isotope stratigraphy (including the development of HICE) and inferred relative sea-level change (regressions R-I through R-IV). The numbers ① and ② in the left margin denote the base of the Hirnantian Stage using carbon isotope stratigraphy and brachiopod data (① this study) or the appearance of the chitinozoan B. gamachiana in the succession (② Amberg et al. Reference Amberg, Vandenbroucke, Nielsen, Munnecke and McLaughlin2017), respectively. Correlation of the sea-level trend with sections in Morocco and Anticosti (Ghienne et al. Reference Ghienne, Desrochers, Vandenbroucke, Achab, Asselin, Dabard, Farley, Loi, Paris and Wickson2014) and the East Baltic area (Kiipli & Kiipli, Reference Kiipli and Kiipli2020) is tentative and hampered by uncertainties with the position of the lower Hirnantian Stage boundary, by the lack of graptolite biostratigraphy in the section, and by different scales of sea-level cycle hierarchy between the studies. Note that R-III is subdivided into two higher-order regressions named R-IIIA and R-IIIB, with a minor intervening transgression. Here, at Konglungø, the falling limb of HICE is cut out at a major unconformity, the same unconformity that is associated with incised valley fills at Hovedøya and Brønnøya. Note interfingering of clastic vs calcareous facies in the Langøyene Formation, and thus also recurrent lithostratigraphy and brachiopod associations. BBSU = brown bioturbated sandstone unit (an important marker bed; see text). Sea-level curve: OFF = offshore, LS = lower shoreface, SF = shoreface, FS = foreshore.
5.1. Regression 1 (R-I)
The siltstone tempestites of the lower Spannslokket Member (4dβ) of the Skogerholmen Formation are interbedded with shale, very thin and usually only weakly laminated and/or bioturbated. They are few per given distance of stratigraphy, and lack any substantial scouring, massive fabric and the hummocks and swales typical for the B-P-H divisions. We therefore interpret these as deposited by weak currents carrying mostly suspension material below the depth of wave influences during the late stages of storms, meaning at several tens of metres of depth (outer areas of the lower shoreface or even the offshore area, that is, near or below the storm weather wave base, SWWB). Such relatively deep depositional environment is further supported by the small lateral facies variation of this unit and uniform distribution across the Oslo area. This siltstone tempestite facies grades conformably upwards into a nodular limestone–marl alternation indicating a transition to a shallower depositional environment, geographically closer to carbonate-producing environments. A similar facies transition, from siltstone tempestites interbedded with shale to a limestone–marl alternation, in the overlying Husbergøya Formation, is associated with a change from deeper to shallower marine brachiopod faunas (Brenchley & Cocks, Reference Brenchley and Cocks1982). The above imply that limestone–marl alternations developed landward of the facies belt with shale and thin siltstone storm beds. The lack of wave-induced sedimentary structures in the limestone–marl alternation suggests deposition in the mid-shelf lower shoreface environment below the fair-weather wave base (FWWB). Thus, a change from shale and siltstone facies to limestone–marl alternations implies a small to moderate shallowing of the depositional environment. The opposite stratigraphy implies a similar deepening of the depositional environment. With this rationale the transition from the Hovedøya (4dα) to lower Spannslokket (4dβ) members in the Skogerholmen Formation is interpreted as reflecting a relative deepening of the depositional environment (from lower shoreface to offshore) and associated facies belt translocation. The 4dα–4dβ boundary is therefore marked as a flooding surface in Figure 19. The upwards transition from the shale and siltstone facies of 4dβ to the limestone–marl alternation in 4dγ thus is interpreted as a first, fairly moderate regressive cycle in the studied interval (R-I in Fig. 19).
5.2. Regression 2 (R-II)
The facies shift from the nodular limestone–marl alternation in the uppermost Skogerholmen Formation to shale in the Lower Husbergøya Formation is especially pronounced, not only at Konglungø but throughout the area. At this level the exceptionally rhythmic limestone–marl alternation of the Skogerholmen Formation is abruptly replaced by dark shales of the lower Husbergøya Formation, marking a clear transgressive pulse and establishment of a deep depositional environment following R-I. Within the middle and upper Husbergøya Formation follows a clear progradational trend that represents R-II. This overall shallowing is concurrent with a faunal change that similarly indicates shallowing of the depositional environment (Brenchley & Cocks, Reference Brenchley and Cocks1982).
The facies of this cycle starts with the basal shaly facies of the lower Husbergøya Formation (Fig. 4c). It continues upward with a successive increase in silt- or fine-grained sandstone storm-bed frequency and thickness, before the facies transitions again into a limestone–marl alternation in the higher parts of the formation. The full transition is unfortunately obscured at Konglungø due to beach cover, but a nearby temporary excavation (along the strike) due to construction in 2016 suggests there are no major deviations in the facies in this covered interval. The upper limestone–marl alternation shows an upward increased frequency and thickness of limestone beds, suggesting further shallowing. Establishment of a conspicuously shallow depositional environment is supported by the simultaneous appearance of shelly fauna and corals around −21 m in the section at Konglungø (Fig. 8). There is still no evidence, however, of sedimentary structures denoting deposition above the FWWB. The significance in terms of relative sea-level of the overlying brown bioturbated sandstone unit (BBSU/D2 in Fig. 19) is not clear. This is an important marker bed in the area, but the lack of primary sedimentary structures, due to homogenization through bioturbation, and overall little facies variation, makes a depositional depth estimate difficult. Overall it suggests lower depositional rates and a stable depositional environment, probably near the FWWB. A more precise estimation of depositional depth is not possible. The overlying sharp-based limestone (unit D1) is a packstone to grainstone with abundant shelly fauna of shallow-marine origin (Fig. 5) and signals continued shallowing to a depositional environment above the FWWB. Based on the concurrent distinct shallowing and quickly rising δ13C values through the upper Husbergøya Formation, along with the last appearance datum (LAD) of Tretaspis sp. and the first appearance datum (FAD) of Hirnantia Fauna in the brown bioturbated sandstone unit (Brenchley & Cocks, Reference Brenchley and Cocks1982), we infer that the change in bathymetry through this second regression (R-II in Fig. 19) reflects the first pronounced Hirnantian glacial and expansion of ice sheets across Gondwana. The maximum lowstand of this regression is inferred to be at the top of the Husbergøya Formation, whereas the overlying limestone of the Langåra Formtion (D1) marks a transgressive pulse. The latter unit also has the highest δ13C values measured in this study (Fig. 9).
The shallowing within R-II takes place over a limited thickness of stratigraphy (˜20 m) and reflects a change from very deep offshore deposition in the lowermost portions of the Husbergøya Formation to inshore deposition at the top. The top also marks a temporary halt in clastic deposition and a shift to clean carbonate deposition (D1). Based on the overall strong facies asymmetry within R-II along with the appearance of shelly fauna and corals, we interpret it provisionally as a forced regression in which we place the overlying sequence boundary at the top of the BBSU. It should be noted that there is no firm sedimentary evidence for a forced regression, such as facies offset to Walters Law or a submarine erosional surface such as a basal surface of forced regression or regressive surface of marine erosion (cf. Catuneanu, Reference Catuneanu2006). The base of the sandy BBSU potentially marks one of these surfaces, but intense bioturbation and homogenization of the unit may have obliterated evidence for such a surface. Similarly, there is no firm evidence of subaerial exposure in association with this boundary, although the marked shift to clean carbonate deposition above suggests a major change in deposition across this surface.
5.3. Regression 3 (R-III, including R-IIIA and R-IIIB)
Above the limestone with shelly fauna and corals (D1), the depositional environment changes drastically throughout the Oslo–Asker district, and coarser clastic deposition prevails for the first and only time in the Ordovician. The deposits form a major part of the rather heterogeneous Langøyene Formation and mirror the unusually shallow depositional environments that were established due to expanding ice sheets in Gondwana. Bockelie et al. (Reference Bockelie, Baarli and Johnson2017) suggest a minor transgression at the base of the Langøyene Formation based on the presence of a basal thin unit of micritic facies in the Skaueren Member at the type locality Skogerholmen. A minor transgression is needed to accommodate the thick sandstone units in the already shallow water reflected by the underlying limestone (D1). This was inferably a short-lived event of minor scale (partial deglaciation) and we include the underlying limestone (D1) in this transgression. A more significant transgression would drown source areas, flatten the depositional equilibrium profile and turn any nearby deltas into estuaries, locking up sediments at shorelines, and result in starved sedimentation throughout the Oslo area. The coarser clastic facies in the Langøyene Formation is, on the contrary, only likely if relative sea-level is further lowered, resulting in increased gradients and prograding deltas, or if there is a stillstand of sea-level that permits progradation of coastal deltas into the basin.
The tempestites in the Langøyene Formation differ substantially from those of the older units. Langøyene tempestites are thick, coarsely sandy and show well-developed scouring, larger-scale low-angle cross-bedding and also slump structures (Fig. 6). The slump structures indicate that the gradient in the depositional environment was fairly steep and the sands were likely redeposited from delta front environments that supplied the sand from the east. In general, the individual sandstone beds are either massive or normally graded and show well-developed planar lamination and/or hummocks and swales (i.e. the B-P-H zones; Fig. 6). There is a difference in bedding, however, between the lower (Skaueren Member) and upper (Høyerholmen Member) part of the Langøyene Formation. The lower member shows some interbedding of shale or siltstone whereas the upper member shows only amalgamated beds of sandstone. The preservation of fair-weather suspension material (background sedimentation; M division of Brenchley, Reference Brenchley1989) in the lower member suggests a depositional environment with high supply of sand but still below the FWWB; that is, in the inner part of the lower shoreface. The lack of such shale interbeds in the upper member could theoretically be due to more intense storms and thus erosion of the preceding fair-weather muds, but fairly rapid progradation and further shallowing is the favoured interpretation here as this member is unconformably overlain by trough cross-bedded oolitic sandstones of the Pilodden Member that was clearly deposited under the influence of strong currents above the FWWB.
We interpret the clastic facies succession of the Langøyene Formation as one regressive cycle (R-III), but there are reasons to discern two superimposed higher-order cycles (R-IIIA and R-IIIB) formed in successively shallower water. The reason is twofold. First, based on an erosional surface at the base of the Høyerholmen Member at the type locality Skogerholmen, Bockelie et al. (Reference Bockelie, Baarli and Johnson2017) interpreted a short-lived regressive event within the Langøyene Formation. Secondly, even if there is no evidence of a coeval erosional boundary at Konglungø, there is a break in clastic deposition also at Konglungø in the form of a thin limestone wedge of the Langåra Formation separating the Skaueren and Høyerholmen members. This suggests a short-lived transgressive pulse when clastic deposition was briefly halted. The combined information leads us to include two higher-order sea-level cycles in the clastic facies of the Langøyene Formation (R-IIIA and R-IIIB), each one overlying a transgressive limestone wedge of the Langåra Formation (Fig. 19).
5.4. The maximum lowstand of R-III and transgressive oolites
The transition from the thick-bedded Høyerholmen sandstone to the calcareous and oolitic facies of the Pilodden Member (Fig. 7a–b) is particularly intriguing in terms of sea-level and can be interpreted in two ways. This is either a submarine regressive surface of marine erosion (RSME) or it is a subaerially exposed, erosional sequence boundary (SB). The slight facies offset associated with the boundary and the fairly continuous δ13C values (offset by c. 1 ‰) across the boundary may indicate fairly continuous sedimentation and thus the onset of a forced regression and a shift to carbonate-dominated deposition. There are, however, several aspects of the regional geology and stratigraphy, as well as principles of sedimentation dynamics, that reduce the probability of such change. First, a lowered base level would increase gradients and produce even more sand to the depositional environment. It would not increase carbonate production in an already siliciclastic-dominated setting. Secondly, the highly calcareous oolitic facies has a thin blanket-geometry in the central Oslo area. Such high-energy carbonate units typically develop during the transgressive systems tract when siliciclastic source areas are drowned, depositional equilibrium profiles are of low-gradient type and low-relief shallow-water depositional systems are established. Third, oolites are much more likely to form during transgression when water-masses transgress low-relief areas so that shallow-marine environments expand, and water-masses are heated and release CO2, e.g. in the aftermath of glacials. This principle is common to many low-latitude oolite deposits (Calner, Reference Calner2005) as well as for pre-Cambrian cap carbonates.
For the above reasons, the erosional boundary between the Høyerholmen and Pilodden members is interpreted as a subaerial unconformity marking the end of regression number 3 (R-III in Fig. 19) and principally a bypass surface and sequence boundary. Any lowstand deposits are not preserved in the outcrop area but would be preserved further down-dip. As opposed to R-I and R-II, which were not associated with subaerial exposure in the immediate study area, the lowstand of R-III exposed previous shelf deposits and, at least locally, removed shoreface deposits.
The calcareous oolitic facies of the Pilodden Member shows fairly large-scale trough cross-bedding and represents a shallow-water high-energy depositional environment, locally with dune formation. It includes abundant reworked quartz (millet-seed quartz), well-abraded fossil fragments and corals as well as clasts of the underlying sandstones. The millet-seed sand is interpreted as being the result of reworking of nearby terranes during a more pronounced late Hirnantian lowstand. With the above reasoning we infer that the Pilodden Member was deposited during a rapid transgression (deglaciation) in the later part of the Hirnantian. A transgressive origin for this unit is also supported by observations from the island Høyerholmen (K Tonstad, unpub PhD thesis, Univ. Bergen, 1983, p. 206).
5.5. Regression 4 (R-IV)
The regional erosional surface marking the upper boundary of the Pilodden Member is the most conspicuous unconformity in the studied sections. It is marked by an offset in the δ13C values exceeding 2 ‰ at Konglungø (Fig. 9) and 3 ‰ at Hovedøya (Fig. 15). Based on δ13C data and lithological similarity, it is clear that the major conglomerate clasts in the lower parts of the incised valleys at both Hovedøya and Brønnøya (Bockelie et al. Reference Bockelie, Baarli and Johnson2017) derive from the Pilodden Member. Hence, the sandy oolitic facies of this member must have been buried and lithified before a fourth regression exposed it and it was subject to subaerial weathering and erosion. We herein refer to this shallowing as regression number 4 (R-IV in Fig. 19) and it cut deeper than any of the preceding regressions, locally to the depth of the Skogerholmen Formation (Bockelie et al. Reference Bockelie, Baarli and Johnson2017). Quartz sand, including millet-seed quartz, that could not be further weathered or dissolved during this lowstand, locally forms a transgressive lag concentration deposit on top of the Pilodden Member, e.g. the dark grey sandstone at Konglungø which then effectively would belong to the Kalvøya Member (Fig. 9).
Carbonate rocks lithify comparably early due to the carbonate saturation state of sea-water, and may in warm and dry climates lithify within a few thousand years (e.g. the Holocene oolites of the Bahamas). In order to lithify, the Pilodden Member must have been overlain by at least some succession of strata that is no longer preserved in the Oslo–Asker district. R-IV removed these deposits and led to the development of pronounced topography and several confined, incised valleys in the area (Bockelie et al. Reference Bockelie, Baarli and Johnson2017). The local fills of these valleys were collectively grouped as the Kalvøya Member. Our δ13C data show that such valleys in Hovedøya and Brønnøya filled during transgression already in the Hirnantian (Figs 12, 15) and that also the overlying Brønnøya Bed most likely was deposited in the Hirnantian as well. The Brønnøya Bed has a wider distribution in the Oslo–Asker district than the immediately underlying and more scattered incised valley fills (Kalvøya Member) and thus marks the time when much of the underlying topography was submerged. The overlying black shales of the Solvik Formation mark the continued quick deepening due to collapse of the Gondwanan ice sheet. It should be noted that the variation in brachiopod benthic assemblages in the basal Solvik Formation, in different localities across the Oslo–Asker district, shows that some of the underlying topography must still have existed as islands during the corresponding time (cf. Johnson & Baarli, Reference Johnson and Baarli2018).
6. Discussion
The Katian–Hirnantian stratigraphy of the upper Oslo Fjord area has until now been based primarily on biostratigraphy. The carbon isotope stratigraphy presented here and the identification of the HICE therefore further resolves previous stratigraphic data and better relates the various stratigraphic units, the shifts in sedimentation patterns, and thus relative sea-level, to the uppermost Katian and Hirnantian stages. This potentially enables correlation with several tens of Hirnantian localities globally. It is beyond the scope of this paper, though, to attempt such correlations here.
6.1. Summary of δ13C stratigraphy and the base of the Hirnantian Stage
There is no proper definition of the beginning and end of the HICE. A slow rise in δ13C values from the baseline is evident within the M. extraordinarius Zone, e.g. at the Wangjiawan North Section in Hubei province, China (Chen et al. Reference Chen, Rong, Fan, Zhan, Mitchell, Harper, Melchin, Peng, Finney and Wan2006). The most rapid rate of increase in δ13C, however, appears to coincide with the base of the upper Hirnantian M. persculptus Zone (Bergström et al. Reference Bergström, Eriksson, Young, Ahlberg and Schmitz2013; Ghienne et al. Reference Ghienne, Desrochers, Vandenbroucke, Achab, Asselin, Dabard, Farley, Loi, Paris and Wickson2014; Kröger et al. Reference Kröger, Ebbestad, Lehnert, Ullmann, Corte, Frei and Rasmussen2015; Mauviel & Desrochers Reference Mauviel and Desrochers2016; Wang et al. Reference Wang, Zhan and Percival2019). This temporal pattern of change may help to indicate preliminary positions for the base of the M. extraordinarius and M. persculptus zones, respectively.
Among the studied sections, the Konglungø locality represents the most complete record of the HICE (Figs 8–9, 19). Here, the onset and rising limb of HICE is associated with the upper Husbergøya Formation and with the last and first appearances of Tretaspis and Hirnantia Fauna, respectively. Below this interval, pre-excursion δ13C baseline values are between 0 and 1 ‰, corresponding to the Spannslokket Member of the Skogerholmen Formation. Slightly higher values just below this interval, within the Hovedøya Member of the same formation, may represent the falling limb of the ‘lower HICE’, a minor excursion that clearly predates the major Hirnantian δ13C anomaly, and which has been documented from Anticosti (Mauviel & Desrochers, Reference Mauviel and Desrochers2016) and possibly also from Mirny Creek (Kaljo et al. Reference Kaljo, Männik, Martma and Nõlvak2012). In Anticosti this ‘early HICE’ is associated with the chitinozoan Belonechitina gamachiana. Hence, the recent findings of B. gamachiana also in the Skogerholmen Formation at Hovedøya (Amberg et al. Reference Amberg, Vandenbroucke, Nielsen, Munnecke and McLaughlin2017) appear to support the presence of the ‘lower HICE’ in Baltica as well, although additional sampling is needed to fully support this. The findings of B. gamachiana are also intriguing since the eponymous biozone has been argued to be fully within the Hirnantian in Anticosti (Delabroye & Vecoli, Reference Delabroye and Vecoli2010; Amberg et al. Reference Amberg, Vandenbroucke, Nielsen, Munnecke and McLaughlin2017). As there is no proper solution to this stratigraphic problem at the moment, we will rely on our brachiopod data and the onset of the HICE to provisionally set the Katian–Hirnantian stage boundary at c. 15 m below the top of the Husbergøya Formation (sample KON47; Fig. 8). In our compilation of data and interpretations from Konglungø (Fig. 19) we have indicated a second possible position for the base of the Hirnantian Stage based on alignment with Anticosti as guidance.
The stratigraphic interval containing the rising limb of the HICE is partly covered by modern beach deposits, hampering study of the entire morphology of the rise. Parts of the covered interval are exposed, however, at the nearby Pilbogen Bay locality at Brønnøya. Based on the combined set of observations from these two localities, the rising limb of the HICE shows an increase from δ13C values near the baseline in the middle part of the Husbergøya Formation to near 6 ‰ in the first wedge of the Langåra Formation (unit D1 in Fig. 9) some 18 m higher up. The rise occurs in beds assignable to the Onniella Association and continues into beds with typical Hirnantia Fauna (Fig. 19). This suggests that the rising limb of the HICE is most likely confined to the middle–upper Hirnantian Metabolograptus persculptus Graptolite Biozone and, as a result, that the M. extraordinarius Graptolite Biozone is very thin or missing in the studied sections. The preserved plateau of the HICE, which falls fully within the overlying Langøyene Formation, thus appears to be entirely within the uppermost Hirnantian. This is further supported by the falling limb of the isotope excursion being located above the occurrence of the Brevilamnulella Association. It is also in alignment with data from the Boda Limestone in central Sweden that show B. kjerulfi to occur in beds assignable to the uppermost M. persculptus Zone (Rasmussen et al. Reference Rasmussen, Ebbestad and Harper2010; Kröger et al. Reference Kröger, Ebbestad, Lehnert, Ullmann, Corte, Frei and Rasmussen2015). This part of the curve is characterized by slightly lower δ13C values, and especially by a less stable signal with values varying by 3–5 ‰ in the calcareous sandstone facies. δ13C is increasing again with less varying values in the more calcareous and oolitic Pilodden Member in the uppermost part of the Langøyene Formation (where the Brevilamnulella Association occurs). The slight and consistent shift to lower δ13C values, and the less stable signal, is thus likely due to the dominantly siliciclastic facies and rhythmic sedimentation style of the Skaueren and Høyerholmen members of the Langøyene Formation. An almost identical pattern is seen in the profound late Silurian Lau Event; in the associated δ13C excursion on Gotland, Sweden, a set-back in the plateau values is associated with the Burgsvik Sandstone (Younes et al. Reference Younes, Calner and Lehnert2017). The falling limb of the HICE is largely cut out at Konglungø. This is related to the major unconformity at the top of the Langøyene Formation. In this study we were able to sample and document a major part of the falling limb in the incised valley fill associated with this unconformity at Hovedøya.
6.2. Provisional correlation of sea-level cycles
The studied interval is characterized by a series of four regressions (R-I to R-IV) with progressively increased erosion of previous shelf deposits. A similar general pattern was presented by Kiipli & Kiipli (Reference Kiipli and Kiipli2020) in their review of Hirnantian sea-level changes in Baltoscandia. Based on sections in the East Baltic area, they proposed four major transgressive–regressive cycles through this interval. A tentative correlation between the Oslo–Asker district and the East Baltic area is included in Figure 19. If we adopt the recently suggested duration of the Hirnantian Stage as only 0.47 ± 0.34 Ma (Wanhe section; Ling et al. Reference Ling, Zhan, Wang, Wang, Amelin, Tang, Liu, Jin, Huang, Wu, Xue, Fu, Bennett, Wei, Luan, Finnegan, Harper and Rong2019), our sea-level cycles R-I through R-IV appear to be in the same range as Quaternary glacial–interglacial cycles (fourth order of c. 100 kyr) whereas R-IIIA and R-IIIB would be superimposed higher-frequency cycles (fifth order).
In general terms, a similar development, also with progressively increased amplitude of sea-level falls, and a maximum glacio-eustatic regression in the late or latest Hirnantian, is documented from Morocco, representing a high-latitude Gondwana setting (Ghienne et al. Reference Ghienne, Desrochers, Vandenbroucke, Achab, Asselin, Dabard, Farley, Loi, Paris and Wickson2014; Colmenar et al. Reference Colmenar, Villas, Rasmussen, Hunter, Álvaro, Lefebvre, van Roy and Zamora2018). As in Baltica, the main post-glacial transgression takes place in the latest Hirnantian. Even if overall similarities are striking, a detailed correlation of the sea-level cycles between Baltoscandia and Morocco is difficult and at the current time hampered by lack of precise biostratigraphic control; in neither area is it possible to exactly pinpoint the Katian–Hirnantian stage boundary or the M. extraordinarius/M. persculptus boundary. Also, as discussed above, the range of the Hirnantian Stage depends on whether the chitinozoan B. gamachiana is effectively within the stage or not. With our preferred definition of the base of the Hirnantian in the Oslo–Asker district (No. 1 in Fig. 19) our cycles R-I through R-IV inferably represent higher-order cycles superimposed on Late Ordovician Glacial Cycles 2 and 3 (LOGC 2-3) of Ghienne et al. (Reference Ghienne, Desrochers, Vandenbroucke, Achab, Asselin, Dabard, Farley, Loi, Paris and Wickson2014; Fig. 19). R-I and R-II are tentatively correlated as parts of LOGC 2 and 3, respectively, which includes uppermost Katian strata and most of the lower and middle part of the Hirnantian. Both regressions R-III and R-IV take place entirely within the high-δ13C-value ‘plateau’ of HICE, clearly after the end of the rising limb, but before the falling limb of the excursion (which is documented in transgressive deposits within the incised valley formed during the maximum lowstand of R-IV). Both regressions therefore overlap with the stratigraphic range of LOGC3 of Ghienne et al. (Reference Ghienne, Desrochers, Vandenbroucke, Achab, Asselin, Dabard, Farley, Loi, Paris and Wickson2014).
7. Conclusions
A dataset of 208 whole-rock carbon isotope samples from six sections in the Oslo–Asker district forms the basis for the first comprehensive documentation of the HICE in Norway. We relate this dataset in detail to sedimentary facies and depositional depth and present a sea-level history for the time interval. This reveals a long-term regression superimposed by four shorter-lived (fourth-order) regressive–transgressive cycles with a stepwise increase in erosion of the shelf environment. A tentative correlation of these cycles with latest Katian–Hirnantian sea-level cycles documented from the East Baltic area (Kiipli & Kippli Reference Kiipli and Kiipli2020) and Morocco and Anticosti (Ghienne et al. Reference Ghienne, Desrochers, Vandenbroucke, Achab, Asselin, Dabard, Farley, Loi, Paris and Wickson2014) is proposed, but we note uncertainties primarily due to limitations in biostratigraphy. The main conclusions of the study can be summarized as follows:
-
1) The HICE is identified at Hovedøya, Brønnøya, Konglungø, Vettre and Olledalen in the Oslo–Asker district. The HICE is best preserved at Konglungø where the onset of the rising limb starts c. 15 m below the top of the Husbergøya Formation and where the anomaly reaches δ13Ccarb peak values between +5 ‰ and +6 ‰ in the Langåra and Langøyene formations. The falling limb is missing due to erosion at Konglungø but partly preserved in incised valley fills (Kalvøya Member) at Hovedøya, Brønnøya and Vettre.
-
2) The Katian–Hirnantian boundary as expressed by the onset of HICE and the first appearance of Hirnantia brachiopod fauna is herein tentatively placed c. 15 m below the top of the Husbergøya Formation at Konglungø. This decision is challenged by the recent and local finds of the chitinozoan Belonechitina gamachiana (Amberg et al. Reference Amberg, Vandenbroucke, Nielsen, Munnecke and McLaughlin2017). If this taxon is used as the basis for an intra-Hirnantian biozone, as in some North American sections, the Katian–Hirnantian boundary would need to be shifted significantly lower in the succession, to within the Skogerholmen Formation; the preserved Hirnantian succession is then more than 60 m thick, and the base of the Hirnantian situated more than 40 m below the FAD of Hirnantia Fauna. It would also suggest that the main part of the Skogerholmen and Husbergøya formations belongs in the M. extraordinarius graptolite Zone, since high δ13C values of the HICE globally appear to be restricted to the M. persculptus Zone.
-
3) Based on facies analysis and the presence of erosional unconformities, four sea-level falls are recorded, successively with increased erosion: A first minor regression (R-I) is associated with the upper Skogerholmen Formation. A second regression (R-II) is associated with the upper portions of the Husbergøya Formation and corresponds to the rising limb of the HICE. R-I and R-II are tentatively correlated as overlapping with LOGC 2 and 3, respectively, in Gondwana and Anticosti sensu Ghienne et al. (Reference Ghienne, Desrochers, Vandenbroucke, Achab, Asselin, Dabard, Farley, Loi, Paris and Wickson2014), whereas R-II inferably correlates with Regression I in the East Baltic area sensu Kiipli & Kiipli (Reference Kiipli and Kiipli2020). A third regression (R-III) is manifested by prograding sandstone units within the Langøyene Formation and eroded at least the foreshore area. Two superimposed fifth-order sea-level cycles are identified within R-III (R-IIIA and R-IIIB) and correlated with Regressions II and III in the East Baltic area, respectively. A fourth regression (R-IV) is evident from major incision through the upper parts of the Langøyene Formation, resulting in channels and valleys both in Hovedøya and Brønnøya. R-III and R-IV are tentatively correlated as overlapping with LOGC3 in Gondwana and Anticosti sensu Ghienne et al. (Reference Ghienne, Desrochers, Vandenbroucke, Achab, Asselin, Dabard, Farley, Loi, Paris and Wickson2014). The transgressive strata that fill the incised valley formed during R-IV record the falling limb of the HICE, dating the last major regression and lowstand to the latest part of the international Hi1 stage slice. The final post-glacial transgression thus occurs in the latest Hirnantian.
Acknowledgements
Johan Fredrik Bockelie passed away during the course of this work. M.C. and H.C. had the opportunity to work closely with Fredrik in the Oslo–Asker district in 2015 and 2016 and to learn from his lifelong experience and astonishing knowledge of the geology of this area. We are grateful for his warm hospitality, and this paper is dedicated to his memory. We acknowledge also Angie Bockelie for her hospitality and company during our field visits. We are greatly indebted to Knut Mansika and family for sharing their private garden at Konglungø on several occasions during our field works. Fylkesmannen in Viken county, Oslo, gave permission to study protected areas of Konglungø. Gudveig Baarli and Markes E. Johnson are acknowledged for providing the originals of Figures 1 and 16 and for fruitful discussions on the stratigraphy of the Oslo–Asker district. Enli and Tarmo Kiipli provided information for our tentative correlation of relative sea-level changes. This paper is to a great extent the product of a sabbatical stay at the Department of Geology, Lisbon University, in the autumn of 2018 and M.C. is grateful to Conceição Freitas for the excellent working possibilities and office provided during this stay. We acknowledge the insightful and useful reviews by Gudveig Baarli, Jean-François Ghienne, Leho Ainsaar and Jan-Ove Ebbestad. C.M.Ø.R. acknowledges support from Geocenter Denmark (projects 2015-5 and 3-2017). O.L. acknowledges the support of his research on the Ordovician stratigraphy of Baltica by the Deutsche Forschungsgemeinschaft (DFG project LE 867/8-1 and 8-2) and also thanks the Estonian Research Council for supporting his studies in the Baltoscandian Late Ordovician succession (grant PUT 378).
Declaration of Interest
No conflicts of interest.
Appendix 1. δ13C data from the six sections studied in the Oslo–Asker district of southern Norway


 Open access