


Significant outcomes
-
Dynamic and static impedance are strongly correlated in bifrontal ECT.
-
Dynamic impedance correlates with the quality of the induced seizure making dynamic impedance a relevant parameter that can be influenced prior to stimulation.
-
Impedances are significantly higher in women and increase with age.
Limitations
-
Due to its retrospective design, the study did not include a control group.
-
As no stimulus titration for determining the seizure threshold was performed, correlations of dynamic and static impedance with seizure threshold could not be investigated.
Introduction
Electroconvulsive therapy (ECT) is a safe and effective treatment for various psychiatric syndromes (UK ECT Review Group 2003; Zervas et al., Reference Zervas, Theleritis and Soldatos2012; Elias et al., Reference Elias, Thomas and Sackeim2021).
Optimising electrode montage, stimulus characteristics and dosage has increased efficacy and tolerability of ECT, albeit this process of optimisation is still ongoing. Evoking a generalised seizure due to the application of an electrical field most likely represents a central therapeutic mechanism in ECT (Deng et al., Reference Deng, Lisanby and Peterchev2011; Deng et al., Reference Deng, Argyelan, Miller, Quinn, Lloyd, Jones, Upston, Erhardt, McClintock and Abbott2022).
Four main electrode positions are in use, of which bifrontal is less investigated than bitemporal, right unilateral (RUL) and left anterior right temporal placements (Bailine et al., Reference Bailine, Rifkin, Kayne, Selzer, Vital-Herne, Blieka and Pollack2000; Kellner et al., Reference Kellner, Knapp, Husain, Rasmussen, Sampson, Cullum, McClintock, Tobias, Martino, Mueller, Bailine, Fink and Petrides2010a, Reference Kellner, Kristen and Wiegand2010b). Physical properties of the stimulus, patient’s head anatomy and electrical conductivity of different tissue compartments determine current delivery to the brain (Sackeim et al., Reference Sackeim, Long, Luber, Moeller, Prohovnik, Devanand and Noebler1994; Bai et al., Reference Bai, Gálvez, Dokos, Martin, Bikson and Loo2017). Within electrical circuits in general, impedance Z comprises resistance to direct currents as well as alternating currents, which are being used in ECT. Impedance in ECT is influenced by technically given fixed factors (cables, electrodes), the contact surface between stimulation electrodes and skin, and properties of other components of the patient such as epicranium, cranium and, to lesser extent, the brain McCann et al., Reference McCann, Pisano and Beltrachini2019). Electric current distributes inversely proportional to the resistivity of traversed tissue types (Fish & Geddes, Reference Fish and Geddes2009). Resistivity of scalp (comprising the skin-electrode connection) and brain is comparatively low, while the skull is a high-impedance compartment, leading to a major proportion of current being shunted through the scalp, not entering cerebral tissue (Law, Reference Law1993; Goncalves et al., Reference Goncalves, de Munck, Verbunt, Bijma, Heethaar and da Silva2003). Individual differences in skull anatomy and thickness influence the amount of current entering the brain and the electric field during stimulation and are a main determinant of varying seizure thresholds among patients (van Waarde et al., Reference van Waarde, van Oudheusden, Tonino, van der Wee, Verwey, van der Mast and Giltay2013; Deng et al., Reference Deng, Lisanby and Peterchev2015).
Prior to stimulation, the Thymatron® System IV measures a ’static impedance’ by applying an imperceptible, low-intensity, high-frequency (800 Hz) test current (∼1 mA). Exceedingly high values (>3000 Ω) indicate disconnection or faulty or poorly placed electrodes, whereas very low static impedance (<100 Ω) indicates a short circuit. Static impedance serves as control of electrical hardware and quality of the electrode-skin interface (Sackeim et al., Reference Sackeim, Long, Luber, Moeller, Prohovnik, Devanand and Noebler1994). During stimulation with the alternating current, dynamic impedance is measured. It is lower than static impedance as tissue conductivity increases in conjunction with current intensity (Vargas Luna et al., Reference Vargas Luna, Krenn, Cortés Ramírez and Mayr2015). The Thymatron® is a constant current device adapting the applied voltage based on ‘online’ measured dynamic impedance. A correlation between dynamic and static impedance has been reported for both bitemporal and RUL stimulation, but not in large-sample studies for bifrontal electrode placement, with its meaning and clinical relevance still disputed (Sackeim et al., Reference Sackeim, Long, Luber, Moeller, Prohovnik, Devanand and Noebler1994; Rasmussen et al., Reference Rasmussen, Varghese, Stevens and Ryan2007). Of clinical interest is the age-dependent negative correlation of seizure threshold and dynamic impedance (Coffey et al., Reference Coffey, Lucke, Weiner, Krystal and Aque1995; Bundy et al., Reference Bundy, Hewer, Andres, Gass and Sartorius2010). In addition to non-modifiable factors such as patient’s tissue composition, preparation of the stimulation sites can influence impedance. While Unal et al. investigated the influence of preparatory techniques on static impedance in healthy subjects in an experimental setting, real-life preparatory variations occur between and within ECT applicators (Unal et al., Reference Unal, Swami, Canela, Cohen, Khadka, FallahRad, Short, Argyelan, Sackeim and Bikson2021). However, the relevance of such variations is not clear. Should effort be invested to achieve low static impedance in clinical practice?
Technical outcome parameters may serve individually or as index constituents of ECT quality criteria. A demonstrated association with dynamic impedance would underline the potential clinical relevance of the latter.
Objectives
This study aims at investigating the association of dynamic impedance and technical ECT quality criteria in bifrontal stimulation in a real-world dataset, exploring potential clinical relevance and adding to the existing knowledge of physical fundamentals in ECT.
Material and methods
Study design and setting
We conducted a retrospective cross-sectional single-centre study at the Psychiatric University Hospital Zurich (PUK), Switzerland. ECT sessions performed at the ECT facility of the PUK between May 2012 and March 2020 were included. May 2012 as starting point was defined by the start date of the Thymatron® System IV at the PUK. We included both male and female patients aged >18 years in the analysis. A minimum of two completed ECT sessions was required for inclusion. No further eligibility criteria were applied. With no previous data available to estimate variability and magnitude of expected effects, a tentative number of approximately 80 patients with balanced sex ratio and similar age distribution between genders was aimed for. As we could not guarantee to include all ECT treatments performed at the facility in the respective time period for both accessibility reasons and due to the fact that no central ECT registry is in place at the PUK, we randomly selected 78 patients with a balanced sex ratio and aiming at a similar age distribution from the accessible patient base. All ECT treatments of the selected patients in the specified time period were initially included in the data set. A flow diagram of the selection process with the exclusion of treatments prior to primary and secondary analysis is included in the appendix (modified according to Page et al., Reference Page, McKenzie, Bossuyt, Boutron, Hoffmann, Mulrow, Shamseer, Tetzlaff, Akl, Brennan, Chou, Glanville, Grimshaw, Hróbjartsson, Lalu, Li, Loder, Mayo-Wilson, McDonald, McGuinness, Stewart, Thomas, Tricco, Welch, Whiting and McKenzie2021).
Medical indication for ECT, patient information, treatment preparation and anaesthesia followed standardised clinical protocols according to current standards of care. Treatment comprised both ECT series and maintenance therapy. ECT was in all cases conducted with bifrontal stimulation using the Thymatron® System IV device (Somatics, LLC. Lake Bluff, IL, USA) and disposable adherent EPAD Thymapad® stimulus electrodes. Electrodes were positioned concordant with the standard bifrontal placement. Prior to electrode application, skin surface was cleansed using an alcohol-containing solvent and abrasive gel (OneStep Abrasive Plus®) for further degreasing skin and improving conductive contact. Then, PRE TAC® conductive and adhesive liquid was applied to the skin. EEG was recorded using bilateral frontomastoid placement. Preparation of electrode sites and bifrontal electrode placement are described by Kellner and in other guidelines and handbooks for ECT (Kellner, Reference Kellner2018). ECT sessions included in the analysis were performed by multiple clinicians with standardised preparation and stimulation procedures. Data were derived from the Thymatron® end report printout of each session, and additional formalised clinical documentation listing administered medication and manually assessed seizure duration. Digitalisation of stored ECT for the current analysis was conducted between January and May 2020 by the first author (JE). Thymatron® printouts and paper forms were stored in the PUK patient case files in compliance with accepted data protection and record-keeping regulations.
Ethics
As solely technical ECT parameters and variables not allowing inference of the patient’s identity were included, the study received an exemption from normal ethics approval by the Zurich cantonal ethics committee. Obtaining a retrospective informed consent of all patients was considered disproportionate and not feasible.
Variables and data sources
Primary outcome was dynamic impedance and its dependency on different technical ECT parameters (static impedance, energy set, caffeine application, propofol dosage) and individual patient characteristics (age at ECT, sex, number of ECT sessions, time period since first ECT of the current series). Secondary outcomes were seizure quality parameters [Maximum Sustained Coherence, Seizure Duration, Postictal Suppression Index (PSI), Average Seizure Energy Index (ASEI), Time to Peak Power, Maximum Sustained Power (MSP), Time to Peak Coherence] and their association with dynamic impedance. No patient-identifying data such as name, date of birth, diagnosis or clinic identification number were included in the data set. Dynamic impedance is measured automatically by the Thymatron® during stimulation, static impedance after EEG electrode placement and prior to stimulation, with both quoted in ohm (Ω). Patient’s age at each ECT session was deduced from the date of birth and treatment date. Gender was classified binarily into female and male. The respective treatment stage (series versus maintenance therapy) and continuous number of included ECT sessions per patient were captured. Restimulations after insufficient initial seizure induction were incorporated in the data set for consistency reasons but excluded from analysis. Only first stimulations were used, as impedance measures in restimulations can differ from the primary static measurement. Propofol and etomidate were used as anaesthetics. Their effect on seizure length and quality has been thoroughly investigated (Stripp et al., Reference Stripp, Jorgensen and Olsen2018). Individual dosage (in mg) for each treatment was recorded alongside caffeine (200 mg intravenously 30–60 s prior to stimulation) if administered. The energy set was set by the clinician prior to stimulation. Initial electrical dosage was chosen according to the predictive ‘age/2 = dose %’-stimulation strategy, described in detail by Abrams and Swartz in the Thymatron® System IV instruction manual (Abrams & Swartz, Reference Abrams and Swartz2006). No stimulus titration was performed. EEG seizure duration is determined automatically by the Thymatron®. Seizure duration was manually reassessed by the clinician, as the machine in some cases could not detect seizure endpoint accurately. If both existed, only the clinician-observed EEG seizure duration was included in the analysis. EEG seizure durations longer than 25 s (20 s in patients > 75 years) are regarded as sufficient, meeting a technical ECT quality criterion. Ictal coherence, named ‘Maximum Sustained Coherence’ by the Thymatron®, depicts the highest coherence between EEG signals reached over any 3-s interval during seizure. A hemispheric synchronicity >90% is considered a quality parameter. The PSI describes to which proportion ictal activity terminates abruptly versus an undifferentiated decreasing endpoint. Values ≥80% indicate sufficient postictal central inhibition capacity and serve as independent predictor of seizure quality. Both the ASEI and MSP represent averaged ictal EEG power, reflecting the ‘potency’ of the seizure, but integrate different time periods: While the ASEI includes the total ictal EEG power during the full seizure length, the MSP computes the mean value of the 10-s EEG period with the highest average power. Time to Peak Power describes the time interval from seizure start to its maximal ictal EEG amplitude. Time to Peak Coherence reflects the time span between seizure onset and attainment of the highest interhemispheric coherence. We refer to the Thymatron® IV instruction manual for further information on the indices. Parameters and indices were analysed separately without specific groupings.
Bias
Manually reported data (observer-assessed EEG seizure duration, administered medication) were checked for plausibility by the first author prior to data base. The ECG variables (base and peak heart rate) were excluded from the analysis as they were recorded inconsistently with insufficiently correctable artefacts. Machine-derived seizure duration was visually reassessed by the first author as in some cases the Thymatron® did not detect seizure endpoints accurately. If both existed, manually controlled EEG seizure duration was included in the analysis. ECT sessions with a static impedance >3000 Ω were excluded as such high values point to recording or connectivity problems.
Statistical methods
Statistical analyses were performed with the R statistics environment (v4.0.3) (R computer program 2021). Packages lmerTest (v3.1-3) and lme4 (v1.1-26) were employed for linear mixed modelling (LMM) (Bates et al., Reference Bates, Mächler, Bolker and Walker2015; Kuznetsova et al., Reference Kuznetsova, Brockhoff and Christensen2017). For model diagnostics and performance evaluation, the package performance (v0.7.0) was used (Luedecke et al., Reference Luedecke, Makowski, Waggoner, Patil, Waggoner and Wiernik2020). Cohen’s f squared (f 2 ) as calculated by the effectsize package (v0.4.5) is provided as effect size measure for fixed effects coefficient estimates of the LMM (Ben-Shachar et al., Reference Ben-Shachar, Lüdecke and Makowski2020). Interpretation was small effect: f 2 ≥ 0.02, medium effect: f 2 ≥ 0.15, large effect: f 2 ≥ 0.35 (Cohen, Reference Cohen2013). A p-value < 0.05 was considered statistically significant.
Outcome aims
A two-model approach was chosen, as two different questions were addressed in the analyses. Primary analysis aimed at evaluating the potential influence of several pre-stimulation measures on dynamic impedance. Considering the unbalanced repeated measures design and very individual variation of impedance measures over the course of repeated ECT sessions, a linear mixed-effects regression model (LMM) was employed with Dynamic Impedance (Ω) as dependent variable, including a random intercept grouping by subject and the passed Days since first (included) ECT (d) as random slope effect per subject. Patient number (1–78), ECT stage (series vs. maintenance therapy) and current stimulation number (per patient) were defined as index variables. From available measures, Static Impedance (Ω), Age at ECT (y), Sex (factor levels: female/male), Energy Set (%), Caffeine Application (factor levels: no/yes), Propofol Administration (factor levels: no/yes) and the repeated measures variable Days Since First ECT (d) were tentatively chosen as fixed effects by theory and clinical observation.
A secondary correlation analysis to elucidate the association between dynamic impedance and Maximum Sustained Coherence (%), Seizure Duration (s), Postictal Suppression Index (%), Average Seizure Energy Index (µV2), Time to Peak Power (s), Maximum Sustained Power (µV2) and Time to Peak Coherence (s) as measures of seizure quality was performed. Distributions of most variables were heavily skewed. To reach approximate normal distributions, they were normalised according to Table 1.
Table 1. Transformations of variables for primary and secondary outcomes

Analogous to primary outcome analysis, relationships were analysed by seven LMMs with each of the above as dependent variable, random intercept per subject and random slope by the repeated measures variable Days Since First ECT. Dynamic Impedance as main predictor was accompanied by the covariates Sex and Age.
Results
Description of study participants
Seventy-eight patients (39 female and 39 male) aged 18 to 83 years at the time of ECT undergoing between 3 and 122 treatments (Median = 19, IQR = 17.75; no sex difference, p = .21) from May 2012 to March 2020 were randomly selected from the PUK ECT facilities data archive. After excluding restimulations and mini-series, N = 1757 of originally N = 1992 ECT sessions were included. There were no missing data in variables of the primary LMM analysis of dynamic impedance. In the secondary analysis, with dynamic impedance as predictor for several measures of seizure quality, the number of valid cases was determined by the amount of missing data in the respective criterion variable. Missing data (except for missing seizure duration) occurred due to seizures or seizure endings not being automatically detected by the Thymatron® resulting in manually determinable seizure lengths but missing computed quality measures. A summary of missing data is included in the appendix. Table 2 gives a descriptive overview of measures.
Table 2. Descriptive statistics and univariate sex group comparisons of the relevant variables

a Wilcoxon rank sum test.
b Rank-biserial correlation coefficient r rb as effect size for group comparisons of non-normal data. Interpretation: small effect: r rb ≥ 0.12, medium effect: r rb ≥ 0.24, large effect: r rb ≥ 0.41 (Lovakov & Agadullina, Reference Lovakov and Agadullina2021).
c X2 test, df = 1.
d Cramér’s V as effect size for X 2 contingency test is interpreted like r rb .
Average age at the time of ECT was 52.2 years [standard deviation (SD) = 15.5]. Women were insignificantly older [mean (M) = 54.4, SD = 15.7] than men (M = 50.0, SD = 15.1). On average, 22.5 ECT treatments per patient were included. Average dynamic impedance was 242.2 Ω (SD = 31.1 Ω); women featured significantly higher mean impedance than men (261.5 ± 25.0 vs. 222.9 ± 23.9 Ω). Average static impedance was 1272.2 Ω (SD = 368.2 Ω); impedance in female patients was significantly higher than in males (1466.8 ± 345.3 vs. 1077.6 ± 278.8 Ω). No significant sex difference was found in all analysed technical seizure quality criteria. In 62.1 % of included ECT sessions, patients received caffeine prior to stimulation. In 71 % of cases, propofol was applied as anaesthetic.
Table 3 shows Spearman’s rho correlations of all selected variables for primary and secondary outcomes.
Table 3. Spearman’s rho correlations of all variables of interest. Correlations are based on per-subject aggregations of raw longitudinal data. Correlation magnitude is indicated by increasing saturation of red cell; coefficients printed in blue are statistically significant (p < .05)
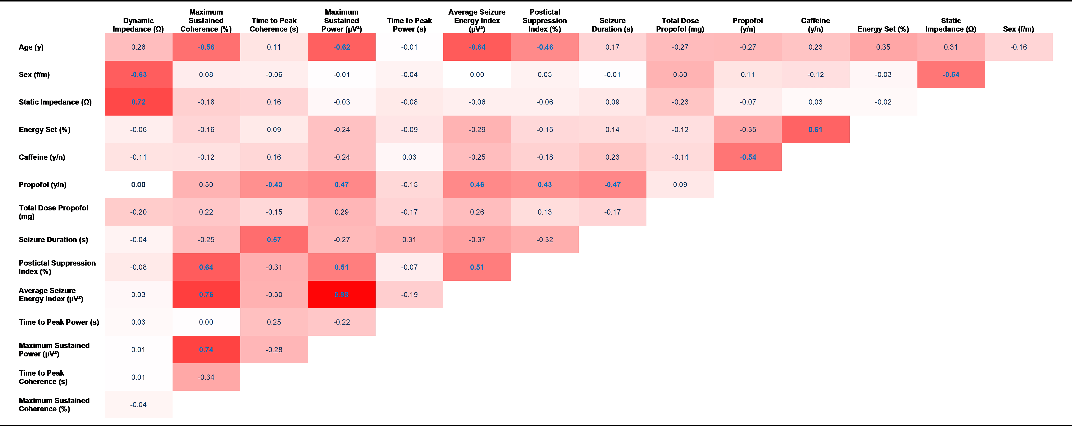
Dynamic impedance was highly correlated with static impedance. Men featured markedly lower dynamic impedance than women. Strong negative correlations were found between age and ECT quality criteria Maximum Sustained Coherence, MSP and the ASEI. Several technical quality parameters were correlated as described in detail below.
The fact that we found substantial effects with small effect sizes, as small as f 2 = 0.02, indicates the overall adequacy of sample size for the performed analysis. The initial multiple regression model for dynamic impedance was built including 8 variables and 10 interaction terms, still resulting in the three strongest predictors plus one interaction effect of said small effect size.
Dynamic impedance
Data were modelled with dynamic impedance as dependent variable and the aforementioned predictors (static impedance, age, sex, energy set, caffeine application, propofol application) and all possible two-way-interactions between continuous and categorical predictors as fixed effects plus a random effect comprising random intercepts for each subject and random slopes per subject for the repeated measures variable Days Since First ECT. In an iterative stepdown process, non-significant model terms were eliminated. Model quality was assessed by Bayesian Information Criterion and likelihood ratio test; 32 data points with residuals larger than 3SD of the residual distribution were removed, 1725 observations remained.
The resulting parsimonious model comprised three main effects and one interaction effect. Several quality parameters of the final model were evaluated: residuals were normally distributed; no multicollinearity was present among the predictors, variance inflation factors for all terms were ≤2.04; Fligner–Killeen test did not evince variance differences across groups (p = .55). Due to an unresolvable non-constant error variance, standardised regression coefficients (β) were estimated based on a heteroscedasticity-robust clustered covariance matrix (CR2) by using R-package clubSandwich (Pustejovsky & Tipton, Reference Pustejovsky and Tipton2018).
About 78 % of total variance was due to random effects indicating that strong individual, unmeasured factors influence subjects’ dynamic impedance initial response and its variation over time. Marginal R2 was 0.63, stating a good model fit by the included predictors.
As expected, static impedance was the strongest, positively related predictor for dynamic impedance and demonstrated a very large effect (β = 0.66 [95% CI 0.62–0.71], t (1684) = 43.25, p < 0.001, f 2 = 1.13), see Fig. 1 for all model effects.

Fig. 1. Effect sizes for predictors of dynamic impedance.
Interestingly, a differential influence of sex on that effect of static impedance on dynamic impedance became apparent (Static Impedance × Sex: β = 0.10 [95% CI 0.06– 0.14], t (1684) = 6.51, p < 0.001, f 2 = 0.02), illustrated in Fig. 2.
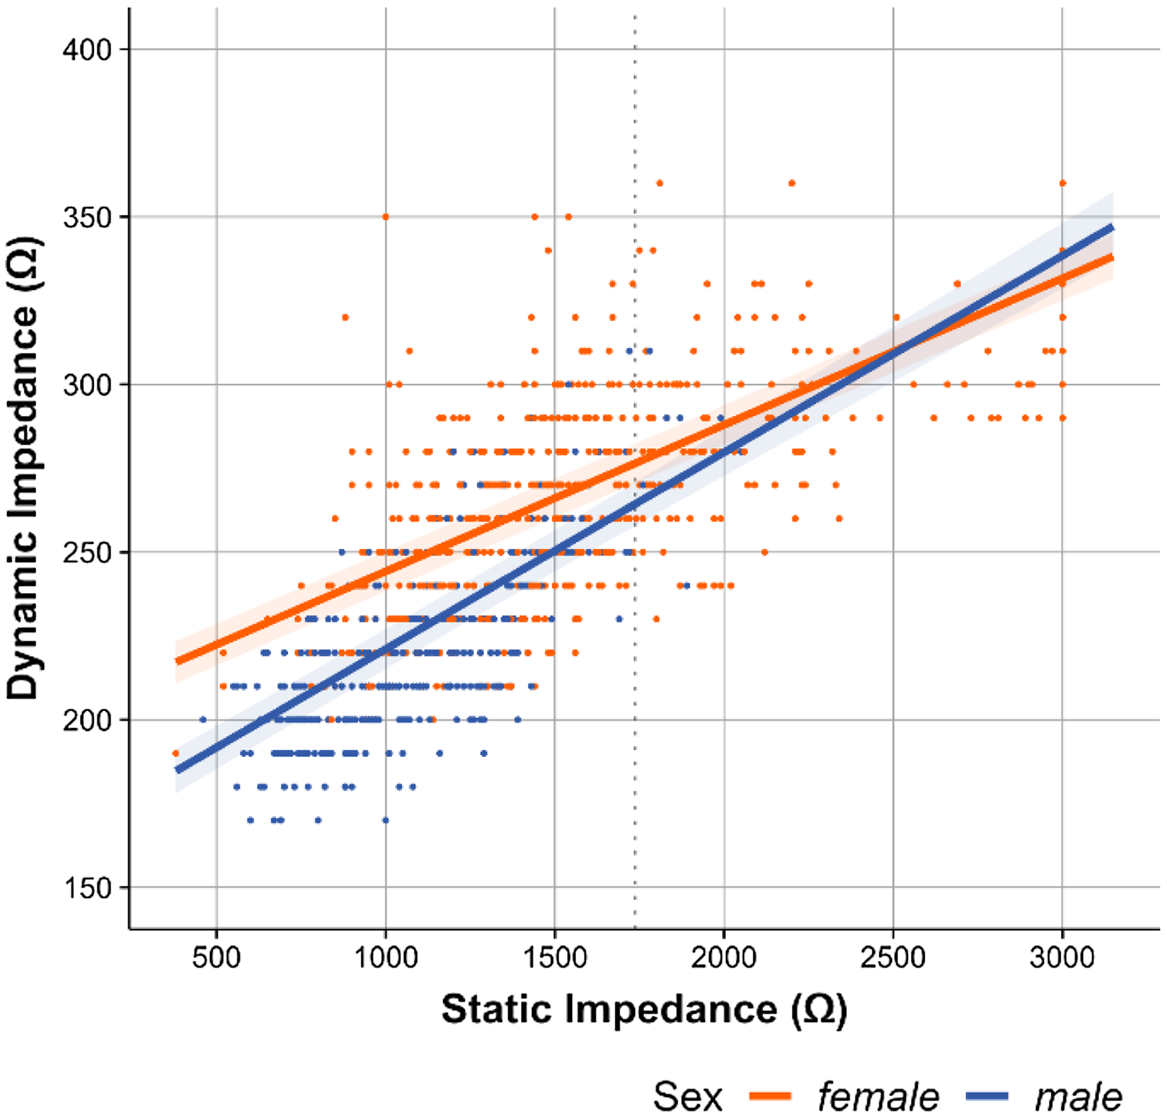
Fig. 2. Correlation of dynamic impedance with static impedance.
While women presented higher dynamic impedance than men (Sex: β = 0.25 [95% CI 0.13–0.37], t (1684) = 4.07, p < 0.001, f 2 = 0.31) at static impedance levels below approximately 1700 Ω (80 % of all ECTs), the stronger relationship between static and dynamic impedance in men (steeper slope) was rendering the sex effect insignificant at static impedances above 1700 Ω. No other interaction effects were observed. Energy setting showed a decreasing influence on dynamic impedance (β = 0.22 [95% CI 0.18–0.26], t (1684) = 18.72, p < 0.001, f 2 = 0.22). Further, no association of age with dynamic impedance was found. Using propofol (Disoprivan®) as compared to other anaesthetic regimens and caffeine had both no significant effect on dynamic impedance and were removed from the model.
Association of dynamic impedance with ECT quality criteria
Seven LMMs were performed each with one seizure quality criterion (ASEI, MSP, PSI, Maximum Sustained Coherence, Seizure Duration, Time to Peak Power, Time to Peak Coherence) as dependent variable and Dynamic Impedance, Age and Sex as fixed effects, including a random intercept per subject and random slopes by Days Since First ECT. Models were reduced to retain only significant terms, or in case, none were significant, to the main predictor variable. Model quality was assessed as in the primary outcome analysis. Outliers were removed only for models with significant main predictor. Coefficient significance testing was based on the heteroscedasticity-robust clustered covariance matrix (CR2). The variance inflation factors for all predictors of resulting models were found well below the critical limit of 5, indeed below 2.5, indicating low correlations among them.
Dynamic Impedance was significantly related to Maximum Sustained Power (β = 0.17 [95% CI 0.10–0.25], t (1160) = 5.17, p < 0.001, f 2 = 0.05; Age: t (1160) = 7.68, p < 0.001, f 2 = 0.72; whole model ICC = 0.50, marg. R2 = 0.29) and ASEI (β = 0.16 [95% CI 0.07–0.25], t (808) = 4.52, p < 0.001, f 2 = 0.02; Age: t (808) = 7.87, p < 0.001, f 2 = 0.71; whole model ICC = 0.62, marg. R2 = 0.33) with small effect sizes. Noteworthy was the very strong impact of age (very large effect sites of f 2 > 0.70) on both of these EEG power measures. Controlling for this confounder revealed the influence of Dynamic Impedance, which was not visible in the simple correlation analysis in Table 3. No other seizure quality criterion showed significant relation with Dynamic Impedance. See Fig. 3 for the main predictors’ Cohen’s f2 effect sizes.

Fig. 3. Association of dynamic impedance with quality criteria.
Further correlation analysis
Several technical quality criteria were significantly correlated with propofol application: Seizure Duration (ρ = −0.47) and Time to Peak Coherence (ρ = −0.43) showed a negative correlation, whereas the MSP (ρ = 0.47), ASEI (ρ = 0.46) and PSI (ρ = 0.43) were positively related (in all cases p < .05). The following technical quality criteria showed a significant positive correlation among each other: Maximum Sustained Coherence was positively correlated with the PSI (ρ = 0.64), ASEI (ρ = 0.76) and Maximum Sustained Coherence (ρ = 0.74), while the MSP interrelated significantly with the PSI (ρ = 0.64) and ASEI (ρ = 0.98).
Discussion
Dynamic and static impedance in bifrontal ECT were strongly positively correlated. Both dynamic and static impedance were significantly higher in females than in males. Impedance levels tended to increase with age but were not statistically significant. Application of caffeine prior to stimulation and use of propofol as anaesthetic had no effect on both dynamic and static impedance. For secondary outcomes, dynamic impedance correlated significantly with the amplitude and power (represented by the ASEI and MSP), but not with the progression over time of the induced seizure (Seizure Duration, Time to Peak Power, Time to Peak Coherence), hemispheric synchronicity (Maximum Sustained Coherence) or postictal central inhibition capacity (PSI).
Concurrent with previous studies investigating bitemporal and RUL electrode placement, our findings demonstrated a correlation of dynamic and static impedance with bifrontal stimulation in ECT. Measured impedance varied considerably inter-individually and between consecutive treatments as impedance is determined substantially by a) patients’ local/anatomical properties and b) preparation and fixation of the electrode.
Both mean dynamic and static impedance were significantly higher in women than in men. One prior study applying transcranial electrical stimulation found the same effect (Russell et al., Reference Russell, Goodman, Visse, Beckett, Saito, Lyeth and Recanzone2017). However, the physical reasons for this effect are not totally clear. Earlier studies reported mixed findings on the female skull, but overall no strong differences (Ross et al., Reference Ross, Jantz and McCormick1998; Lynnerup, Reference Lynnerup2001). Differences in a) subcutaneous fat thickness (f > m) and b) cranial muscle thickness (m > f) could overall result in better conductivity/lower resistivity in men compared to women. Both skin and skull are complex tissues with at least three components with different electrical properties (Peters et al., Reference Peters, Stinstra and Hendriks2001). Similar reasons for the different resistivity between men and women could most likely explain the higher impedance with older age as was shown before in skull samples (Hoekema et al., Reference Hoekema, Wieneke, Leijten, van Veelen, van Rijen, Huiskamp, Ansems and van Huffelen2003). This effect at the level of the skull is complemented by similar alterations in the structural and physical properties of ageing skin and subcutaneous tissue (Kemp et al., Reference Kemp, Després, Pebayle and Dufour2014). However, this association proved to be not statistically significant.
Application of caffeine and propofol did not correlate with impedance levels. This could support models of ECT’s mechanism of action that the main effect is not electrical current running directly through the brain but more inductive effects and electric fields (EFs) evoking the seizure as main therapeutic effect, as both substances influence the excitability of cerebral neurons, but have no effect on electrical conductivity itself (Hoyer et al., Reference Hoyer, Kranaster, Janke and Sartorius2014; Bozymski et al., Reference Bozymski, Potter, Venkatachalam, Pandurangi and Crouse2018). Research into EFs evoked with transcranial electrical stimulation is increasing but the marked electrical differences between the different techniques such as transcranial direct current stimulation (TDCS, direct current, up to 2 (−4) mA current), transcranial alternating current stimulation (TACS, up to 5 kHz sinusoidal stimulation, up to 2 mA current) and ECT (stimulation frequencies up to 140 Hz, pulse width up to 1.5 ms, current up to 910 mA) have to be taken into account (Abrams & Swartz, Reference Abrams and Swartz2006; Tavakoli & Yun, Reference Tavakoli and Yun2017; Thair et al., Reference Thair, Holloway, Newport and Smith2017). Alternating currents with higher frequencies, however, show different EF distributions, making the transfer of EF distributions between these methods difficult to impossible until explicit comparisons between the EFs evoked by different methods have been made (Sartorius, Reference Sartorius2022). Our findings on correlations in bifrontal stimulation support EF models and contribute to fundamental technical and physiological understanding of ECT.
With static impedance being partially modifiable by skin preparation prior to electrode positioning, this process can influence dynamic impedance. Reducing dynamic impedance will reduce the voltage required to apply treatment with the energy set determined by the clinician which could reduce ECT’s side effects. However, this specific effect needs confirmation in a controlled clinical study.
The Thymatron® provides several ’seizure quality measures’ based on EEG monitoring. Further ictal parameters, that is, EMG seizure duration and peak heart rate, have been previously identified as valid quality criteria. We demonstrated here a significant positive correlation, albeit with small effect sizes, between Dynamic Impedance and both the ASEI and MSP (internal correlation: ρ = 0.98), but not with other quality parameters. Supra-threshold stimulation with the clinical focus on inducing a sufficient seizure might have minimised the effects of other potential factors.
The patient’s age had the strongest effect on the ASEI and MSP, clearly exceeding the effect size of dynamic impedance. This was most likely due to anatomical changes at an older age. However, as dynamic impedance is, contrary to age, partially open to directed modification, the demonstrated correlation might be clinically relevant. The ASEI and MSP are closely related as they both represent the ictal EEG power over time. As the Thymatron® is a constant, current machine voltage is increased with higher dynamic impedance values to keep the current constant. ASEI and MSP are computed on the basis of EEG voltage with higher voltage leading to a rise of both measures.
The fact that the closely related Time to Peak Power and Time to Peak Coherence did not correlate with dynamic impedance may be explainable by the chronological seizure progression being presumably largely independent of the stimulus’ properties – including dynamic impedance – after the initial seizure induction (Jirsa et al., Reference Jirsa, Stacey, Quilichini, Ivanov and Bernard2014). Neither dynamic nor static impedance correlated with seizure duration in our analysis, which could be explained by the non-linear correlation of current strength and seizure duration in ECT resembling a U-shape: While stimulation slightly above seizure threshold induces longer seizures, their duration recedes with increasing current strength. However, seizure induction excessively above threshold leads to prolonged and tapering seizures. As no stimulus titration was performed in ECT at the PUK, current strengths mostly likely varied considerably regarding their gap to threshold levels, thereby cloaking a potential correlation of dynamic impedance and seizure duration while underlining its non-linearity. It appears that in our analysis, correlation strength between static impedance and ECT quality parameters tended to be stronger – even if not significantly – than with dynamic impedance as can be seen with Maximum Sustained Coherence and Time to Peak Coherence. While dynamic impedance is more variable and changes during the passage of the stimulus, static impedance represents steadier properties of the brain, thereby facilitating the detection of correlations. Based on our findings, ECT quality parameters could potentially be divided into the ones, which are closer associated with the amount of current entering the brain and therefore dynamic impedance levels, such as ASEI and MSP, and those more independent of initial induction. In addition, our data are derived from ECT series as well as maintenance treatments. Therefore, effects such as variably increasing seizure threshold during the series and again decreasing seizure threshold during the maintenance treatment are not included in the analysis. They would be expected to affect the correlation between impedance measures and seizure quality measures, but not the impedance measures which is reflected in their high correlation.
Concordant with the EF hypothesis, the amount of current entering the brain is of less importance. Dynamic impedance potentially influences electric field generation, therefore being clinically relevant (Deng et al., Reference Deng, Argyelan, Miller, Quinn, Lloyd, Jones, Upston, Erhardt, McClintock and Abbott2022). Clinical relevance of individual technical outcome parameters is not yet conclusively clarified (Janouschek et al., Reference Janouschek, Langbehn, Nickl-Jockschat and Groezinger2020). Kranaster et al. developed a validated efficient five-item seizure quality index based on ictal parameters for prediction of a patient’s response to ECT (Kranaster et al., Reference Kranaster, Aksay, Bumb, Hoyer, Jennen-Steinmetz and Sartorius2018). As heart rate measures were excluded from analysis and EMG not recorded, we could not the association of dynamic impedance with these index scores.
Further investigation of validity and utilisation of impedance as treatment quality criterion appears advisable, especially considering a potential association with cognitive side effects. Thorough skin preparation and electrode fixation for lowering static impedance may gain clinical importance.
Limitations
Due to its retrospective design, the study did not include a control group. Selection bias was assumedly very small as patients were randomly selected from the ECT site’s patient registry. Secondary analysis faced sizeable numbers of missing data, ranging from 2% for Seizure Duration to 37.9% for PSI values. Despite standardised skin preparation procedures and electrode placement, deviations may have occurred both between different clinicians and in patient-related factors. In addition, the individual treating clinician as well as circumstances such as temperature and humidity were not documented and assessed. Therefore, we cannot exclude other factors than pure variance in impedance possibly involved in the effects seen here. With no stimulus titration performed, direct correlations of dynamic and static impedance with seizure threshold could not be assessed. Furthermore, due to missing data and non-collection of constituent parameters, the association of impedances with seizure quality indices could not be investigated.
Given the exploratory approach of the two-model design of our study, we acknowledge that our findings require replication in other data sets. Further studies could apply structural equation modelling or path analysis models based on the findings of our work.
Generalisability
The demonstrated correlation of dynamic and static impedance was strong and robust across all analysed patient characteristics factoring in potential differences in ECT preparation, therefore allowing extrapolation to other bifrontal ECT settings. Impedance levels varied inter-individually and intra-individually between consecutive ECT sessions, but the association remained strong.
Supplementary material
To view supplementary material for this article, please visit https://doi.org/10.1017/neu.2023.10
Author contributions
Jan Exner: study design, data collection, data preparation, statistical analysis, interpretation of data, drafting the article; Gunnar Deuring: data preparation, statistical analysis, interpretation of data, revising the manuscript; Erich Seifritz: reviewing and revising the manuscript; Annette Brühl: study concept and design, interpretation of data, statistical analysis, drafting, revising and final approval of the manuscript.
Financial support
This research received no specific grant from any funding agency, commercial or not-for-profit sectors.
Statement of interest
The authors declare no competing interests.
Ethical standards
The authors assert that all procedures contributing to this work comply with the ethical standards of the relevant national and institutional committees on human experimentation and with the Helsinki Declaration of 1975, as revised in 2008. As a retrospective study of primarily technical data, the study received an exemption from specific ethics approval by the Zurich cantonal ethics committee.


 Open access