


Introduction
A previous attempt (Paterson, unpublished) to test the theoretical expression for the longitudinal strain-rate at the center of a valley glacier (Reference NyeNye, 1951; Reference Nye1959[c]) has shown, at best, inconclusive results. This has been partly due to the use of only the simplified equation for strain-rate (Reference NyeNye, 1951) and an apparent omission of testing quantitatively the validity of the curvature term in Equation (1).
It will be shown in this paper that where the curvature term is valid the theoretical value of strain-rate is in fair agreement with the values measured on the surface of two glaciers, one temperate and one polar.
Previous estimates of the strain-rate associated with initial fracture of the glacier surface are given by Reference MeierMeier and others (1957) and Reference MellorMellor (1964) as 1% year−1 (2.8 × 10⁻⁵ d−1) and 10−9 s−1 (8.7 × 10⁻⁵ d−1) respectively. The former was for a glacier in which the 10-m temperature was −6.5°C; the temperature of the latter was unspecified. These values were not related with a strain-rate gradient although this is considered to be significant by the present author.
Crevasse depths have been measured with varying degrees of accuracy for many decades but few plausible theoretical analyses have been made and even fewer attempts to test them. The current investigation indicates that the initial formation of’ crevasses is associated with local strain-rates approximately the same magnitude as the regional values.
Previous analyses of crevasse spacing have been either completely empirical or analytical with doubtful validity, and further work remains to be done.
Geographical and Physical Descriptions of the Two Glaciers Investigated
-
i. The Kaskawulsh Glacier lies within the Icefield Ranges, St Elias Mountains, Yukon Territory, Canada. The area investigated covers 4 km2 of glacier surface located approximately at lat. 60° 47′ N., long. 139° 28′ W., on the north arm of the glacier above an ice fall (Fig. 1).
The area lies in the accumulation zone, between 2 390 m and 2 450 m a.s.l., the balance line being at about 2 150 m a.s.l. Here the glacier is about 4 km wide and more than 600 m deep. Late in the summer the ice is at 0°C to a depth of at least 24 m so that the glacier here may be regarded as temperate. The mean central surface ice flow is about 130 m year−1 horizontally. Surface slopes are about 2°. Ice flow is convergent as well as extending in nature.
At about 10 km from the ice divide where the north arm originates (2 650 m) the first transverse fractures were detected at about 2 435 m a.s.l. There is strong marginal crevassing, which extends up-glacier beyond the first transverse fractures. The influence of the former on the latter has been neglected. The field observations were made between 4 July and 15 August 1964.
-
ii. The Meserve Glacier (Fig. 2) occupies an elongated cirque on the south side of Wright Valley, Antarctica. The area investigated covers less than 1 km2 of glacier surface located at approximately lat. 77° 35′ S., long. 162° 42′ E. at an elevation of 1200 m, in the firn area above an ice fall. The ice is up to 200 m thick and about 1.3 km wide. The temperature at 10 m depth is −27.9°C. Mean central surface velocities are 8.8 mm d−1 (3.21 m year−1) and ice flow is convergent as well as extending in nature.
Transverse crevasses are strongly developed but are difficult to detect, so that the position of crevasse I (Fig. 3) is only approximate. On the western margin shear crevasses distort the ends of the transverse crevasses, but this is not the case on the east side. The observations reported here were made between November 1966 and January 1967.

Fig. 1. Geometry of the survey network and the configuration of the transverse crevasse field, Kaskawulsh Glacier.

Fig. 2. topographie map of Meserve Glacier

Fig. 3. Velocity distribution for upper Meserve Glacier.
Theoretical Considerations
Longitudinal strain-rates
Reference NyeNye (1951, Reference Nye1952, Reference Nye1957, Reference Nye1959[a], Reference Nye[b], Reference Nye[c]) has developed an equation for the longitudinal strain-rate in an ice sheet or at the center of a valley glacier whose width is much greater than its depth. The terms of the equation are measurable parameters.
Ice is assumed to be both homogeneous and isotropic. Allowance is made for the fact that the shear stress on the bed is not constant.
From the results of Reference NyeNye (1959[a], p. 401; Reference Nye1959[c], p. 506) the longitudinal strain-rate

where

Other terms used in this paper are:

Crevasse depths
Reference NyeNye (1957) derives a depth formula of the type

which is obtained by replacing the yield stress in tension by the equivalent strain-rate for extending flow. The appropriate values of B and n are presumably given by the experimental results of Reference GlenGlen (1955). The appropriate strain-rate which has not been clearly defined, has been previously taken by the author and Reference MeierMeier and others (1957) as
Crevasse spacing
There is a paucity of general information bearing on the problem of crevasse spacing. Approaches hitherto have been either empirical or analytical of questionable validity. Reference MeierMeier and others (1957) suggest a mean spacing of about 4 d for certain unclassified crevasses in the Blue Ice Valley, Greenland. Reference HoldsworthHoldsworth (1965) found that a mean spacing s is given by s = 2.8 d with a range of 2.7 d to 3.3 d for true transverse crevasses. Reference NielsenNielsen (1958, p. 47) claims to provide an explanation for the apparent uniformity of crevasse spacing. He considers a flowing cantilever ice slab, which, on attaining an unsupported length s, fractures in elastic bending. If the ice thickness is h (constant) and the tensile strength of the upper layers Q (assumed approximately equal to the bending strength), then it may be shown that the spacing

Nielsen’s expression can be modified by inserting the surface strain-rate, assuming that bending and direct extension have essentially the same effect on the surface layers of the glacier. Thus the spacing formula becomes

This implies that for small variations in h and
If plastic theory is used, the result obtained is not substantially different; it will not be given here. Nielsen’s concept suffers from the fact that the bending moment, which is a function of h, cannot be produced by cantilever action. In addition, the existence of adjacent fractures is not considered whereas the few data collected suggest a reasonable correlation between the depth of primary transverse fractures and the fracture spacing.
By considering only the distribution of surface stress built up behind the last crevasse, and assuming this to be roughly linear, we could write

where s is the distance from the existing crevasse, where σ x = 0, to the position of the next incipient fracture, and ∂σ x /∂x = gradient of stress up-glacier.
Equation (5) may be rewritten as

Therefore, by knowing a value of
A fundamental approach to the problem would be to investigate in a suitable model study the stress distribution around a crevasse, using photo-plastic techniques (Reference Frocht and ThomsonFrocht and Thomson, C1958).
Field Measurements and Results
(I) Kaskawulsh Glacier
Velocity determination. Surface velocity measurements in the area of the crevasse investigations for the one-year period 1962–63 have been made by Reference SharniSharni (unpublished), and for the year 1963–64 by Reference BrecherBrecher (1966), who also attempted to determine short-term variations of surface velocity during the summer of 1964. The configuration of velocity vectors is shown in Figure 4. Any variations of velocity were obscured by the standard error of measurement, which was about 10%. Figure 5 shows the surface velocity distribution (horizontal component) for July to August 1964.Footnote *

Fig. 4. Configuration of flow-line field based on velocity data, Kaskawulsh Glacier.

Fig. 5. Velocity contours for Kaskawulsh Glacier. (a) Contours of total velocity V, m d−1. (b) Contours of velocity component Vx, m d−1. (c) Contours of velocity component Vy, m d−1.
Strain-rate determination. Standard strain diamonds provided values of central strain-rate for the period from 1 July to 11 August 1964. Procedures of data reduction followed those of Reference NyeNye (1959[b]). Values of regional strain-rate have been computed from the areal velocity measurements over an area much larger than that of the direct strain-rate measurements. A value of the regional critical extending strain-rate is obtained by overlaying a plot of the crevasse traces on the principal extending strain-rate diagram (Fig. 6a). An estimate of +3.5±0.5 × 10⁻⁵ d−1 is thus obtained. The associated strain-rate gradient is about 0.005 × 10⁻⁵ d−1 m−1. Table Ia shows component values of theoretical longitudinal extending strain-rate calculated from the terms in Equation (1). Each of these terms will be discussed briefly.
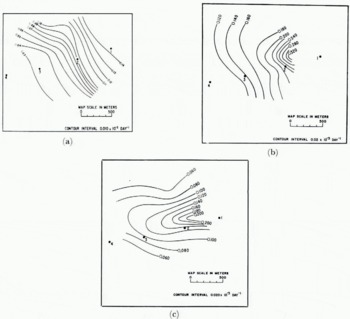
Fig. 6. Strain-rate contours for Kaskawulsh Glacier. (a) Contours of principal extending strain-rate
The accumulation term is positive in sign. Values of mean net annual accumulation have been obtained from R. H. Ragle (personal communication) for 1961 to 1963, and from pit studies in 1964 (Reference HoldsworthHoldsworth, 1965, p. 37).
Table I Component and Total Theoretical. Strain-rates; all Components × 10−5 d−1

The so-called curvature term, U s κ α cot α, is valid only if


The rate of change of ice thickness is positive if the glacier surface at a point is rising with time. Since 1961 there has been a lowering of the surface, hence the term is negative, giving a positive contribution to
The true bending term,

The fact that there is very little correspondence between measured and computed strain-rates is probably due to the rapidly changing geometry of the glacier in the restricted length of glacier studied and to the presence of the crevasses. One of the most important terms in Equation (1) is U s κ cot α. Since this term holds only for low rates of change of curvature, it is suggested that if the bending term is used, it must be used on smoothed-out profiles, as is done in the present case.
Strain-rates measured on laboratory ice which is tested to failure in tension, generally show little agreement with strain measurements made on glaciers. These differences may be attributed to inhomogeneity of the surficial layers of a glacier where firn and firn-ice predominate.
Thermal shock may be significant and the rate of development of thermal stresses important in determining the local value of σ c and hence of
Figure 8 shows that the direction of the principal extending strain-rate (
Crevasse depths. Reference NyeNye and others (1954) and Reference NyeNye (1955) have discussed, generally, the problem of the depth of crevasses. Reference Schuster and RigsbySchuster and Rigsby (1954) state that observed crevasse depths generally vary from 50 ft to 100 ft (15 m to 30 m) but may extend to 150 ft (45 m) or more. According to Reference SeligmanSeligman (1955) most crevasses in the European alpine glaciers do not exceed 30 m in depth, but Reference LoeweLoewe (1955, p. 511) cites a crevasse in the Bernese Oberland as being nearly 40 m deep (the position was probably in cold ice).
Estimates of crevasse depths from Alaskan glaciers range from 20 in to 40 m. Some of these values have been obtained from seismicdata (e.g. Reference GoldthwaitGoldthwait, 1936, p. 503; Miller in Reference NyeNye, 1955). Crevasses in Greenland and Antarctic glaciers have been reported as being up to 150–200 ft (45–60 m) in depth. In few of these reports has the type of crevasse been specified.
Five of the primary transverse crevasses on Kaskawulsh Glacier show a range of measured depths between 24±0.5 m and 28±1 m.
Meyerhof (in Reference NyeNye and others, 1954, p. 340) obtains an expression which gives fracture depths of from 23 m to 46 m, but since soil mechanics theory is used, the validity of the method is suspect.
Before proceeding it must be pointed out that previous investigators (Reference MeierMeier and others, 1957; Reference HoldsworthHoldsworth, 1965) incorrectly used the relationship attributed to Reference NyeNye (1955)

where B is the constant in the relation between tensile strain-rate and tensile stress on the glacier surface. A corrected relationship is found in Reference NyeNye (1957, p. 128) which is obtained by putting σ x = 0 in the stress equation (p. 118) and solving for d (Equation (2)). Because the surface slope α is small, (3 sin2 α+1)−1/2 ≈ 1 and Equation (2) reduces to

Thus table IV in Reference MeierMeier and others (1957, p. 40) and table 2 in Reference HoldsworthHoldsworth (1965, p. 40) must be recalculated.
Table II Crevasse Depths, Kaskawulsh Glacier

Table III Recalculation of d from Data of Reference MeierMeier and others (1957, p. 40)

The corrected results for Holdsworth’s data are shown in Table II and for Meier and others, data in Table III. In both cases there is now a close correspondence between the observed and the computed values of d (especially in Table III), obtained by taking values of B appropriate to the mean temperature (−1.5°C) within the first few meters of firn. The use of a value of B corresponding to θ = −12°C(which is actually not in agreement with the temperature data) is therefore considered to be incorrect (see also Reference MeierMeier and others, 1957, p. 52).
Using the expression obtained by Reference NyeNye (1957), Equation (7), an estimate of the theoretical crevasse depth corresponding to a known strain-rate is obtained. Data from Reference GlenGlen (1955, p. 519) have been used to provide appropriate values of B and n. Regional as well as “across crevasse” strain-rates have been used to compute d in Table II. Only values of regional strain-rate produce a close correspondence between computed and observed depths. In a previous paper, Reference HoldsworthHoldsworth (1965) used
In this latter case it was assumed that strain on inter-crevasse blocks is negligible. That this is not so has been demonstrated by placing strain diamonds between crevasses on the Meserve Glacier, discussed in the second part of this paper. Further evidence that the assumption is incorrect is furnished by a plot of crevasse spacings (Fig. 7) through the “ice fall” on the Kaskawulsh Glacier, where it is seen that crevasse spacings decrease down-glacier to about half of their maximum value up-glacier, indicating secondary rupture of the primary crevasse system. This is also supported by direct measurements of

Fig. 7. Plot of crevasse spacing with distance down-glacier, Kaskawulsh Glacier.
According to Equation (7) the depth of an individual crevasse will vary as
From Equation (7) it can be shown that

Thus for a 10% change in
The empirical constant B in the flow law is extremely temperature sensitive, so that an accurate value of englacial temperature must be determined. Recalculating the data of Reference MeierMeier and others (1957) shows that if the minimum recorded temperature is used to determine B, a value of d = 30 m is obtained using Equation (7). The actual temperatures ranged from −0.5° to −6.5°C, with a mean of about −3.0°C, corresponding to a value of B which would yield a value of d = 25 m (crevasse 2). It is not fully clear why a value of −12°C was used, although this produces a good agreement between the measured depths and those computed from the incorrect equation,

In the case of temperate ice, B is fixed and any anomalies are produced by the value of
There are two possibilities:Footnote * Either (i) the crevasses are formed at different times, for example, one in the winter and one in the summer, or (ii) the crevasses form in pairs during the winter when surface temperatures are lower and a lower value of
Assumption (i) is based on a consideration of Equation (1) from which one may conclude that the position of fracture is dependent only on the physical geometry of the glacier boundaries at that point and on the rate of flow both at the surface and at the base. Consequently it is reasonable to conclude that, given the values of

Assumption (ii) is, on the other hand, worthy of consideration. First we have to establish what is the criterion of failure: strain-rate or stress. If the general flow law is used for the temperate and polar glaciers with appropriate values of B, the critical stresses σ c are not greatly different in the two cases (Appendix II). Hence, applying this reasoning to the Kaskawulsh Glacier alone, for summer and winter conditions, if we lower the temperature at a point where
The dilemma is therefore not satisfactorily resolved. In concluding, some remarks on the strain-rate gradient, thermal stresses and stress concentrations will be added.
-
a. Strain-rate gradient: From the point of view of the response of material to the rate of stress application, this parameter should be considered because it is known that the ultimate strength of certain materials is dependent on the rate of application of the deforming stress.
-
b. Thermal stresses: Although the effect of temperature has been considered in conjunction with the flow-law calculations (see Tables II, III, IV and Appendix II), direct stresses due to thermal shock have not been considered independently.
If, for ice, the horizontal components of stress are given by
(9)
where E is Young’s modulus (bars), α is the coefficient of linear expansion (deg−1), μ is Poisson’s ratio and ΔT is the temperature change (deg). Then the thermal stresses which will be tensile for a decrease of temperature may be estimated.
Reference DorseyDorsey (1940, p. 446 and p. 472) gives for ice E ≈ 935 kg mm−2 ≈ 9.16 × 10⁴ bar, μ ≈ 0.35, α ≈ 50 × 10−6deg−1.
Using these values, σ x = σ y ≈ 7 bars per degree, which is significant compared with the stress produced by the flow of ice induced by boundary conditions of a purely geometrical nature. The existence of these stresses has been recognized by the author on areas of bare ice on Meserve Glacier. After a significant air temperature drop of 5 to 10 deg, the passage of a person wearing crampons over the surface caused the latter to fracture violently. This phenomenon was both audible and visible.
However, primary transverse crevasses occur almost exclusively in areas of firn and consequently the values of the parameters used in Equation (9) will be different. In the absence of information about μand α for snow, only a rough estimate of σ x can be made using E ≈ 50 Kg mm−2 (≈ 5 kbar) (Reference DorseyDorsey, 1940, p. 445). Then σ x ≈ 0.377 bar, which is still comparable with the stresses generated by the dynamic factors. To be considered also is the rate of temperature change on which any adjustment of the snow pack tending to relax the stresses will depend.
Since thermal shock is a near-surface phenomenon and since we have postulated that crevasses form initially at the surface, it may be seen that thermal stresses may be significant in certain cases.
-
c. Stress concentrations: In a previous paper (Reference HoldsworthHoldsworth, 1965) it was found necessary to appeal to local concentrations of stress in order to produce a computed value of d which would agree closely with the measured values. With the use of the correct depth formula, Equation (7), this concept need not be pursued, except to add that once a fracture has formed, it may be propagated by stress concentrations developed at the bottom and ends of the crack. In metals, before rupture in tension, “Griffith cracks” are considered to exist and the local concentrated stress is given by σ = 2σr (l/R)1/2 where 2l is the crack length, R is the radius of curvature of the ends and σ r is the regional stress acting perpendicular to the crack length. Thus as R tends to small values, the local stress σ can attain very high values. Using this information we may suppose that the crevasse may propagate laterally into regions where σ x ≪σ c, although the direction of crack propagation is governed by the relative values of σ x , σ y , and τ y x (see Appendix III). With depth, the crack terminates when the tensile stress is less than the tensile strength of the ice at that depth.

Field measurements (Reference MeierMeier and others, 1957; Reference NyeNye, 1959[b]; Reference PatersonPaterson, unpublished; Reference Wu and ChristensenWu and Christensen, 1964; Reference HoldsworthHoldsworth, 1965) indicate that large variations of the direction and magnitude of
Crevasse spacing. Measurements of crevasse spacing are plotted against position on the glacier (Fig. 8). Where a significant lateral variation in spacing between two adjacent crevasses occurred, the individual values are plotted together; the mean was taken. Otherwise, in some cases a 20% variation was recorded. Figure 8 shows that crevasse spacings vary from about 30 m to 100 m with a mean of about 75 m. A decrease in spacing appears to occur with increasing age of the crevasses and this can probably be explained by secondary fracture on intercrevasse blocks, meaning that strain on such blocks is not negligible as had been assumed previously (Reference MeierMeier and others, 1957; Reference HoldsworthHoldsworth, 1965).

Fig. 8. (a) Configuration of principal strain-rate field in region of the transverse crevasses. (b) Longitudinal variation of principal extending strain-rate.
Another approach, in order to explain variations in s, would be to appeal to surface and depth changes in the structural properties of firn and ice. Laboratory tests on the ultimate tensile strength of ice (see for example [SIPRE], 1951) commonly show variations over 300%. Such a variation of σ c would be more than sufficient to account for the observed variations in s (e.g. 70±35 m). However, the concept of secondary fracture explains satisfactorily the apparent gradient of spacing and is supported by the observation that crevasse 18 was only 20 cm wide but was flanked by crevasses at least 5 m wide, suggesting a difference of age.
Using the formula of Reference NielsenNielsen (1958, p. 47) and putting h = 650 m, Q = 2 bars (estimated, from laboratory tests, etc.) and ρ = 0.70 Mg m−3, a value of s ≈ 79 m is obtained. This agreement with the observed spacing is considered to be fortuitous, however, as indicated in the previous discussion of the formula and because the value of s in Nielsen’s treatment is dependent on h, which is unreasonable.
As a matter of interest, if Equation (4) is used for the Kaskawulsh Glacier, with
(II) Meserve Glacier
Velocity determination. Surface velocity measurements in the névé region are shown in Figures 2 and 3. Central horizontal components of ice flow rates indicate extending flow, being 0.47 cm d−1 at b and 0.88 cm d−1 at a for the period 3 December 1966 to 27 January 1967. It is not yet established whether the flow rate shows significant variations from season to season. Because there is no basal slip, any variations in U s can only be due to changes in accumulation rate and in temperature, neither of which are likely to produce variations of U s beyond the standard error of measurement.
Strain-rate determination. Figure 9 shows the pattern of strain diamonds, arranged so that the principal strain-rates spanning consecutive crevasses and those confined to intercrevasse “blocks” could all be measured. The results show that the strain on intercrevasse “blocks” is not negligible but is almost the same as the value obtained from the diamond spanning the crevasses.

Fig. 9. Strain network in transverse crevasse region, Meserve Glacier, 1966–67.
Principal strain-rates for the three compound diamonds show a consistency, although for the second net the strain-rate spanning crevasses is a little less than the inter-crevasse value, a condition which is not readily understood. On the other hand, regional values of strain-rate tensors show marked variation
Table I(b) shows component values of theoretical longitudinal strain-rate calculated from the terms in Equation (1). The accumulation term is positive (based on a net gain of 3.0 cm of ice year−1 in this area of the basin). The conditions for the curvature term to be valid occur at point 1 (Fig. 3). The value of bed curvature has been used and thus


Figure 10 shows cross-sections of the Meserve Glacier in the crevasse region obtained by radio-sounding equipment. Table I(b) shows computed and measured values of longitudinal strain-rates. At point 1 there is a close agreement, but as in the case of Kaskawulsh Glacier, the boundary requirements for the bending term to be valid are rarely met. Consequently calculations for points 2–5 (Fig. 3) have been omitted.
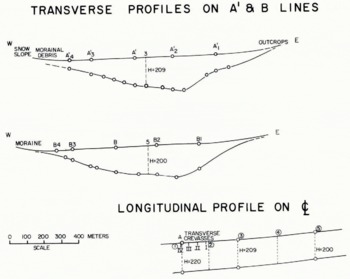
Fig. 10. Depth profiles for Meserve Glacier.
Crevasse depths. Only one crevasse (IV) (Fig. 11) could be plumbed for depth with sufficient accuracy; a value of 23.9±0.5 m was obtained. This is very similar to true transverse crevasse depth measurements on most other glaciers and is at the lower end of the range of values for Kaskawulsh Glacier. Table IV shows computed crevasse depths. Several assumptions have been made: (1) the fracture initiates at or near the surface, (2) the flow law holds for material of density less than 0.9 Mg m−3, and (3) the horizontal strain-rate is constant with depth.

Fig. 11. Morphology of crevasse IV. Meserve Glacier.
The first assumption implies that a temperature appropriate to the first few meters of firn should be used in order to compute B and n in the flow law. Reference GlenGlen’s (1955) data extend as far as −13°C, which is about the mean summer temperature of the first meter.
That the density of the material in this zone is about half that of ice may be a serious objection. Nevertheless, the ultimate depth of the fracture must depend on the density of the material below; hence a mean density (0.7 Mg m−3) over the depth d has been used. By this reasoning, the fracture, once formed at the surface, propagates to a depth d by local increase in a at the lower end of the crack as it penetrates colder ice.Footnote * Reference GlenGlen’s (1955) flow-law constants are only determined as far as −13°C and extrapolation of his graphs is of dubious validity. If this is done, then B −28 ≈ 1.35×10⁻⁵ bar−n year−1 and d ≈ 154 m Similarly B −20 ≈ 19.05 × 10⁻⁵ bar−n year−1, d ≈ 64.5 m.
Table IV Crevasse Depths, Meserve Glacier

Hence it is apparent that it is the stress distribution rather than the strain which must be analyzed in an attempt to understand the limiting depth of a transverse fracture. In using Equation (2) it is evident that one must be consistent in taking a temperature known to exist in the region where
In order to further convince oneself that the use of the strain-rate across a crevasse is inappropriate, the calculation of d is made using
-
i.
across a crevasse, and -
regional.
It can be stated that (i) gives unreasonably large values of d in this case. For crevasse IV,
Crevasse spacing. Three measurements showed values of s = 57, 60 and 66 m, and for the case of crevasse IV, s = 2.5 d, which is close to the empirical relation obtained for Kaskawulsh Glacier.
Acknowledgements
The author acknowledges assistance from the Institute of Polar Studies, and the Department of Geology, Ohio State University, also the Icefield Ranges Research Project for the work done in Canada. For the investigations in Wright Valley, Antarctica, the author acknowledges the support of National Science Foundation grants GA-205 and GA-532 to the Ohio State University Research Foundation, and the U.S. Navy.
In the field, Dr C. Bull, Mr H. Brecher, Mr F. Erdmann, and Mr L. Irwin gave much valuable assistance.
For constructively criticizing the manuscript the author is indebted to Dr C. Bull, Dr F. Loewe, and Dr T. H. Wu, Institute of Polar Studies, Ohio State University.
Appendix I
Equation (1) provides a means of analysing the factors which produce variations in the longitudinal strain-rate in a glacier. If we consider only the accumulation and the curvature terms, then for a glacier which is sliding

or

Therefore

assuming that any changes in a/h are so small as to be negligible. Dividing Equation (12) by Equation (10) we get

assuming that the accumulation rate is constant and that variations in
For the purposes of discussing the simple variation of
Thus Equation (13) becomes

Taking values of
-
,
-
,
-
,

we see that for a 10% change in the basal sliding rate, there will be a corresponding change in the longitudinal strain-rate of about 5%.
If the second term in Equation (13) is retained, then substituting the values appropriate to point 4 (Table I, p. 1 15), we obtain

Hence a 10% change in V b produces a 7.4% change in strain-rate. Such changes in basal sliding (Weertman, 1957, 1962, 1964) are not unfounded and could be exceeded in extreme cases such as surging or “catastophic advances”.
If changes in a are considered to be significant (changes in h being neglected), then we may write, assuming V b and a are functions of a common variable:

Using the values for point 4 in Table I, Equation (16) reduces to

For a 10% change in both V b and a in the same sense, there is thus a corresponding 8.4% change in
Such changes in strain-rate at a point on the glacier could be used to explain the irregularities in the spacings of crevasses. In the case of the cold glacier V b = 0; therefore, changes of
Appendix II
If we consider the flow law
for the case where
then

and assuming n to be roughly constant ≈3, then for the temperate case (Table II, p. 118)
and for the cold glacier case, taking T ≈ 260°K (Table IV, p. 125)
If in the first case a value of B appropriate to −1.5°C is taken
So if we consider that the first crevasse on the temperate glacier is formed in the winter, the mean temperature of the upper few meters will certainly be −1.5°C or less, and allowing for a small percentage change in
Appendix III
Consider a model glacier in which flow is confined to a linear channel (Fig. 12) of width 2a. If we consider only the stresses acting in the plane of the glacier, σ x , σ y and τ yx , then if we express σ y and τ y x in terms of σ x (Hill, 1950), it should be possible to plot crevasse traces on the model according to different values of σ y =α|σ x | and

Fig. 12. Plot of crevasse traces for various values of α and β, where α = σy/σx;
We may proceed with the result (e.g. Jaeger, 1962, p. 7)

where ϕ is the inclination of the principal stress axis to the center-line of the glacier (x-axis).
Now

(Hill, 1950) depending on the side constraint. At the boundary, let
where β ≤ 1/√2. For a point distance y from the center-line
where the assumption is made that the variation of τ yx across the surface is linear, in order to simplify the problem. Let
be uniform across the width for a particular value of α.
Substituting these values in Equation (17) we get


therefore

which has a maximum when ϕ=0, i.e. on the center-line.
Now

on substituting for ϕ,

therefore

For the left-hand integral put
therefore
then

or

We can now proceed to plot values of (x, y) given by Equation (18) for various values of α and β, except that there is a restriction that β > 0.
The crevasse traces are shown in Figure 12 for various values of α and β. The traces of crevasses on the Kaskawulsh and Meserve Glaciers are plotted also. For Meserve Glacier we know that σ y ≈ −σ x (Fig. 9). Therefore α ≈ −1, and taking β = 1/√2, the resulting trace falls very close to the trace measured in the field; therefore, we are led to believe that in a cold glacier the maximum boundary shearing stress is developed.
For the Kaskawulsh Glacier α = −1 as a near approximation, β just exceeds


