

1. Executive Summary
Some of the key highlights from the survey report are as follows:
Key risks
-
∙ Equity, credit and interest rates are the big three dominant risks out of our respondents, with currency and inflation being secondary in importance, as shown in particular by the proportion of undiversified capital attributed to these risks.
Dynamic hedging
-
∙ Equity and interest rates are the risks that are most dynamically hedged, with credit being the risk where a static approach is most likely.
-
∙ As may be expected, interest rates, inflation and currency are most likely to be comprehensively hedged, but not comprehensively so across all respondents. Equity and credit are risks where tail hedging approaches are most prevalent, with no stated usage of tail hedging to other risk factors
-
∙ There were a range of hedge management structures and levels of formal hedging documentation in place. However, there is not much correlation between the level of management, or extent of formal policy, and the dynamism of hedging. There also appears to be quite some variation in the comprehensiveness of hedging documentation.
-
∙ It was no surprise to see variable annuity (VA) firms typically re-assess and/or rebalance their hedges more frequently than other companies.
Equity risk
-
∙ For equity risk, equity futures are the more popular instrument, with notional shorting a popular practice amongst with-profits firms.
Credit risk
-
∙ For credit risk, prior to launching the survey we conjectured that only tail risk was likely to be hedged, with movements in the Matching Adjustment (MA) providing sufficient offset to avoid any hedging. The survey results did not support this. Whilst there were a few companies that hedged extreme measures, those that hedged credit risk universally covered credit spread movements.
Interest rate risk
-
∙ For interest rate risk, again our main conjecture proved slightly unfounded by the survey results. We asserted that interest rate risk would be viewed as an unrewarded risk, and comprehensively hedged. This was the view by most in the survey, but just over a quarter of respondents that gave detail on their hedging approach did not hedge this risk out entirely.
-
∙ For most this risk is a fairly dynamically hedged risk. Whilst variable annuity firms – as may be expected – are hedging on a daily basis, some with-profits firms were doing so too, with Bucketed PV01 being the most popular hedging metric.
-
∙ Whilst no respondents stated they were currently hedging the credit risk adjustment (CRA) in the Solvency II risk-free curve, a third said they were considering this approach.
Currency/inflation risk
-
∙ Currency risk and inflation risk approaches showed no surprises. The most popular method for currency risk hedging is rolling foreign exchange (FX) forwards, with cross-currency swaps used more on an individual bond basis. Inflation risk hedging is largely done with index-linked bonds and retail price index (RPI) swaps, with very little use of explicit options, caps or collars given the illiquidity of these markets.
Matching Adjustment
-
∙ For the MA, our view prior to the survey was that companies would use alternative metrics to the prudential regulation authority (PRA) suggested compliance metrics in making hedging decisions for their MA portfolio. All those respondents providing information, did indeed say they were using an additional PV01 duration metric in conjunction with some of the PRA metrics. The PRA statistic 1 was the PRA metric of least importance in making hedging decisions.
Response to the Global Financial Crisis
-
∙ Finally, we asked companies about their responses to the Global Financial Crisis. The general consensus from respondents was a move to more hedging and more dynamism in their hedging, rather than less. Collateralisation of hedging increased too, which would make sense given the new regulations such as the European Market Infrastructure Regulation.
2. Introduction
2.1. Objectives
The Dynamic Hedging Working Party was established to examine different approaches to asset liability management (ALM) in dynamic hedging strategies in order to make recommendations for ALM best practice, in particular:
-
∙ rationale for hedging (practicalities, value);
-
∙ regulation (i.e. Solvency II and MA).
The survey aims to provide insight into how the UK life insurance industry approaches the hedging of its market risks.
2.2. Survey Methodology
The data for this survey was collected through a survey that was sent out to respondents for completion in the second half of 2015. The survey was sent to the ALM departments of most major life insurers in the United Kingdom. We attempted to keep the length of the survey reasonable and hope it was not too onerous to complete. We are grateful to those who took the time to contribute to the results.
In the interests of data protection and commercial confidentiality, individual responses have been treated with strictest confidence. For the purpose of this report, all results have been presented in an aggregate format or have been made anonymous.
The structure of the survey was designed to capture the key risks that are faced by life insurers in the United Kingdom and the various approaches in place to mitigate these risks. It was also intended to capture the governance around the hedging decisions and to what extent these were taken dynamically. A section on the MA portfolio management was included as it has become an important area of focus for UK annuity writers during 2015.
In designing the survey questions, we had a number of conjectures on what insights we might expect to see, in particular when comparing approaches from different company types. We highlight these conjectures in pop-out boxes throughout the report, and describe the extent to which the survey data support or refute these conjectures.
2.3. Survey Results
The survey was sent to a sample of UK life insurers, designed to include, but not restricted to, the largest firms and to provide a range of insurers with different liability profiles. The response rate is considered healthy for this type of survey, although the response rate alone does not convey the representative nature of the survey. The responses have been from firms of varying sizes which operate a wide variety of product offerings in the United Kingdom. When presenting our analysis, we have also included the context of our findings, by including a profile of respondents.
3. Respondent Profile
Our survey received participation from a wide spectrum of respondents (16 responses in total) ranging from small to large businesses in terms of their in-force liabilities. We have categorised respondents by size of their Solvency I insurance liabilities.
Throughout the survey we use the following definition when referring to the size of the respondent:
Small: Solvency I insurance liabilities less than £1bn
Medium: Solvency I insurance liabilities more than £1bn, but less than £5bn
Large: Solvency I insurance liabilities more than £5bn (Figure 1).
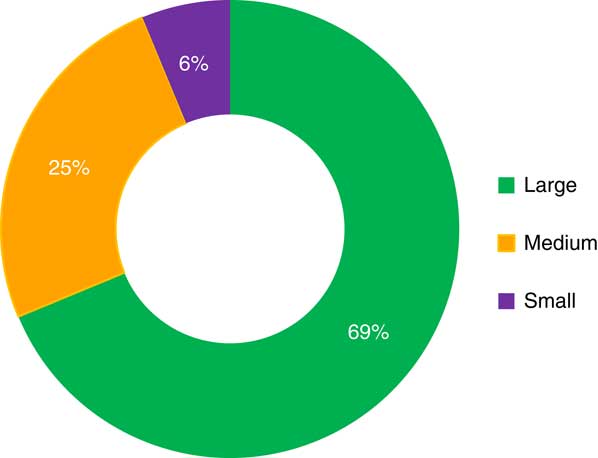
Figure 1 Size of respondents
Most survey respondents were UK realistic reporting firms (Figure 2).
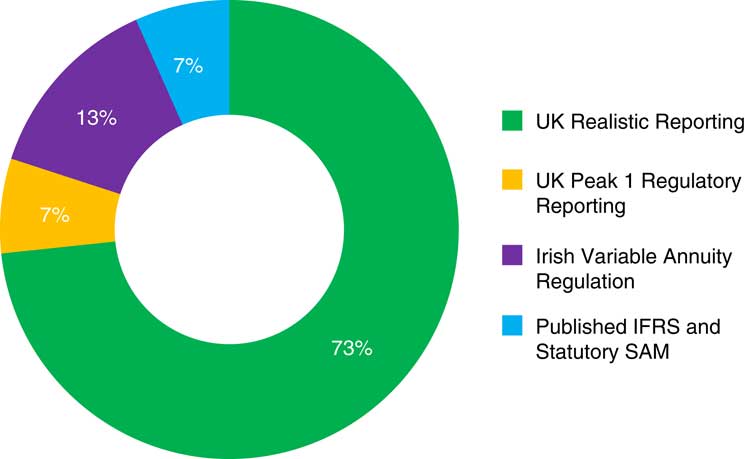
Figure 2 Regulatory treatment of respondents; statutory SAM is assumed to mean Statutory Solvency Assessment and Management; IFRS, international financial reporting standards
3.1. Products
With-profits and fixed annuities were the most common products offered by respondents. There was also a broad range of other products (Figure 3).

Figure 3 Products offered by respondents; DB pensions, defined benefit pensions
4. Key Risk Exposures of Respondents
Of the 16 survey respondents, all but one are materially exposed to interest rate risk. Equity and currency risk came a close second, with 13 respondents each facing this risk. For inflation and currency risk, fewer quoted these as a material risks and any materiality was mostly regarded as low (Figures 4 and 5).

Figure 4 Material risk exposures
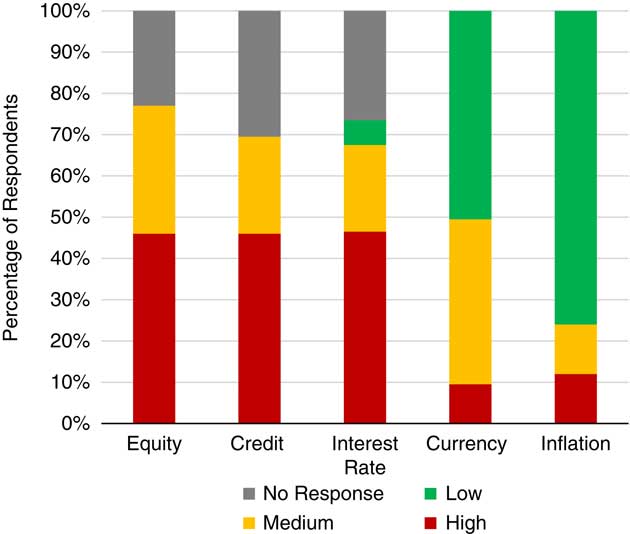
Figure 5 Materiality of risk exposures
Figure 6 gives an indication of the materiality of each risk averaged across all respondents as measured by undiversified risk capital. Equity and credit risk attract the most capital on average, followed by interest rate and currency risk. The picture is similar when we look at capital post-diversification. It should be noted that capital requirements are only one measure of the materiality of a risk as they only measure the impact on net assets, rather than surplus.
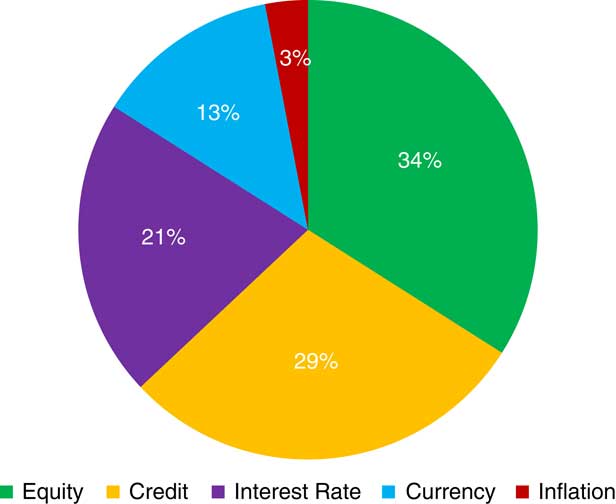
Figure 6 Total undiversified capital for each risk as a percentage of total undiversified market risk capital for all respondents
Survey respondents stated how material undiversified ICA capital requirements for each risk factor were, according to some defined ranges of materiality. Using this data, we assumed capital was at the middle of the defined range, and aggregated across all respondents, before then calculating a percentage share of the total for each risk factor.
5. How Dynamically Do You Hedge?
We asked about the level of dynamism used for hedging each risk factor, ranging from “dynamic” to “semi-static” to “static”. We also asked whether there was a comprehensive, tactical or tail-based focus to the hedges. Responses below are expressed as a percentage of those that view the risk as material.
Interestingly, aside from credit, most hedges are viewed as “dynamic”, which underlines the merit of our focus as a research working party.
Equity risk is most likely to be dynamically managed. For credit risk, static hedging is predominant. For other risks, there is a degree of semi-static management that is mostly driven by when the hedge needs to be rolled; however, dynamic hedge management is most popular (Figure 7).
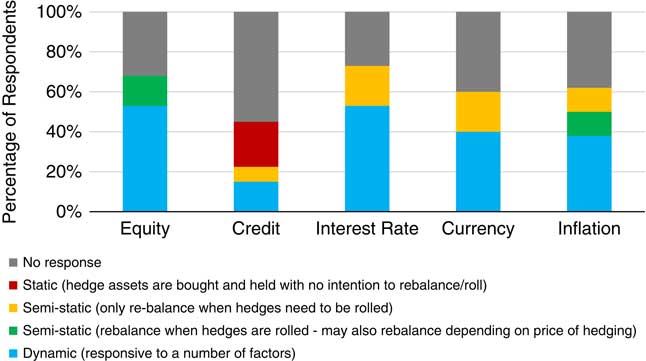
Figure 7 Hedging dynamism
For equity and credit risk, a large proportion of respondents are taking a tactical view of the market on cost of hedging. These risks also see some use of tail hedging techniques.
For interest, currency and inflation risks, a more comprehensive hedging approach is typically taken with the main effort being to neutralise the risk. However, a degree of tactical hedge decision making is applied by some (Figure 8).
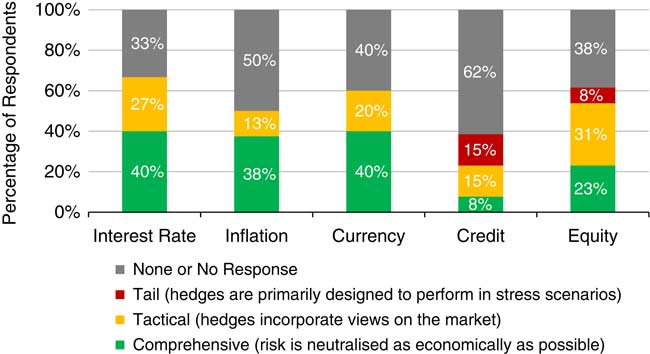
Figure 8 Hedging philosophy
A few more observations on these results:
-
∙ In all, 11 companies provided at least a partial response to this question.
-
∙ Two out of the 11 companies said they comprehensively hedged for all risks. Both of these were large companies (one with-profits and one VA).
-
∙ Two out of the 11 companies said tail or tactical hedging for all risks – again both were large companies (one with-profits and one with a mix of products).
6. Hedging Policy
CONJECTURE (1): One of our aims as a working party is to determine dynamic hedging best practice. We conjectured that there may be some companies where hedging decisions are made at lower levels of management, enabling hedging to be more dynamic.
We asked a number of questions on the hedging policy documents and the governance structure, and there was little significant correlation seen between the size of company, the delegation of hedging decisions and the degree of dynamic hedging.
The four companies that stated that they do not have a formal dedicated hedging policy document sign-off hedging decisions at a higher level than those with a formal document. This could suggest either that the senior level of governance prevents the need for red tape, but could alternatively suggest that some companies may be acting inefficiently, with senior management getting involved with decisions beneath them.
Companies that answered that the risks were not well understood were also those that required Board approval, and had less explicit hedging policies. Half of these companies also said that the risks are not significant enough, suggesting there is scope for greater delegation of hedging.
Finally, we noted that companies that hedge the tail also have a more explicit hedging policy.
6.1. Hedging Policy Documentation
We first asked whether companies had a formal hedging policy document in place. Less than half had a comprehensive document covering all hedges within the company. For those that did not most had some form of documentation – either covering most hedges, or a strategy outlined in another formal document. There was only one respondent without any hedging policy documentation, and one where this was work-in-progress (Figure 9).
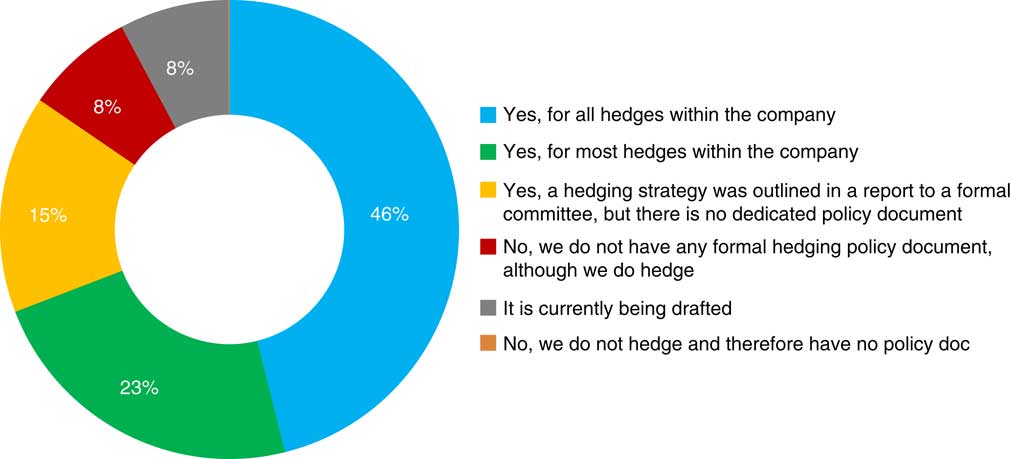
Figure 9 Hedging policy document existence
However, for many hedging policy documents it is not clear from our data how comprehensive are these documents. The “risk factors to be hedged” is the only feature common to all hedging policy documents amongst respondents. Many items that one might expect to see as best practice within a hedging policy document did not feature in some responses.
An interesting point to note is that the level of detail in the hedging policy document does not appear to be correlated with the size of company. We might have expected larger companies to have more explicit hedging policy documentation. However, this is not supported by the survey results.
The variable annuity providers had more explicit policies, in keeping with the more sophisticated techniques used (Figure 10).
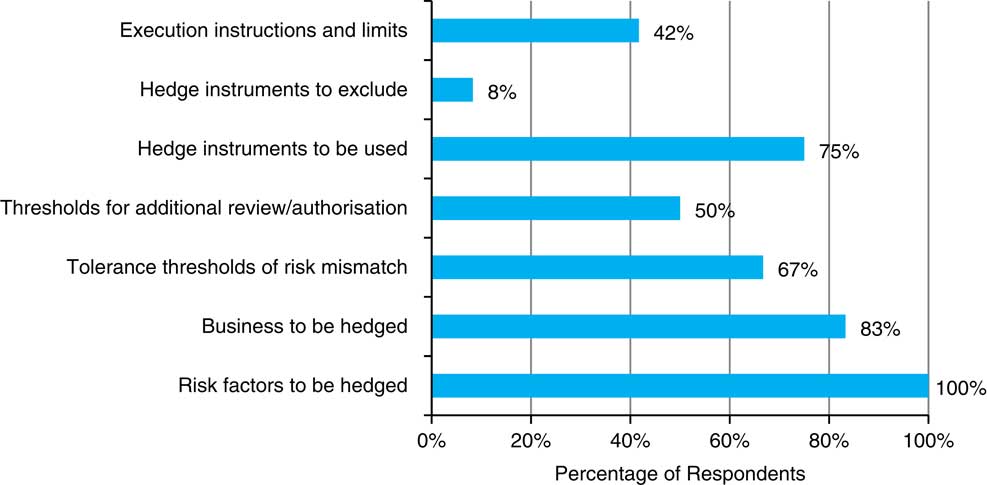
Figure 10 Hedging policy document scope
6.2. Hedging Process Management
We looked at the function that undertakes each step of the hedging process. As you might expect, hedging recommendations are typically made at a less senior level than hedging approval decisions. In turn, these approval decisions are typically made at a less senior level than approval of changes to hedging policy.
There appears to be a range of delegation within insurance companies. In one outlier, the Board is involved with recommending hedging decisions. In some small limited cases, approving hedging decisions do not reach any formal committee.
For the most part, hedge decision approval is undertaken at committee level. For half of respondents management committees also approve changes to hedging policy, without any requirement for this to go before the Board.
As we might expect, it is the ALM functions and ALM committees where hedging activity most often resides within a company. The risk functions and risk committees appear to have much less involvement, despite hedging objectives generally being about the management of market risk. We are conscious, however, that the ALM and risk committees may be “roses by other any name” with different naming conventions across companies (Figure 11).
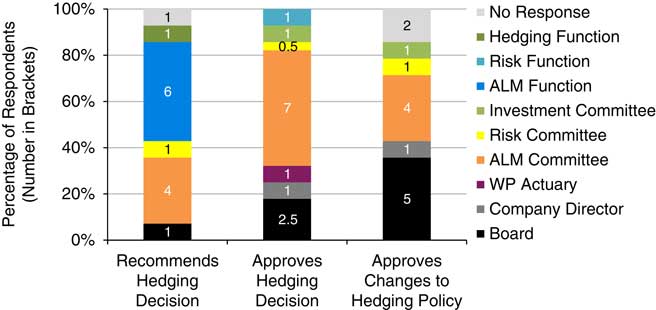
Figure 11 Seniority and function of hedging process; ALM, asset liability management; WP, with profits
6.3. Hedging Restrictions
No company gave 100% discretion to the hedging manager for any particular risk factor. Some companies do give discretion to hedging managers, subject to the limits of the hedging policy document – incrementally more so for unrewarded risks of rates, currency and inflation (Figure 12).
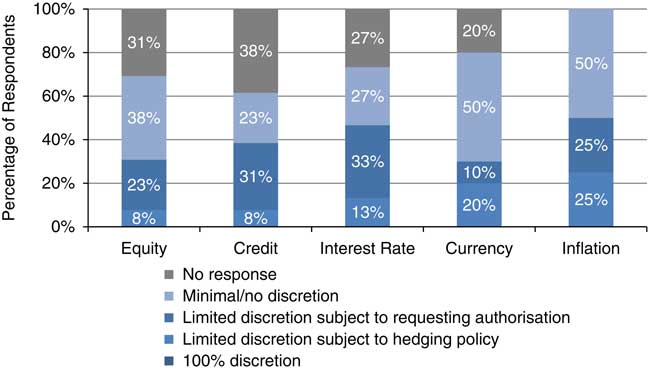
Figure 12 Hedging discretion (as % of those with material risk)
A number of respondents had restrictions on the type of instrument that could be used for a variety of reasons including regulatory restrictions, modelling limitations and lack of asset management capabilities. For quite a wide range of instruments there were a small number of companies in each case that were restricted. We could not see any discernible pattern with there being restrictions for each type of asset exposure – currency, equity, credit and interest rates – and for derivatives both with and without optionality (Figure 13).
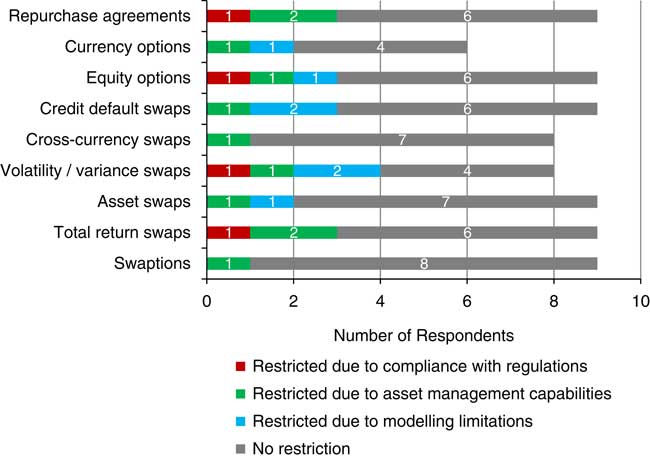
Figure 13 Instrument restrictions
6.4. Drivers of Changes to Hedging Policy
We asked respondents what the strongest drivers of change to hedging strategy are and the results are shown in Figure 14. First, it should be borne in mind that the survey took place in late 2015 (immediately prior to Solvency II implementation) when many companies would have been in a state of transition.
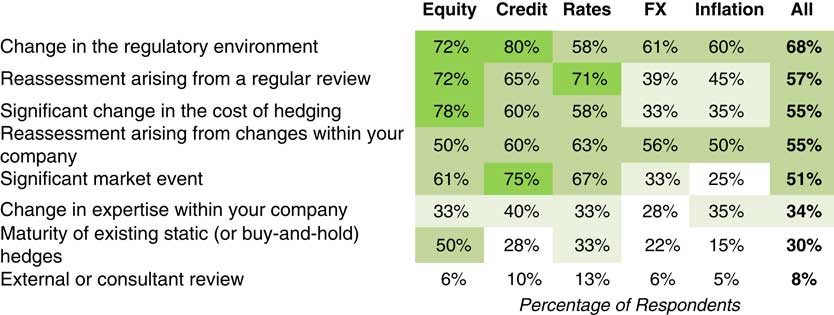
Figure 14 Drivers of changes to hedging policy; FX, foreign exchange
As might be expected, the regulatory environment was the greatest push factor. It is interesting to note that regular reviews are also a significant driver, suggesting that there is not necessarily a “keep in the drawer” solution.
The following graph provides a heat map presentation of results. For each company response we assigned the following weights:
-
∙ 100%=“likely” to “explicit”
-
∙ 50%=“maybe”
-
∙ 0%=“no”
The table then gives an average weighting for each reason, both as a total, and also split by risk factor.
6.5. Variable Annuity Firms
CONJECTURE (2): VA firms monitor hedging more dynamically than conventional life funds with pre-emptive actions planned and documented in dealing with emerging financial risks.
Four respondents stated that they have variable annuity business. These companies rebalance their hedges more frequently than the other companies, so we think this hypothesis is well supported.
6.6. Acceptance of Risk
We asked companies why they would be willing to accept risk with the following responses (Figure 15):
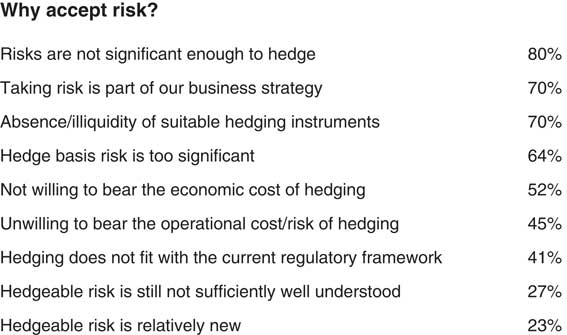
Figure 15 Reasons for accepting risk
Companies that answered that the risks were not well understood were also those that required Board approval for hedges and had less explicit hedging policies. Only half of these companies answering also answered that risks are not significant enough suggesting that there is scope for greater delegation of hedging.
7. Hedging by Risk Factor
CONJECTURE (3): Where equity risk is hedged there is a tendency for variable annuity providers to use futures/options and for notional shorting to be used by with-profits firms.
Of the six with-profits companies that responded, four used notional shorting with three of these in conjunction with futures. The three companies that used variance swaps or total return swaps were all variable annuity providers.
7.1. Equity Risk
For those respondents that hedge equity risk there is roughly a 50:50 split between those that choose to only delta hedge and those that additionally hedge “second-order” Greeks.
For second-order hedging, it is typically a combination of both vega and gamma that is used. It may be that only one of these is the defined hedging measure, with the other being hedged implicitly as a result. There is a slight bias towards vega – that is exposure to movements in volatility – as the preferred second-order hedging measure.
These results are consistent also with typical practice in the variable annuity industry, which are some of the most active/dynamic hedgers of equity risk.
Those that regarded equity risk as material were equally likely to be delta only hedgers as those that hedge the second-order impacts. Those that regarded equity risk as of medium materiality were more likely to hedge gamma/vega. Although not statistically significant this can suggest that the size of risk is not necessarily correlated with the potential change in the size of risk (Figure 16).
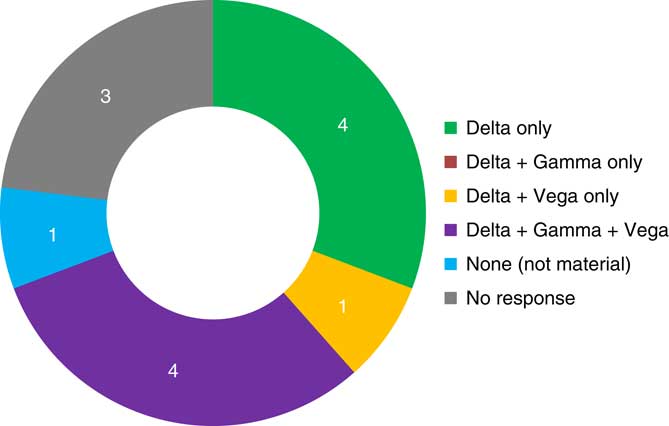
Figure 16 Equity “Greeks”
Equity futures are the most popular choice of instrument, with equity options and notional shorting (by with-profit companies) also being popular (Figure 17).
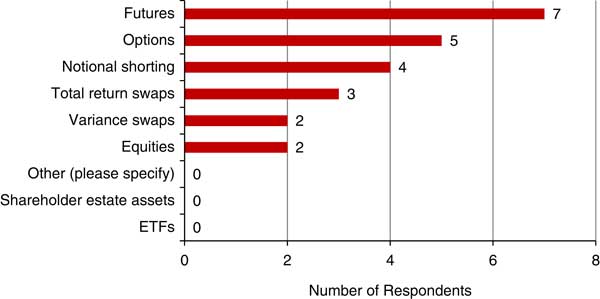
Figure 17 Equity instruments; ETFs, exchange-traded funds
Of the six with-profits companies that responded, four used notional shorting with three of these in conjunction with futures.
7.2. Credit Risk
CONJECTURE (4): Credit risk hedging is limited to tail risk for annuity business as the MA should capture spread movements.
This does not appear supported by the results. Of the 13 companies who said they had material credit risk (six of them related to annuities) five companies responded to say they did some form of credit risk hedging. Four of these companies had annuity business, but one was a pure with-profits firm. Universally they all hedged credit spread movements whereas only a small number of firms said that they hedged other more extreme measures such as tail risk or extreme spread movements.
The main findings for credit risk are:
-
∙ Surveyed companies have a material exposure to credit risk.
-
∙ Risk is mostly not hedged or is managed within with profit funds via notional shorting.
-
∙ Hedge is defined as tactical or tail.
-
∙ Target of the hedging are credit spread movements and defaults.
-
∙ Single name and index credit default swaps (CDS) are used.
In total, 11 companies said they had material credit risk with eight providing details about their hedging strategy.
Only four of these companies said they did some form of credit risk hedging with one additional company using notional shorting. The more complex derivatives (tranche protection and credit option strategies) are used by companies who are hedging tail risk or extreme spread movements (Figures 18 and 19).
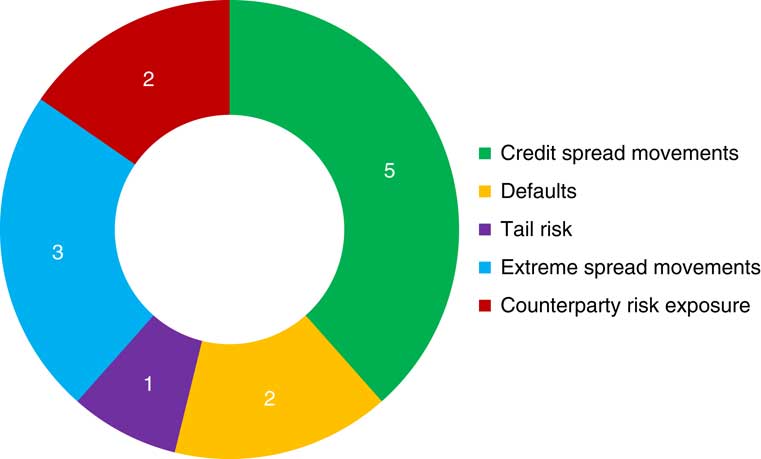
Figure 18 Credit risk hedging (number of respondents)
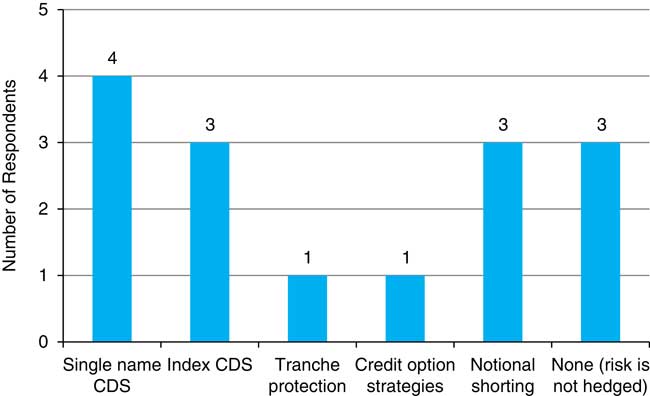
Figure 19 Credit instruments; CDS, credit default swaps
7.3. Interest Rate Risk
CONJECTURE (5): Interest rate risk is seen as an unrewarded risk and hedged out completely.
All 14 companies said they are materially exposed to interest rate risk and 11 companies provided details about their hedging strategy
All of them hedge the risk. Seven said their interest rate risk hedging was comprehensive, whilst four companies said this was tactical in nature.
Given that slightly over a quarter of the companies that responded have some tactical element to their interest rate hedging, it is by no means a risk that is universally seen as unrewarded. However, comprehensive hedging is the predominant choice, so this is a view held by many.
The main findings for interest risk are:
-
∙ All companies are exposed to interest rate risk, most of them considering it a material risk and having medium or high exposure.
-
∙ All companies hedge interest rate risk in some measure.
-
∙ Most companies have a dynamic hedging programme in place. Companies selling variable annuities are all in this group while companies selling with-profits have a more static approach.
-
∙ Rebalancing happens daily or even intraday for almost half of the companies.
-
∙ All companies hedge duration and some also hedge convexity and volatility. Cash flow hedging is also used by both annuity and with-profit companies.
-
∙ Bonds and swaps are the most popular instruments used to mitigate the risk. Swaptions are also widely used.
Most companies have a dynamic hedging programme and these are mostly companies with a high exposure to the risk (Figure 20).
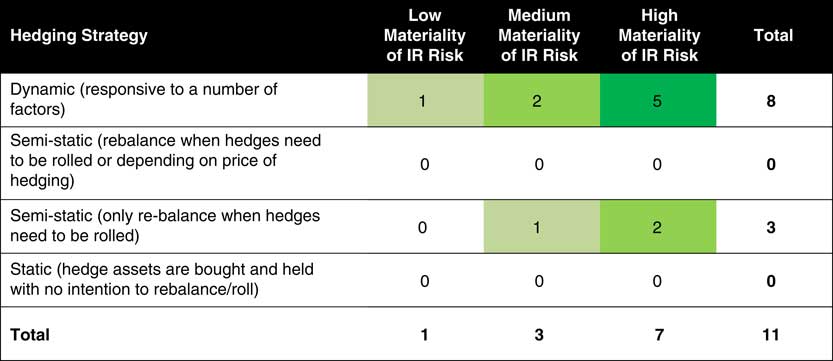
Figure 20 Hedging strategy versus materiality of interest rate (IR) risk
The frequency of the rebalancing of hedges was not uniform with most companies hedging at least monthly. As expected, one driver is the type of product with companies with a variable annuity business hedging more frequently and companies with a with-profits business less frequently. Those hedging semi-statically were the companies with a with profits business (Figure 21).
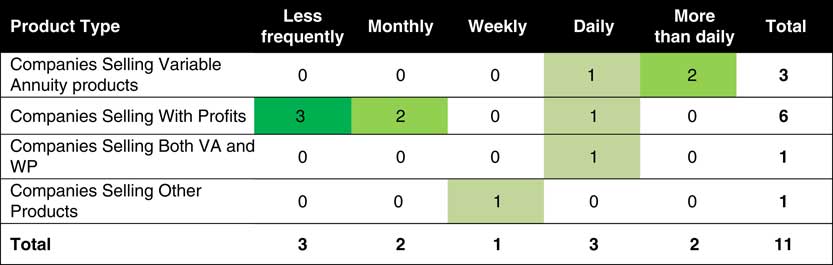
Figure 21 Product type versus hedge monitoring frequency; WP, with profit
The hedging target for all companies includes duration. This is monitored mainly using bucketed sensitivities (PV01 term structure). Convexity is hedged by only three of the 11 companies. Two with-profit firms also hedge interest rate volatility through the use of swaptions.
Cash flow matching is only used by three companies. Interestingly, at the time of the survey not all annuity companies looked at cash flow matching. This was unexpected given the requirements for MA portfolios (Figure 22).
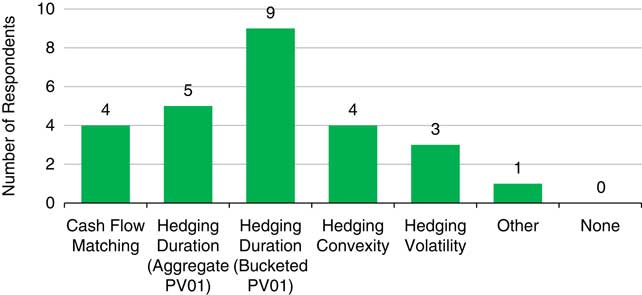
Figure 22 Methods of hedging interest rate risk
Bonds, swaps and swaptions are the most popular instruments used to hedge interest rate exposure with most companies using a combination of these (Figure 23).
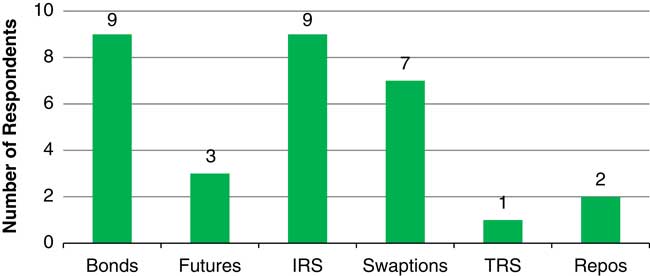
Figure 23 Interest rate hedging instruments used; IRS, interest rate swaps; TRS, total return swaps
7.3.1. Solvency II and CRA
Five companies out of 11 expected Solvency II to have an impact on their hedging approach. The most common issue is the different sensitivity of the balance sheet under SII, in particular, to interest rates. The Ultimate Forward Rate and the use of swap rates for discounting were also mentioned as a reason to rethink the approach.
Of the companies who responded to the question none are currently hedging the CRA in the risk-free curve. A few companies were considering setting up a hedge for the spread between swap and SONIA curve (Figure 24).
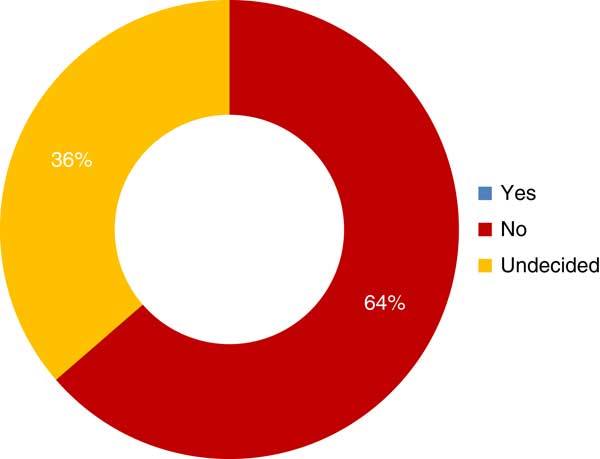
Figure 24 Companies hedging the Solvency II credit risk adjustment
7.4. Currency Risk
CONJECTURE (6): FX is hedged mainly using rolling forwards. Where cross-currency swaps are used, hedging is done at bond level.
This is supported by the results. For two out of three using cross-currency swaps they were at bond by bond level
The main findings for currency risk are:
-
∙ Exposure to currency risk is relatively low for most firms.
-
∙ Hedging is mostly dynamic with daily or weekly rebalancing for most firms.
-
∙ All companies except one use FX forwards to hedge their exposure. Cross-currency swaps and FX futures are also used.
-
∙ Companies do not consider cross-currency basis to be an issue. They have small exposure to the risk or have other mechanisms to absorb it.
In total, 10 out of 14 companies are exposed to currency risk and eight provided details about their hedging strategy. Most of them consider their exposure to be medium or low, with only one company selling annuity products with high exposure to the risk. Hedging is mostly dynamic with five companies hedging at least weekly. Two companies have a less dynamic approach and hedge only monthly or even less frequently.
Rolling FX forwards (seven responses out of eight) are the most popular instrument for hedging credit risk with futures (three) and cross-currency used to a lesser degree (four). Even when cross-currency swaps are used this seems to be in conjunction with FX forwards. It is interesting that in the absence of any regulatory push the preferred method of hedging is via a rolling programme (Figure 25).
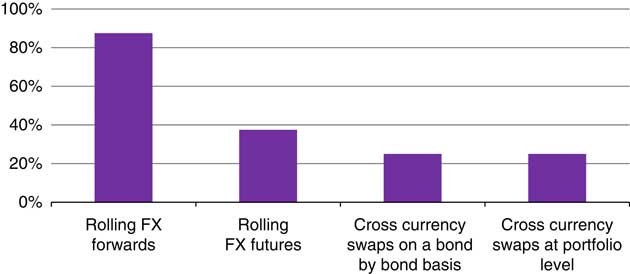
Figure 25 Methods of hedging currency risk
Most companies do not consider currency basis risk in their hedging programme. Of the three companies who consider it, two have a mechanism that would absorb the volatility generated by the movement in the basis (liability discount rate or hedge accounting). The other does not consider it to be material (Figure 26).
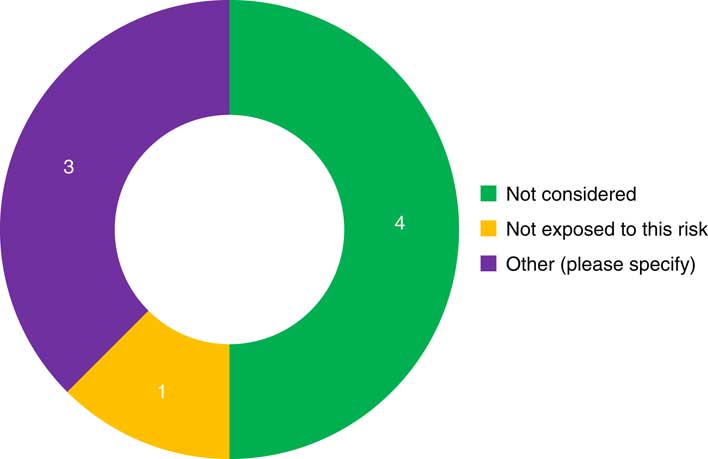
Figure 26 How companies manage cross-currency basis risk
7.5. Inflation Risk
CONJECTURE (7): Inflation risk is not closely hedged (many companies do not hedge it at all). The main instruments used are RPI swaps and index-linked gilts. Additionally, underlying inflation options not hedged due to market illiquidity.
The results of this survey certainly seem to support this conjecture. One-third of those responding do not hedge inflation risk. Those that do largely use index-linked bonds or RPI swaps. One company reported usage of options/caps/collars.
The main findings for inflation risk are:
-
∙ Exposure to inflation is low for most surveyed companies.
-
∙ Hedging is done less frequently than monthly by most firms.
-
∙ Exposure is measured mostly with term structure sensitivities (IE01 by term).
-
∙ Bonds and swaps are used to reduce the risk.
-
∙ Inflation optionality is delta hedged in all cases apart from one company who is using limited price indexation (LPI) swaps.
Most surveyed companies have some exposure to inflation risk (seven out of 11) but do not hedge as closely as for interest rate or FX risk. Hedging is less dynamic and less frequent than interest rate risk with only three companies (out of seven who hedge the risk) hedging dynamically and only two companies hedging at least weekly. The most common type of product that is inflation linked is annuities.
Exposure to inflation is usually measure in terms of IE01 per bucket. One company relies solely on cash flow matching. One company also uses a top-down approach in conjunction with IE01 (Figure 27).
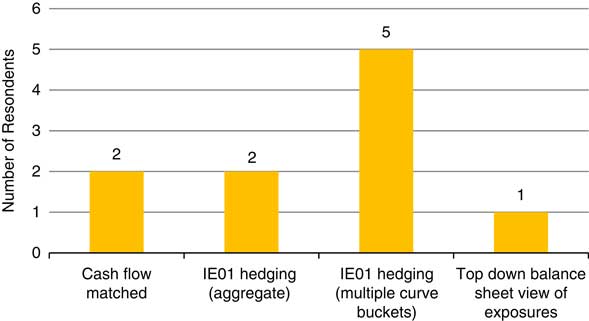
Figure 27 Methods of hedging inflation risk
Participants mainly use government bonds and swaps to hedge the risk (Figure 28).
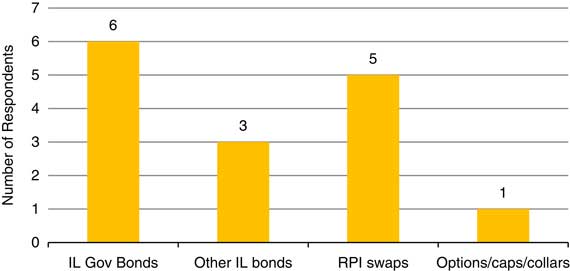
Figure 28 Inflation hedging instruments used; IL, inflation-linked
Four respondents have material inflation linked options. Of these, only one hedges the risk using LPI swaps. The other three companies delta hedge the risk with RPI linked instruments. None of them uses inflation options.
We see no respondents explicitly using inflation options to achieve cap/collar strategies (e.g. to directly match RPI(0,5) liabilities). This confirms what we might expect given the illiquidity/cost of this market (Figure 29).
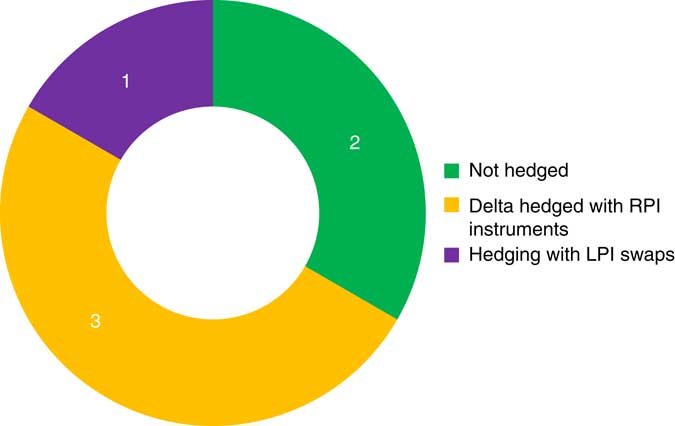
Figure 29 How are inflation options hedged? LPI, limited price indexation; RPI, retail price index
8. Solvency II
We asked “Will hedging approaches change under Solvency II?” As expected, interest rate risk and credit risk were most likely to prompt a change. The introduction of the risk margin adds additional interest rate sensitivity to insurance company balance sheets, and the MA requirements has disrupted existing credit risk management approaches. However, most risk companies did not anticipate any further changes. It may be that by the time of responding to the survey any required changes had already been put in place (Figure 30).
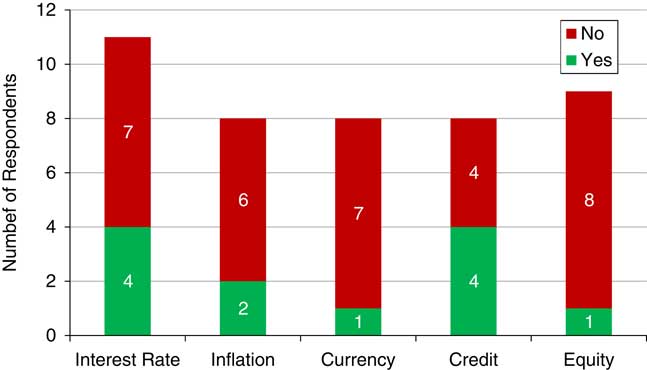
Figure 30 Change to hedging approach under Solvency II
8.1. Matching Adjustment
CONJECTURE (8): Alternative metrics to the PRA suggested MA portfolio compliance metrics are used in making the hedging decisions for the MA portfolio
All companies with MA portfolios are using an additional PV01 duration metric in conjunction with the metrics suggested by the PRA. Surprisingly two out of four companies did not indicate that they use the PRA statistic 1 where a hard limit of 3% has been imposed. We interpret this to mean that this metric is not the primary driver of decision making rather than it not being monitored.
Six companies have one or more MA portfolios. We have investigated their approach to hedging of risks within the MA and how they approached the management of the cash flow matching requirement (Figure 31).
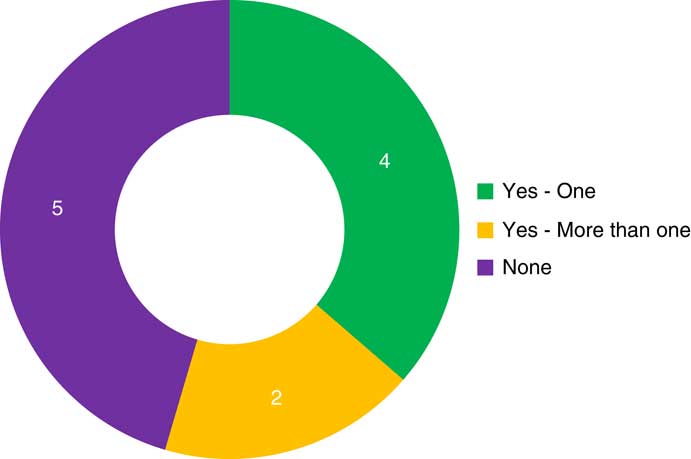
Figure 31 Do you hold a Matching Adjustment portfolio?
There was no consensus on how frequently the MA hedges will be rebalanced. The approaches range from as frequent as weekly, to quarterly, or even taking an event-driven approach. We would expect that MA hedges would tend to be rebalanced less frequently than for other portfolios due to the overarching “buy and hold” management ethos. An event-driven approach might be expected to include the addition of new business to the MA fund or relevant matching statistics reaching a certain threshold (Figure 32).
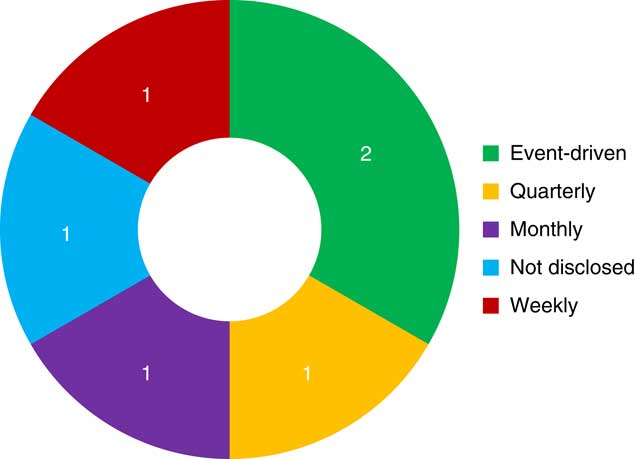
Figure 32 How frequently do you intend to rebalance the hedges within the Matching Adjustment portfolio?
PV01 sensitivity is the most common approach to measure the cash flow mismatch in the MA portfolio. As we can see from the table the measures are used in combination by four companies (two preferred not to disclose the metric used). Surprisingly two companies do not use the two metrics with a hard PRA limit (Tests 1 and 2), where compliance is specifically required from the PRA. However, we interpret this to mean that these metrics are not primary drivers of decision making, rather than something that is not monitored and adhered too. The PRA Tests are described in more detail in the Appendix (Figure 33).
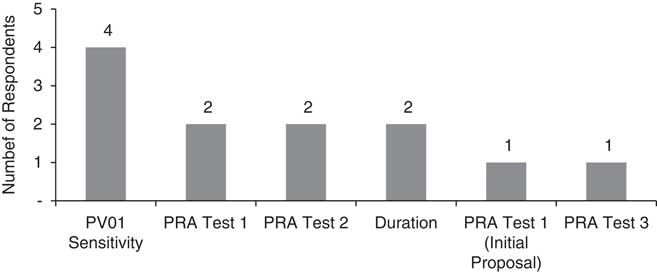
Figure 33 What metric are you using to measure the extent of any mismatch and hence the need to rebalance? PRA, prudential regulation authority
No respondents stated that they would be changing their inflation hedging approach due to the MA. Four large respondents have said they already hedge it sufficiently, one medium-sized respondent does not consider it a material risk.
Three respondents hedge within each MA portfolio separately, one hedges multiple MA portfolios together in aggregate. Similarly, three respondents hold derivatives within each MA portfolio separately, one holds them for multiple MA portfolios together in aggregate (Figure 34).
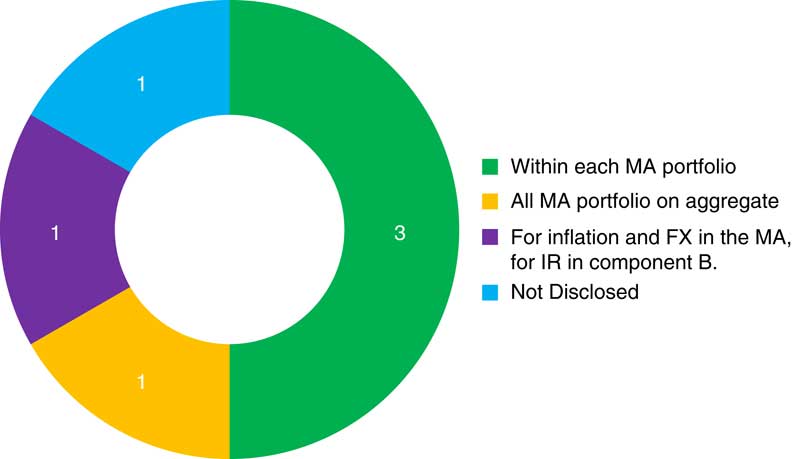
Figure 34 Where do you hold the derivatives to hedge the risks of the Matching Adjustment (MA) portfolio? FX, foreign exchange; IR, interest rates
Two respondents hold collateral for derivatives in each MA portfolio separately, one holds collateral for multiple MA portfolios together in aggregate (Figure 35).
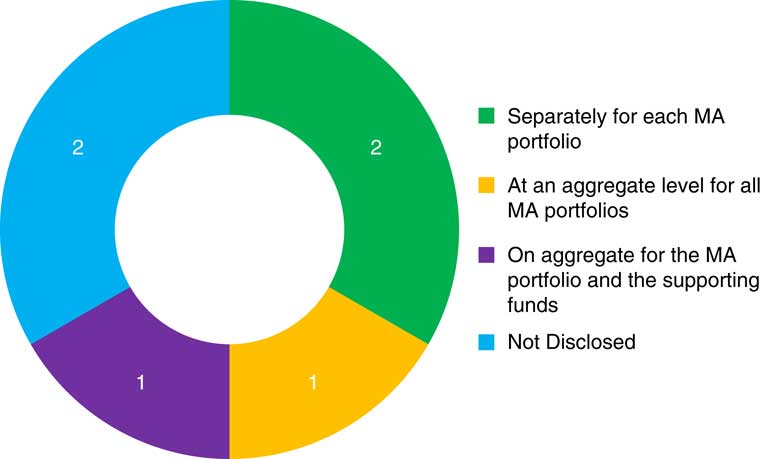
Figure 35 How is collateral managed for derivatives in the Matching Adjustment (MA) portfolio?
Three out of four respondents who hedge FX risk use cross-currency hedging at an individual bond level in their MA fund. Only one company has taken a different approach and uses a cash flow hedging at portfolio level. This might imply that a more frequent rebalancing exercise might be necessary whenever a bond in foreign currency is traded.
It is interesting to compare to Figure 25. When considering currency hedging for wider insurance business, outside of the specific MA fund requirements, rolling FX forward is the most popular currency hedging method. The absence of any rolling FX forward approach from MA fund hedging, is a direct consequence of guidance from the PRA in their letter of 28 March 2015Footnote 1 . In their view, the usage of FX forwards to hedge non-sterling bond exposures does not provide a fixed cash flow (as defined by Article 77b(1)(h) of the Solvency II Directive), and consequently they do not envisage circumstances in which these assets would meet the eligibility criteria for the MA (Figure 36).
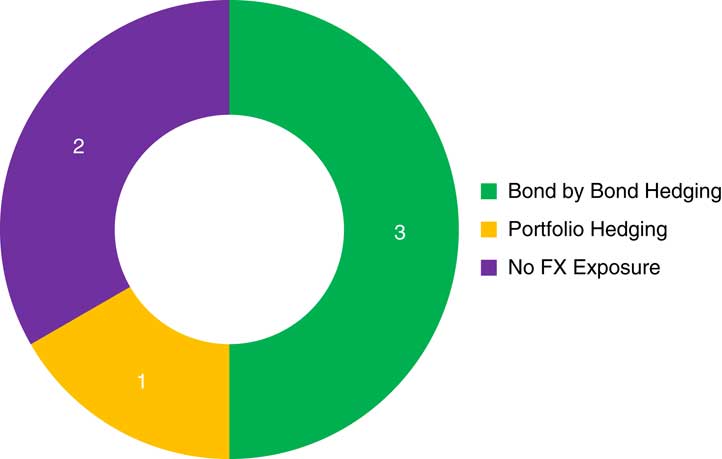
Figure 36 What is your view on cross-currency hedging under the Matching Adjustment? FX, foreign exchange
9. Extreme Events
We asked companies what they changed as a result of the Global Financial Crisis. In the responses below it is interesting that most companies improved their hedging policy, although companies willing to address risks as they arise also tended to be those companies that were less likely to have amended their policy as a result of the previous crisis (Figure 37).
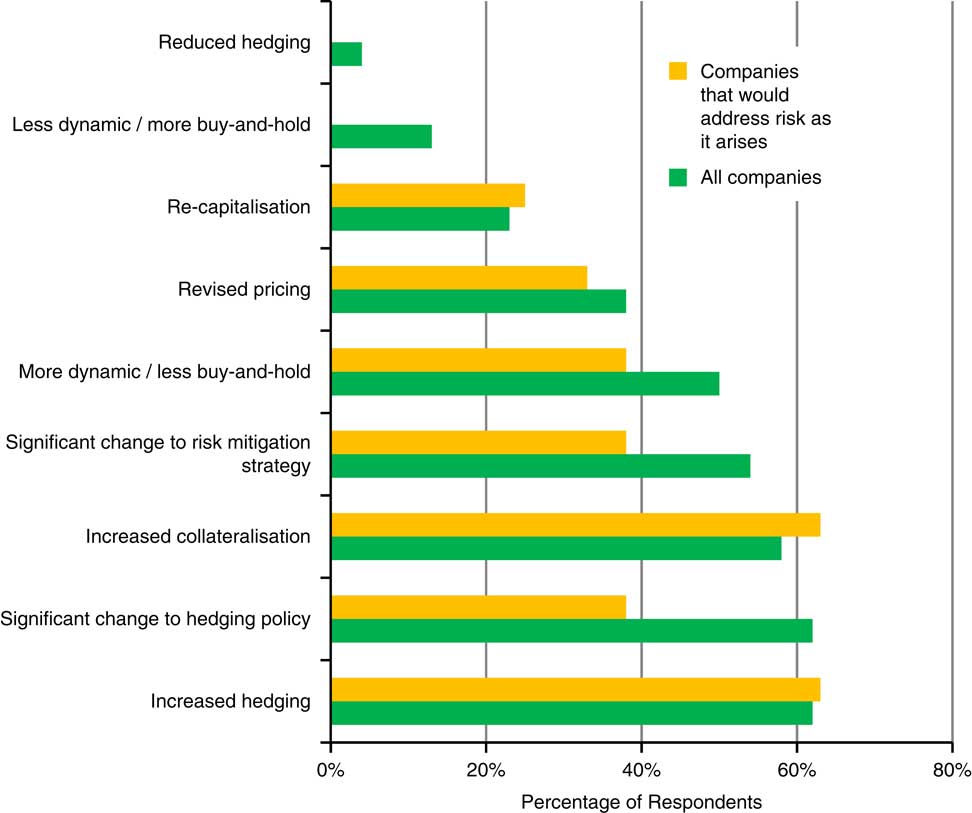
Figure 37 Approach to dealing with the Global Financial Crisis
We then asked companies what they would now change in any economic crisis:
-
∙ Two companies declared they were hedging at the tail.
-
∙ One uses daily dynamic hedging to hedge.
-
∙ Three did not have full hedging but would be able to bear the impact.
-
∙ Two would use management actions to pass on risk.
-
∙ Three respondents stated that they would deal with a crisis as it arose.
10. Next Steps
We hope that this survey report provides a useful insight into the current usage of hedging within the UK life insurance industry. Dynamic hedging strategies are themselves dynamic, and we see a number of reasons on the horizon that may lead to more substantive change to hedging practices in the industry going forward.
It is fair to say that in the run up to 2016 much of the industry was focussed on preparing for the long awaited implementation of Solvency II. Now that the regulatory landscape has settled, more focus may now turn to how to optimise balance sheet risk management in light of this.
Furthermore, many in the industry are also trying to digest and respond to the major pension market reforms, with a much greater proportion of retirees now seeking to remain invested in their assets for longer, but consequently also being exposed to a great deal more market risk. New product innovations for this market are likely to require more sophisticated risk management and hedging approaches to meet this challenge.
Finally, we release this survey after the United Kingdom has voted to leave the EU, with the consequences hanging in the balance and the potential for distinctly different economic outcomes than we have now.
With this backdrop of change, we see continued reason to both monitor changes in hedging practice as well as attempt to stimulate debate, and where appropriate encourage change, by identifying potential adaptions to current hedging approaches that could be advantageous in this changing world. Watch this space for further developments from our working party.
Acknowledgements
The authors are grateful to the anonymous respondents who responded to the survey. We are also grateful for contributions from Paul Fulcher and the help provided by Jennifer Chapin and Mairi Russell at the Institute and Faculty of Actuaries.
Appendix: PRA Matching Adjustment Tests
PRA Test 1 (Discounted Accumulated Cash flow Shortfall test)
-
∙ This test assesses the extent to which the portfolio may become a forced seller of assets to meet liability cash flows.
-
∙ The portfolio might become a forced seller when there is insufficient asset cash flow (allowing for reinvestment of surpluses) to meet liability outgo.
-
∙ It measures the ratio of:
-
o The highest accumulated cash flow shortfall from all future projection years (accumulated at the risk-free rate) and
-
o The present value of the best estimate liability cash flows at the valuation date (discounted at the risk-free rate).
PRA Test 2 (Solvency Capital Requirement (SCR) Measure of Risk)
-
∙ The measure of mismatch is the ratio of undiversified SCR for interest rate, currency and inflation risk and the total best estimate liabilities.
PRA Test 3 (Notional Swap Test)
-
∙ This test assesses how much the MA would change if all surpluses or shortfalls in the net cash flows were eliminated. The level of mismatch is the proportion of the assigned assets that would be required to eliminate any shortfall. This is equivalent to the impact of using a notional swap to produce a perfectly matched position.
-
∙ This test prevents you from simply adding extra assets in order to be within the Test 1 limits and instead encourages portfolios to be well matched.


 Open access