


1 Introduction
The architecture of a system is formed by decisions taken during the initial design stage and affects the system throughout its lifecycle. Elias & Jain (Reference Elias and Jain2017) advised that ‘a system’s architecture profoundly influences the cost and success of a system throughout the entire lifecycle and the business processes it supports’. Crawley et al. (Reference Crawley, de Week, Eppinger, Magee, Moses, Seering, Schindall, Wallace and Whitney2004) define a system’s architecture as ‘an abstract description of the entities of a system and the relationships between those entities’. Wyatt et al. (Reference Wyatt, Wynn, Jarrett and Clarkson2012) define a product’s architecture analogously as ‘a model of engineering artefact in terms of components linked by relations’. A system’s architecture (structure) realises behaviour that satisfies intended functions (Gero & Kannengiesser Reference Gero and Kannengiesser2004). The architecture decides the characteristics of the system termed also as its attributes, lifecycle properties or ilities such as flexibility, robustness, reliability and modularity, which are widely discussed in the engineering system literature (De Weck, Ross & Rhodes Reference De Weck, Ross and Rhodes2012). Different patterns of system architectures exist that can satisfy a desired function, which could be characterised by different attributes.
There are various challenges in establishing analytical and systematic approaches to formulate, analyse, evaluate and select the system’s architecture in the early stages to accomplish the desired attributes. The first challenge is the low fidelity of available information or details about the system; the second is the establishment of high-level representations to model and study them. Also, explorative design of a system’s architecture is often influenced by previous designs and intuitive expert opinions, which can cause design fixation effects (Purcell & Gero Reference Purcell and Gero1996). Additionally, the methods to perform analysis at the conceptual stages of system architectures are not quantitative (Elias & Jain 2017), and usually they examine the subsystems or specific attributes of a system (Zakarian, Knight & Baghdasaryan Reference Zakarian, Knight and Baghdasaryan2007; De Weck et al. Reference De Weck, Ross and Rhodes2012) causing them to be insufficient to manage the high-level abstraction of the system architecture and to examine the attributes of the architecture in combination. In view of the increasing challenges and complexity of modern engineering systems, network modelling and analysis is recommended in design research (Chen et al. Reference Chen, Heydari, Maier and Panchal2018). Its application is an area of research that is continuously expanding (Braha & Bar-Yam Reference Braha and Bar-Yam2004a, Reference Braha and Bar-Yam2007; Baldwin, Maccormack & Rusnak Reference Baldwin, Maccormack and Rusnak2014; Parraguez, Eppinger & Maier Reference Parraguez, Eppinger and Maier2015; Piccolo, Lehmann & Maier Reference Piccolo, Lehmann and Maier2018), contributing to the development of new solutions that address engineering design problems.
This article presents a network generator, which is incorporated into the methodology of this article, which evaluates two attributes: modularity and robustness of technical and theoretical patterns. The generator has been developed as a network tool by combining knowledge of heuristics, literature-based engineering systems and network science and can be applied to system architectures dictated by their configuration of source and sink components structured in a way to deliver a particular functionality. The generator is developed to populate directed networks with source and sink nodes enabling robustness analysis. The simulated networks have generic similarities with engineering system networks. Two naval distributed engineering systems are studied as a point of reference as they are complex robust engineering systems.
The article is organised as follows. Section 2 presents the aim and objectives of this article. Section 3 presents a literature background on the network generator, patterns and key features, assessment, modelling and metrics of system architectures. Section 4 introduces the methodology of this article and explains the modularity and robustness metrics and methods of the assessment. Section 5 presents the preliminary work on the two naval distributed engineering systems. Section 6 explains the development of the generator and Section 7 presents the application of the network generator and discusses the assessment results of various simulated networks. Section 8 presents a redesign of the original naval distributed engineering system based on the experimental findings of Section 7. Finally, Sections 8 and 9 provide reflections, limitations and conclusions.
2 Research aim and objectives
The research study reported in this article aims to develop a network tool for simulating networks, allowing experimentation with various patterns and key engineering features, as an aid in analysing and improving the robustness of system architectures in initial design stages. To achieve this aim, the following objectives are defined as guidelines for the structure of this article:
(a) Identify patterns and features of system architectures.
(b) Develop a generator into a computation tool.
(c) Define the robustness and modularity assessment metrics and methods
(d) Apply the generator to perform various experiments.
(e) Develop a redesign example based on the experimental findings.
3 Literature background
This section provides a background to the literature on the generation and assessment of system architectures. It also presents the key concepts and elements employed in the development of the novel generator. Assessment of the system architectures focus on two properties: modularity and robustness, which are subsequently discussed. Finally, network modelling is proposed as the approach to model and analyse system architectures, and network-based metrics for modularity and robustness are reviewed.
3.1 Network generators
Network science is a field that contributes to the development of generators for experimental and analysis purposes. Albert & Barabási (Reference Albert and Barabási2002) originally proposed a network model that generates scale-free networks that represent various real-world systems. In the communication-network literature, and particularly in relation to the internet, various works include network topology generators. An internet topology generator is a research tool to evaluate new application designs and system architectures and is often used in network research (Jin, Chen & Jamin Reference Jin, Chen and Jamin2000; Çetinkaya et al. Reference Çetinkaya, Broyles, Dandekar, Srinivasan and Sterbenz2011; Sterbenz et al. Reference Sterbenz, Çetinkaya, Hameed, Jabbar, Qian and Rohrer2013). The generation allows simulations and experimentations, aiding understanding and analysis of the properties of the networks, by enabling the population of alternative topologies for evaluation and comparison purposes. Besides communication systems, and the internet examples, other engineering system studies have explored the advantages of using network generation. de Vos & Stapersma (Reference de Vos and Stapersma2018) developed a generator for on-board energy-distribution systems using heuristic engineering knowledge in the context of ship distributed engineering systems.
Studies in the engineering design domain have also proposed computational network-generation approaches. Wyatt et al. (Reference Wyatt, Wynn, Jarrett and Clarkson2012) proposed a computational support method for generating new concepts through design synthesis with network structure constraints. Moullec et al. (Reference Moullec, Bouissou, Jankovic and Bocquer2013) proposed a system architecture generation using Bayesian networks. Luo (Reference Luo2015) developed a network generator to examine the impact of product architecture on evolvability. These are only some examples justifying the usefulness and utility of a generator in the context of system architectures. In line with these examples, this research proposes a novel network generator as a tool to analyse and improve robustness of system architectures. The advantages of developing a generator for the initial stages of design relate to the ability to analyse and examine the parameters of system architectures based on low fidelity of information. The key concepts that led to the development of the generator in this article are discussed in the following.
3.2 Patterns and key features of system architectures
The following sections provide a background on the patterns and key features (hub, source and sink) that led to the conception and development of the generator presented in Section 6.
3.2.1 Patterns
Alexander (Reference Alexander1964) notably identified the concept of patterns as ‘the idea that is possible to create such abstract relationships one at a time and to create designs which are whole by fusing these relationships’. Minai, Braha & Bar-Yam (Reference Minai, Braha and Bar-Yam2006) stated that ‘pattern formation is an integral part of most complex systems’ functionality’. Various studies have adopted and discussed patterns in the literature. Rivkin & Siggelkow (Reference Rivkin and Siggelkow2007) explored patterns for decision-making in complex systems and Selva, Cameron & Crawley (Reference Selva, Cameron and Crawley2016) proposed using patterns in system architecture decision-making. Hölttä-Otto et al. (Reference Hölttä-Otto, Chiriaca, Lysy and Suh2012) used patterns to study various modularity metrics, given that the degree of modularity of the various patterns could be anticipated. Min et al. (Reference Min, Suh and Hölttä-Otto2016) used engineering patterns to study structural complexity, while Sharman & Yassine (Reference Sharman and Yassine2004) discussed various patterns to characterise complex product architectures, and Yassine & Naoum-Sawaya (Reference Yassine and Naoum-Sawaya2016) employed patterns to examine architecture, performance and investment in product development networks. Baldwin et al. (Reference Baldwin, Maccormack and Rusnak2014) proposed a methodology to identify hidden patterns in system architectures that was based on directed graphs, which allows the identification of direct and indirect dependencies. In their approach, they define three fundamental key patterns: core periphery, multi-core and hierarchical (Baldwin et al. Reference Baldwin, Maccormack and Rusnak2014). For the engineering design process, Parraguez et al. (Reference Parraguez, Eppinger and Maier2015) used expected patterns characterised by network metrics and compared with empirical data to characterised by network metrics and compared with empirical data to analyse the flow of information through a complex project. In the field of applied engineering, in the context of early-stage ship design, Chalfant & Chryssostomidis (Reference Chalfant and Chryssostomidis2017) proposed using patterns to provide ‘a high-level view of a system or portion of a system, consisting of a connected set of functional blocks plus general design rules and guidelines of creating a system’. Table 1 presents various patterns found in the literature.
Table 1. Patterns in the literature

3.2.2 Key features
Key components of system architectures can be characterised as hubs, sources or sinks, depending on their function in the system architecture. This characterisation of components at the initial stages of design can provide high-level information about the role of the component in the system architecture, without the need for specific details. By designing an architecture referring, for example, to a hub component instead of a switchboard or a source component instead of a generator, a generic hub–source–sink architecture can be devised, allowing the details to be decided at later stages.
3.2.2.1 Hubs
Sosa, Mihm & Browning (Reference Sosa, Mihm and Browning2011) explained that ‘complex engineered systems tend to have architectures in which a small subset of components exhibits a disproportional number of linkages’. Such components are known as hubs. Sosa et al. (Reference Sosa, Mihm and Browning2011) studied the effects of hubs on quality (measured as the number of defects) based on empirical data. They found that there is an optimum number of hubs that will give a positive influence on quality, highlighting the importance of the management of hubs during the early design stages.
Network science studies of hubs in engineering systems include Braha & Bar-Yam (Reference Braha and Bar-Yam2004a, Reference Braha and Bar-Yam2007), Mehrpouyan et al. (Reference Mehrpouyan, Haley, Dong, Tumer and Hoyle2014), Braha (Reference Braha2016) and Piccolo et al. (Reference Piccolo, Lehmann and Maier2018). Specifically, studies (Braha & Bar-Yam Reference Braha and Bar-Yam2004a; Piccolo et al. Reference Piccolo, Lehmann and Maier2018) found that the engineering design process exhibits right skewed degree distribution, meaning a network with few high-degree nodes while the remaining nodes have low-degree nodes. In network science, scale-free networks with right skewed degree distribution are found to be highly robust against random disruptions, however vulnerable to failure in the event of target disruption (Albert, Jeong & Barabási Reference Albert, Jeong and Barabási2000). Similar findings in the engineering design literature were confirmed for large-scale engineering design projects involving activities and people (Braha & Bar-Yam Reference Braha and Bar-Yam2007; Piccolo et al. Reference Piccolo, Lehmann and Maier2018).
The existence of hubs relates also to other network properties such as disassortativity and rich club. Braha (Reference Braha2016) found that ‘complex engineering networks tend to be uncorrelated or disassortative’, explaining that this characteristic ‘decrease the likelihood that the project spirals out of control’. Rich-club phenomenon characterises networks with interconnections among its hubs. Zhou & Mondragón (Reference Zhou and Mondragón2004) investigated internet topologies, claiming that ‘the connectivity between rich nodes can be crucial for network properties, such as network routing efficiency, redundancy, and robustness’. Findings from the literature agree on the focus on hubs for the development of improvement approaches (Piccolo et al. Reference Piccolo, Lehmann and Maier2018).
The definition of a hub suggested in this article is that a node is a hub if its degree is proportionally greater than the average of its neighbours. The notion of defining hubs as high-degree nodes when compared to neighbours is different from the definition adopted in scale-free networks with a power-law degree distribution that suggests that relatively high-degree nodes are automatic hubs. It is argued that the importance of a hub is due to its position in the neighbourhood of a network and cannot be directly inferred from the degree of distribution. As the hub is a key feature of systems, it was therefore chosen as a parameter in the development of the network generator described in this article.
3.2.2.2 Sources and sinks
A source component supplies energy, material or information to the sink components and is a feature of flow systems. The source and sink concept is used in engineering in reliability, robustness, and resilience work (Pumpuni-Lenss, Blackburn & Garstenauer Reference Pumpuni-Lenss, Blackburn and Garstenauer2017; de Vos & Stapersma Reference de Vos and Stapersma2018). Max-flow optimisation problems use the concept of the source and sink (Pumpuni-Lenss et al. Reference Pumpuni-Lenss, Blackburn and Garstenauer2017) in improving the resilience of complex engineering systems, as well as studies of reliability (Chao, Fu & Koutras Reference Chao, Fu and Koutras1995). Goodrum, Shields & Singer (Reference Goodrum, Shields and Singer2018) considered ‘directed connectivity analyses, as well as sink–source flow analyses’. Chalfant & Chryssostomidis (Reference Chalfant and Chryssostomidis2011) assessed electrical flow by employing the max-flow, min-cost algorithm. In the max-flow problem, sources supply a flow whereas sinks demand a flow, and the aim is ‘to transport all the flow from the supply nodes to the demand nodes at minimum cost’ (Selva et al. Reference Selva, Cameron and Crawley2016). In terms of reliability, the literature suggests that ‘the system is functioning if there is a connection from source to sink through working components’ (Shanthikumar Reference Shanthikumar1987; Chao et al. Reference Chao, Fu and Koutras1995). Moreover, hubs are noted as components between sources and sinks in distribution engineering system architectures (de Vos & Stapersma Reference de Vos and Stapersma2018).
In summary, theoretical patterns, hubs, sources and sinks are the key concepts used in the development of the novel generator (Section 6).
3.3 Assessment of system architectures
The architecture of an engineering system is analogous to a structural solution formulated during the synthesis process that intends to satisfy an overall function (Gero & Kannengiesser Reference Gero and Kannengiesser2004). The International Council on Systems Engineering Walden et al. (Reference Walden, Roedler, Forsberg, Hamelin and Shortell2015) describes the architecting of systems as ‘an analysis of interactions between system elements to prevent undesirable properties and reinforce desirable ones’. Typically, complex engineering systems consist of subsystems that are designed independently by different disciplines and are integrated together at the later stages of the design process. As a result, the complex system architecture is not intentionally formulated and the analysis and evaluation of desirable and undesirable properties may not take place at an early stage, leading to costly and time-consuming reformulations at later stages of design. The methodology of this article assesses two desirable attributes of the system, modularity and robustness, which are suggested to be assessed during the initial stages of the design.
3.3.1 Assessment attributes: modularity and robustness
Modularity and robustness are typically desired attributes, are at times conflicting (Walsh, Dong & Tumer Reference Walsh, Dong and Tumer2019) and are analysed in isolation during the design process. Baldwin & Clark (Reference Baldwin and Clark2000) defined modularity as ‘a property of a system where the system can be divided into a different number of chunks called modules, which have strong intra-connections within the individual module and weak interconnections between modules’. Modularity is discussed widely as a beneficial property in the literature (Gershenson, Prasad & Zhang Reference Gershenson, Prasad and Zhang2003). Modular architectures facilitate concurrent design and development and early testing and can be advantageous for lifetime operation and maintenance due to future savings in terms of repairs, replacements and reuse (Meehan, Duffy & Whitfield Reference Meehan, Duffy and Whitfield2007). The design of a modular architecture can, however, lead to a more complex development due to the technological, planning and organisational requirements (Albers et al. Reference Albers, Bursac, Scherer, Birk, Powelske and Muschik2019). Another profoundly essential attribute of modern engineering systems is robustness. Fricke & Schulz (Reference Fricke and Schulz2005) defined robustness as a ‘system’s ability to be insensitive towards changing environments’. Robustness is related to the survivability, changeability and resilience of systems (Fricke & Schulz Reference Fricke and Schulz2005; Department of Defense 2011; Kott & Abdelzaher Reference Kott and Abdelzaher2016). The need for robust systems is attributed to the management of their complex interdependence network, as ‘system robustness is a feature that consists of a comprehensive combination of system elements’ (Elmaraghy et al. Reference Elmaraghy, Elmaraghy, Tomiyama and Monostori2012).
This article’s methodology (Section 4) defines modularity and robustness as the main assessment attributes as these are two critical and perhaps conflicting attributes of engineering systems.
3.4 System architecture modelling and metrics
Design structure matrix (DSM) modelling approaches are widely applied in engineering systems to represent the structures of product and system architectures and are valuable for modelling and analysis purposes (Eppinger & Browning Reference Eppinger and Browning2012; Browning Reference Browning2015). The DSM is simple to understand as a square matrix illustrating the relationships between matching elements positioned in the rows and columns of the matrix and offers an efficient and effective way to model and analyse systems. The relationships included in a component-based DSM relate with design dependencies such as spatial, energy, material and information (Pimmler & Eppinger Reference Pimmler and Eppinger1994), and can be symmetrical or asymmetrical (Sosa, Eppinger & Rowles Reference Sosa, Eppinger and Rowles2003). The majority of component-based DSMs are built based on a symmetric premise (non-directional) since the configuration of symmetric DSMs is simpler (Helmer, Yassine & Meier Reference Helmer, Yassine and Meier2010). Most DSM analysis studies to date have focused on clustering components for modular architecture determination (Browning Reference Browning2015). Researchers have also employed product DSMs to determine architecture patterns such as modules and cycles (Sharman & Yassine Reference Sharman and Yassine2004; Fixson Reference Fixson2005; Sosa, Mihm & Browning Reference Sosa, Mihm and Browning2013). The DSM is a useful way to represent a network, facilitating the application of network-based approaches (Sosa, Eppinger & Rowles Reference Sosa, Eppinger and Rowles2007; Baldwin et al. Reference Baldwin, Maccormack and Rusnak2014; Sarkar et al. Reference Sarkar, Dong, Henderson and Robinson2014). Network science is the study of networks represented as nodes (vertices) of elements and edges (arcs) as the connections between the elements. Parraguez & Maier (Reference Parraguez and Maier2016) provided an overview of the challenges and key decisions when using network science to support design research. They advise that the first decision is to define the overall research purpose (exploratory or explanatory) and the second is to select relevant network features. In line with the Parraguez & Maier (Reference Parraguez and Maier2016) guidelines, the research study report in this article has an exploratory nature, and the network conceptualisation of complex systems is unweighted (binary) and directed to enable robustness assessment. The following sections discuss network-based metrics for modularity and robustness.
3.4.1 Modularity network based metrics
Network average nodal degree is suggested in the literature as a reverser indicator of modularity (Luo Reference Luo2015). Sinha (Reference Sinha2014) calculated modularity by adopting Newman’s modularity index (Q). Braha & Bar-Yam (Reference Braha and Bar-Yam2004a) proposed the clustering coefficient as a measure of the potential modularity of complex design networks. Sosa et al. (Reference Sosa, Eppinger and Rowles2007) proposed a network approach to measure component modularity using various network metrics such as degree and centrality. Parraguez et al. (Reference Parraguez, Eppinger and Maier2015) used in combination centrality metrics and clustering coefficient to determine the level of process modularity in complex engineering design projects, stressing that it is difficult to evaluate global network topology properties such as modularity, where either centrality or clustering metrics are calculated in isolation. Section 4.2.1 elaborates further on the selected modularity metric that is employed to quantitatively assess the modularity of the networks.
3.4.2 Robustness network based metrics
The most popular network science metrics discussed in the engineering system literature relate to algebraic connectivity, average path length and largest connected component. Algebraic connectivity is a network metric related to robustness. According to Mehrpouyan et al. (Reference Mehrpouyan, Haley, Dong, Tumer and Hoyle2014), ‘algebraic connectivity is a good metric to be considered to determine the resilience of architecture of complex systems’. Yazdani & Jeffrey (Reference Yazdani and Jeffrey2012) recommended an algebraic connectivity metric to measure the structural robustness of water distribution systems. However, algebraic connectivity is calculated while the network is intact, as a structural metric, and does not capture the behaviour after a disruption. Walsh, Dong & Tumer (Reference Walsh, Dong and Tumer2018) used the network average shortest path length metric to study the function of bridging components in engineering systems. Dynamic robustness has been studied by Braha & Bar-Yam (Reference Braha and Bar-Yam2007, Reference Braha and Bar-Yam2004b), Piccolo et al. (Reference Piccolo, Lehmann and Maier2018) using the largest connected component, demonstrating that design networks are highly robust under random disruption but are highly vulnerable under targeted disruption. Paparistodimou et al. (Reference Paparistodimou, Duffy, Whitfield, Knight and Robb2020) proposed a network-based metric tailored for a distributed engineering system that has source and sink components to study robustness. This metric is employed to assess the robustness of system architectures, as is further discussed in Section 4.2.2.
4 Methodology
The methodology of this article is structured as follows. Section 4.1 outlines the inputs of the methodology. Section 4.2 explains the modularity and robustness metrics, which are used to evaluate the technical and theoretical networks. Section 4.3 provides information on the computational implementation of the methodology.
4.1 Inputs
The inputs of the methodology are defined as the networks: technical systems or theoretical patterns. The technical systems are described in more detail in Section 5 and are developed through data collected from the naval engineering systems. Inputs for the methodology also become the various simulated networks populated by the network generator (Section 7).
4.2 Assessment metrics and methods
The assessment part of the methodology is based on representing system architecture as a network, and computing modularity and robustness using the network metrics that function as evaluation indicators. The following sections describe the adopted methods and metrics.
4.2.1 Modularity metric and method
The Louvain community detection method is used to identify a modular configuration, in combination with a normalised Newman modularity index proposed by Magee, Whitney & Moses (Reference Magee, Whitney and Moses2010). The Louvain community detection method (Blondel et al. Reference Blondel, Guillaume, Lambiotte and Lefebvre2008) is used to find the modules, and there is no requirement to define the number of modules. A subgraph is considered as a community if the density of interactions is higher than what could be anticipated in a random graph. The communities (modules) are discovered using spectral modularity maximisation established by the Louvain method. This method searches for communities/modules c1, c2 $\ldots$ cp that maximise a quality function $Q$, known as modularity, defined as
 $$\begin{eqnarray}Q=\frac{1}{2m}\mathop{\sum }_{ij}\left(A_{ij}-\frac{k_{i}k_{j}}{2m}\right)\unicode[STIX]{x1D6FF}(c_{i},cj),\end{eqnarray}$$
 where  $m$ is the number of edges, $\unicode[STIX]{x1D6FF}(m,n)$ is the Kronecker delta, $A_{ij}$ are entries of the adjacency matrix and $k$ is the degree of the node. Positive contributions to $Q$ occur when an edge in the network connects nodes assigned to the same community. The quantity $k_{i}k_{j}/2m$ is the probability of an edge occurring in a random network with the same degree of distribution; thus, $Q$ is sizeable only if there is a preponderance of like-to-like connections. $Q$ is normalised to give values lying between $-1$ and 1. This quality function can be used for both unweighted and weighted networks. The Louvain community method output is a community (module), which is then used as the input to calculate the modularity metric. Parraguez et al. (Reference Parraguez, Piccolo, Perisic, Storga and Maier2019) also used the Louvain method to study process modularity over time, concluding that the method identifies ‘real modules with a high degree of accuracy’.
Newman’s modularity metric Newman (Reference Newman2010) reflects the quality of division; therefore, higher values represent a greater readiness to divide the pattern into modules, which is advantageous. A problem with modularity is that it is difficult to compare modularity between networks. Magee et al. (Reference Magee, Whitney and Moses2010) suggested a normalised Newman modularity metric to overcome this. A parameter  $f$ is introduced:
 $$\begin{eqnarray}f=1-\frac{(p-1)}{n},\end{eqnarray}$$
 where  $p$ is the number of communities and $n$ is the total number of edges of the network. The normalised version of the Newman modularity metric is given by
 $$\begin{eqnarray}Q_{n}=\frac{Q}{f-\mathop{\sum }_{i=1}^{k}(a_{i}^{2})},\end{eqnarray}$$
 where  $a_{i}$ is the fraction of edges with at least one end node inside module $i$.
$i$.
4.2.2 Robustness metric and method
The robustness metric used is grounded on the principle that a function is satisfied post disruption if a set of source and sink components maintains a prescribed level of connectivity. This robustness metric is appropriate for any network where the ability to communicate between well-separated nodes is of paramount importance. A detailed description of the robustness metric is presented in the previous works of Paparistodimou et al. (Reference Paparistodimou, Duffy, Knight, Whitfield, Robb and Voong2018, Reference Paparistodimou, Duffy, Whitfield, Knight and Robb2020). In short, sources and sinks are identified in the DSM, and the level of connectivity between sources and sinks is measured after a disruption. For robustness, this level must exceed a user-prescribed redundancy threshold criterion.
To compute the level of robustness, the adjacency matrix  $A$ of a network $G$ is used to construct a new matrix $S$. This new matrix $S$ is a binary matrix and catalogues the existence of paths/walks (of any length) between nodes in the network. One way to determine $S$ is to compute the matrix exponential $e^{A}$ and let $S_{ij}=1$ if and only if the corresponding entry of the exponential is non-zero, but other techniques can be used too. Labelling the sets of sources $s=\{s_{1},s_{2},s_{3},\ldots ,s_{e}\}$ and sinks $t=\{t_{1},t_{2},t_{3},\ldots ,t_{k}\}$, the number of ‘1’s in the corresponding intersection of rows and columns of $S$ is enumerated. The proportion of ‘1’s gives a measure of the interconnectivity between the sources and sinks of the network. This can be recalculated after the network is subject to disruption (i.e., loss of nodes or edges). This measure works equally on directed and undirected networks. More precisely, the robustness ( $R_{s,t}$) of the intact system architecture is measured using
 $$\begin{eqnarray}R_{s,t}(G)=\frac{\mathop{\sum }_{i=1}^{e}\mathop{\sum }_{j=1}^{k}S_{ij}(s_{i},t_{j})}{ek}.\end{eqnarray}$$
 A disruption (loss of nodes/edges) generates a damaged network, represented by a network  $G^{\prime }$ with adjacency matrix $A^{\prime }$. Robustness is recalculated to give
 $$\begin{eqnarray}R_{s,t}(G^{\prime })=\frac{\mathop{\sum }_{i=1}^{e}\mathop{\sum }_{j=1}^{k}S_{ij}^{\prime }(s_{i},t_{j})}{ek}.\end{eqnarray}$$
 Both (4) and (5) can be computed for all non-empty subsets of  $s$ and $t$.
$t$.
4.2.2.1 Calculating robustness using target and random strategies
The calculation of robustness under random and target strategies is an approach used in the engineering design literature (Braha & Bar-Yam Reference Braha and Bar-Yam2007; Piccolo et al. Reference Piccolo, Lehmann and Maier2018). In this article, eccentricity, a concept in network theory, is used to devise targeted attack scenarios. The eccentricity of a node,  $v$, is the greatest geodesic distance between node $v$ and any other (the geodesic distance is also known as the shortest path). The diameter $d$ of a network is defined to be the maximal value of node eccentricity, and the radius $r$ is the minimum. In targeted attack scenarios, components with the lowest eccentricity are sequentially attacked because the lowest eccentricity components are the central components of the network and represent the core part of the system’s functionality. Compared with random attacks on networks, targeted attacks tend to be more severe.
4.3 MATLAB computational tool
For the computations, the input used for MATLAB is the adjacency matrix representing the different networks. A new disrupted adjacency matrix is generated by removing the nodes in targeted and random attacks. Then, the robustness metric is calculated using the author’s codes. MIT Strategic Engineering (2006) and Brain Connectivity Toolbox (Rubinov & Sporns Reference Rubinov and Sporns2010) codes were also used in order to calculate modularity and perform the target attacks based on eccentricity.
5 Preliminary work
The empirical work presented in this section included meetings with subject-matter experts (SMEs) and collection of data from the system design, engineering drawings and operational requirements. A senior power and propulsion engineer was involved in the development of binary DSMs for the two technical systems. These data are used to describe the two technical system architectures with DSMs. In the DSMs, the notation ‘1’ shows a directed relationship from the row element to the column element. Network representations were derived based on the formulated DSMs that are presented in appendix A.
5.1 Technical systems Type A and B
Two warship designs with the same functional requirements were selected for the empirical work. Type A was an older legacy design and Type B was a modern design. These ship systems were selected to provide representative complex systems describing a ship’s systems and operational functions. These included diesel generators (DGs), high-voltage (HV) and low-voltage (LV) switchboards, transformers, interconnectors, propulsion motors, electrical distribution centres (EDCs) and the various auxiliary cooling pumps. In naval design, systems are inherently highly redundant and robust to satisfy operational needs and survivability requirements.

Figure 1. Technical network Type A.

Figure 2. Technical network Type B.
Figure 1 depicts the network representation of Type A. Diesel generators (DGs) (1–4) are the main power source components that supply electrical power to the ship components via high-voltage switchboards (HV SWBDs), low-voltage switchboards (LV SWBDs) and EDCs. Propulsion can be provided by electrical power or from the gas turbines (GTs) and gearbox. Auxiliary systems, low-pressure seawater system (LPSW) support power and propulsion functions and chilled-water plants are used for combat systems. Figure 2 shows the Type B network. Power is generated by two DGs and two GT alternators, which supply the HV system for the two propulsion motors and via transformers to the LV system power to the whole ship systems. The GTs are dependent on the seawater system for cooling (GT Cooler and GT Module). The chilled-water plants cool the transformers, the filters associated with the propulsion motors and the radar equipment in the fore and aft masts. The auxiliary seawater system cools propulsion converters and motors.
Both networks (Figures 1 and 2) are shown to have a cyclical configuration, reflecting the interdependency of subsystem components. For example, electrical power generation requires LPSW cooling, but the LPSW pumps require electrical power to function. Such interdependencies create the cyclical (loop) pattern. The cyclical pattern enables the functionality of these complex and robust Type A and B technical systems.
5.2 Robustness and modularity results
This section presents the results of the assessment of the two technical system architectures based on modularity and robustness metrics and methods. Figure 3 shows the robustness response curves for random and targeted disruptions. For random attacks, Type B is more robust than Type A, consistent with expert opinion. However, in targeted attacks, the overall response of the two systems falls rapidly as increasing numbers of nodes are removed. Type B displays better robust behaviour under attacks when up to four central components are removed; with five or more, the robustness collapses. Large targeted disruptions suggest multiple distributed attacks; however, the systems are designed to survive a single event, meaning that multiple attacks are not representative of the operational environment.

Figure 3. Robustness calculations for Type A and B technical systems.
In naval designs, spatial separation of critical duplicated components minimises the damage profile and limits the number of nodes lost. The development of future improved designs with a more linear robustness response to targeted attacks could provide improved survivability and operational capability in an evolving threat environment.
Table 2 shows the Newman modularity index for the two architectures. Type A has a higher degree of modularity, with simpler systems and fewer interconnections, whereas Type B has a lower modularity, with increased levels of interconnections (due to additional redundancy) designed to give improved robustness.
Table 2. Modularity calculations for Type A and B technical systems

It is observed that efforts to increase the level of robustness through additional redundancy in Type B lead to a more complex architecture compared to Type A. The Type A design is a more compact and less complex distributed system allowing to be installed into a smaller platform (less costly solution). The Type B design requires considerably more volume and is a more complex system due to the need for higher automation to successfully operate, requiring a larger platform (higher cost). Even so, Type B is a more robust solution and is a more modern and advance design. The experts consider that the Type A network has considerable benefits in respect to cost and operation.
5.3 Empirical observations
The empirical observations presented in this section were derived in a meeting led by the first author, with participants from industry and academia. A network science academic, two engineering design academics, one senior power and propulsion engineer and research and technology engineering manager deliberated the network representations and the robustness and modularity results of Type A and Type B technical systems. While observations 1 (Section 7.2), 2 and 3 (Section 3.2.2) are also found to be mentioned in the literature, observation 4 was established based on the discussion. Following are the four key observations derived:
(1) The network representations (Figures 1 and 2) are cyclical. This observation is consistent with identified literature covering other domains such as mechanical assemblies, electrical circuits and system of system architectures as discussed in Section 7.2. This suggests that a component-based system architecture can be designed based on a cyclical main structure pattern.
(2) Main hub components have source and sink components connected to them and are critical for the robustness of the system. For example, electrical supply from the generators feeds HV SWBDs representing a source style hub pattern, whereas EDCs demand from LV SWBDs representing a sink style hub pattern. This verifies that a source–hub–sink pattern exists in component-based system architectures.
(3) The level of connectivity between hubs is designed to maintain functionality after disruption. In Type A and Type B, the hub components have alternative path connectivity designed for redundancy. This implies that a hub connectivity pattern occurs in component-based system architecture.
(4) At a lower level of decomposition, hubs display bus-modular, star, or hierarchical style patterns. This suggests that structural patterns can be identified at a hub level.
The four empirical observations in combination with the literature findings on theoretical patterns presented (Section 3.2.1) and hubs, sources and sinks (Section 3.2.2) stimulated the development of the network generator (Section 6) and the experiments (Sections 7.1 and 7.2).
6 A novel network generator
This article presents a novel network generator, developed from the relevant literature on engineering design and network sciences (Sections 3.2.1 and 3.2.2) and with empirical observation of distributed engineering systems (Section 5.3). While the observations in Section 5.3 were based on naval examples, the generator has been developed as a network tool that can be applied to system architectures dictated by their configuration of source and sink components structured in a way to deliver a particular functionality. The generator does not aim to produce feasible solutions, but rather, theoretical complex patterns that have similarities with engineering systems based on minimum detail information. The generator has the capacity to select theoretical patterns of the main structure, hubs and parameters of the hubs, such as hub size, density and level of connectivity among hubs, while classifying the components as sources or sinks combined with a threshold criterion.
Theoretical patterns are developed in the generator as unweighted networks whereas directionality is included to create source and sink nodes at the hub level. Source nodes feed hubs; in contrast, hubs feed the sink nodes. For distributed engineering systems, the energy, materials and information flow from source to sink components. It is therefore important to identify this directionality of the flows in the architecture in order to allow the assessment of robustness.
Nine parameters can be chosen by the user to fine-tune the generator in order to populate tailored simulated networks. The first two parameters (1 and 2 in Table 4) control the number of nodes and the type of main structure of the simulated network. The main structure patterns used in parameter 2 of the generator are presented in Table 3. Min et al. (Reference Min, Suh and Hölttä-Otto2016) stated that commonly ‘system architectures are categorized into three different configurations: integral, linear-modular, and bus-modular architecture  $\ldots$ many engineering systems are configured as or resemble one of these architectural configurations to some degree’. The bus-modular, path, hierarchical and integral patterns were selected as options based on the engineering design literature (Sharman & Yassine Reference Sharman and Yassine2004; Hölttä-Otto et al. Reference Hölttä-Otto, Chiriaca, Lysy and Suh2012; Paparistodimou et al. Reference Paparistodimou, Duffy, Voong and Robb2017). Additionally, the cyclical pattern was included as an option based on the observations from the preliminary empirical investigation (Section 5.3) that were consistent with references in the literature (Whitney Reference Whitney2003; Agarwal, Pape & Dagli Reference Agarwal, Pape and Dagli2014; Chalfant & Chryssostomidis Reference Chalfant and Chryssostomidis2017).
The article suggests that these five main structure pattern options can form the basis for the creation of various and different style simulated networks, establishing a broad range of applicability for the proposed generator. The five network main structure patterns presented (Table 3) were generated based on DSMs (examples are depicted in appendix B).
Table 3. Network generator parameter 2: main structure patterns

The simulated networks can be further tailored using the additional parameters of the generator. Parameters 3, 4 and 5 in Table 4 determine the number, density and type of pattern of the hubs, respectively, on the main structure. The pattern of the hub can be defined to mimic one of the main structures or can be randomised between pattern options. A level of randomisation is included in the generator with respect to the position of the hubs in the main structure. The next two parameters (6 and 7 in Table 4) define the probability that a hub’s node links to sources or sinks. Nodes with edges pointing to hubs become sources; nodes pointed to by hubs are sinks. The remaining nodes of the network are assumed to be intermediate components. Parameter 8 in Table 4 is a redundancy threshold criterion variable that defines the level of redundancy of the source (e.g., 0.5 indicates double redundancy in the number of sources).
Table 4. Parameters of network generator

Table 5. Experimental set-up variable: main structure pattern

The final parameter 9 in Table 4 gives the level of connectivity among hubs (termed pal). The parameters of the generator are summarised in Table 4. The simulated networks populated by the network generator are not expected to follow a power-law degree distribution. Evidence of this is in the findings of the technical systems previously presented (Type A and B). Previous studies on climate control and aircraft engine systems (Sosa et al. Reference Sosa, Mihm and Browning2011), bicycle drivetrain, automobile drivetrain and aircrafts (Walsh et al. Reference Walsh, Dong and Tumer2019) indicate that technical systems do not always exhibit a power-law degree distribution. Also, the degree distributions of the design process network studied by Piccolo et al. (Reference Piccolo, Lehmann and Maier2018) were found not to be power laws.
Section 7 presents various experiments developed by varying the different parameters of the network generator.
7 Application: generation and assessment of theoretical patterns
The network generator experiments used Monte Carlo techniques to examine the influence of the parameters on modularity and robustness under both random and targeted attacks. A total of 2,500 instances were simulated for each experimental run. While experimenting with one parameter, the other parameters of the generator were randomly varied in the range of the limits set for each parameter or remained fixed at nominal values as shown in Table 5. The limits of the ranges of the parameters were derived with respect to the two technical systems (Section 5). The user can define the limits of the experimental ranges depending on the purpose behind the use of the network generator. The Monte Carlo approach based on ranges defined in Table 5 was adopted for all the experiments that are presented (Sections 7.1 and 7.2). The first author discussed in individual meetings with the SMEs the experimental results of this section.
7.1 Experimental set-up: varying the main structure pattern
For the following experimental set-up (Table 5), five experiments were performed for each of the main structure patterns under examination (S1  $=$ bus modular, S2 $=$ path, S3 $=$ hierarchical, S4 $=$ integral and S5 $=$ cycle). This means for each experiment the main structure was constant, whereas the other parameters (1, 3, 4 and 5) were randomly selected for each instance within the predefined range and options of Table 5. The remaining parameters (6, 7, 8 and 9) were fixed. For each experiment, the robustness under random and targeted attacks and the modularity of the simulated networks were calculated. Random instances are shown in Figures 4–7 as examples of the simulated networks.

Figure 4. Random instance of a hybrid bus-modular main structure network (S1).

Figure 5. Random instance of a hybrid path main structure network (S2).

Figure 6. Random instance of a hybrid hierarchical main structure network (S3).

Figure 7. Random instance of a hybrid integral main structure network (S4).

Figure 8. Robustness calculations varying the main structure patterns.
Figure 8 shows a reduction in robustness for an increasing number of random and targeted disruptions for all hybrid patterns. The hybrid ‘integral’ simulated network with a high number of interconnections exhibited the highest robustness under both targeted and random attacks. However, this high level of connectivity is not an efficient feasible arrangement; as Chan, Akoglu & Tong (Reference Chan, Akoglu and Tong2014) explained: ‘ideally, a fully connected network is the most robust; however, it is not feasible to design such real-world networks due to constraints in physical space, budget, etc.’ The hybrid bus-modular network had the worst performance under targeted disruptions. Disruption of the most central component of the bus-modular pattern influences the whole pattern, leading to increased vulnerability, although it has acceptable levels of modularity. The ‘cyclical’ pattern has a more straightforward, low connection, low-cost arrangement, with potentially the most desirable robustness under targeted disruption. The initial examination of the results for the simulated cyclical pattern suggests that it could provide improved robustness behaviour compared to the two naval design systems previously assessed in Section 5.2.
The simulated cyclical pattern did not have as sharp loss of the robustness under the four or more target component attacks as that in Figure 3 of the naval design systems. The robustness of the architecture patterns to random attacks is broadly similar, showing an almost linear decline as the number of nodes removed increased. However, with targeted attacks, all of the patterns showed a rapid nonlinear reduction in robustness, with variations between the patterns examined. This implies that the choice of pattern is important, particularly in environments where target disruptions can occur.
The topology of the design process bipartite network presented in Piccolo et al. (Reference Piccolo, Lehmann and Maier2018) shares trivial commonalities with the bus-modular simulated network (Figure 4). The Piccolo et al. (Reference Piccolo, Lehmann and Maier2018) network is larger (259 nodes) than the networks simulated in this article by a factor of between 3 and 6. Nevertheless, the decay of robustness presented in Piccolo et al. (Reference Piccolo, Lehmann and Maier2018) has a similar profile to the results in Figure 8; in particular, targeted attacks of central nodes result in a much sharper deterioration of robustness in comparison to random attacks. The fact that there are some similarities even though the measures of robustness are different and the network architectures have only trivial commonalities is worthy of further research.
The results (Figure 9) show the modularity assessment. The path (PM), hierarchical (HE), and cyclical (CY) hybrid patterns provided the best modularity results, between 0.52 and 0.54, whereas the two technical patterns exhibited a comparable degree of modularity, between 0.63 and 0.48. The integral (IN) pattern is highly interconnected and could not be readily divided into modules, giving a  $Q$ value close to zero. This experiment with the generator provided an overview of the effects of the different main structure patterns on robustness and modularity.

Figure 9. Modularity calculations varying the main structure patterns.
In the next step of the study, it was decided further experiments should focus on the cyclical main structure pattern.
7.2 Cyclical main structure pattern experiments
The cyclical pattern shares similarities with respect to its configuration with the two technical systems (Type A and B) presented in Section 5. As was observed in Section 5.3, the two technical systems have a cyclical network configuration, showing a loop-style pattern with the main hubs identified and additional connectivity among the hubs and other components. The existence of closed loops (cycles) was a key observation in the Type A and B technical systems. In addition, relevant references were found in the literature that supports further exploration. For example, Chalfant & Chryssostomidis (Reference Chalfant and Chryssostomidis2017) discussed ship propulsion configuration, explaining that there could be two styles, a cyclical and an integral (mesh): ‘[it] may require closed-loop paths for operability as in lube oil and chilled water systems, or may allow many redundant paths through a complex mesh-restorable network as in an electrical distribution system’. Whitney (Reference Whitney2003) argued that patterns (motifs) that generate functions are cyclical (closed loops) in the context of technological networks such as mechanical assemblies and electronic circuit. Moreover, a study by Agarwal et al. (Reference Agarwal, Pape and Dagli2014), which aimed to identify an appropriate system of system architecture to satisfy multiple objectives, including robustness and modularity, found that a circular graph was the best pattern. These reasons motivate further experimentation with the cyclical pattern.
7.2.1 Experimental set-up: varying the number of nodes
The first experiment (Table 6) for the cyclical main structure pattern focused on variations in the number of nodes of the network and possible effects on the level of robustness and modularity.
Table 6. Experimental set-up variable: number of nodes


Figure 10. Robustness calculations varying the number of nodes (size of network).
Figure 10 shows a rational behaviour with the robustness response falling as the number of disruptions increased. There was broadly similar behaviour for all sizes of the cyclical pattern for both random and targeted disruptions, with a small reduction in robustness as the size of the main structure was reduced. It can therefore be deduced that scaling a cyclical pattern will not crucially influence robustness. With respect to modularity, the Table 7 results indicate that the modularity increases slightly as the size of the cyclical pattern increases.
Table 7. Modularity calculations varying the number of nodes (size of network)

Table 8. Experimental set-up variable: number of hubs

Table 9. Modularity calculation varying the number of hubs

From the previous results with a broader size range (from 40 to 80), the degree of modularity was 0.52. The findings suggests that the size of the main structure pattern does not significantly affect either its robustness or its modularity.
7.2.2 Experimental set-up: varying the number of hubs
The experimental set-up in Table 8 presents the variation in the number of hubs.

Figure 11. Robustness calculations varying the number of hubs.
It can be observed that increasing the number of hubs initially protects the network from targeted hubs but then leads to an increased vulnerability once the scale of the attack passes a certain threshold (in Figure 11, this threshold is 10 nodes) whereas for random attacks no such threshold is apparent. Large-scale targeted attacks will tend to remove complete hubs. In the simulated network, the increased frequency of hubs also increases the frequency of removal of interconnections between hubs in target attacks, which might explain the phenomenon observed here as the removal of these ‘arteries’ proves catastrophic. But in random attacks the chances of disrupting an artery are diminished and the added communicability provided by a plethora of hubs proves beneficial to robustness. Such contradictory behaviour highlights the need for balance in the design.
In technical systems, hubs may be designed with spatial separation from each other because the designer aims to avoid a single disruption affecting more than one hub simultaneously. In the case of an extended disruption of the system that can damage more than one hub, the robustness decreases significantly. The findings suggest that the number of hubs should be carefully considered, given the expected operational environment of the system: many hubs could be detrimental to robustness, and so the spatial separation of hubs in terms of the physical design is fundamental. However, addressing only the spatial location of hubs does not resolve the problem, as an intelligent attacker may be aware of the location of hubs and intentionally disrupt them simultaneously. Technical system architectures have specific structures, where the increased number of hubs suggests increased redundancy and improved robustness. In network science, the number of hubs is considered to be a point of vulnerability in scale-free networks (Albert et al. Reference Albert, Jeong and Barabási2000). However, in the simulated networks small in size (40–80 nodes) and with a limited number of hubs, the vulnerabilities introduced by hubs are more considerable only if an extensive targeted attack occurs in the system, rather than an attack of a smaller magnitude.
Sosa et al. (Reference Sosa, Mihm and Browning2011) argued that ‘the presence of hubs has a significant effect on system quality (measured by the number of defects in the system)’ and concluded that there is an ‘optimal presence of hubs which minimize the number of defects in the system’. Their work is different from the experiments presented herein, as the focus of their study is on quality. However, our results provide further evidence that there is an optimal number of hubs in the design of technical systems. The redundant hubs are the ones that are readily available to take over the functionality in the case of a targeted attack on a hub, as they are designed to avoid such targeted attack effects. However, determining the correct number of hubs in a technical system is not a straightforward task and requires a careful investigation and consideration of the expected operational environment in which a system is designed to survive.
Keeping the number of hubs in the simulated cyclical network small gives a higher level of modularity than when there are a larger number of hubs. Since there is a constant level of interconnections between hubs in the generator, their number will increase as the number of hubs increases. The higher interconnectivity reduces the ability to divide the network pattern into modules, and hence reduces the modularity.
The experimental findings indicate that a smaller number of hubs positively affect modularity in the development of coherent modules; however, robustness falls under targeted attacks. The important finding is that robustness has a cut-off point, meaning that for disruptions that are extensive in magnitude, an increase in the number of hubs in the architecture provokes a sharper decline in robustness.
These experimental findings is used to inform the redesign of Type A (Section 8). The original designs, Types A and B (Figure 4), show that the level of robustness of the two naval designs collapses with more than four or five central components removed. As was previously discussed, a more linear degradation of robustness is preferable. The naval technical systems have in total four main hubs ( $2\times$ LV SWBDs and $2\times$ HV SWBDs). The simulated networks shown in Figure 11 suggest the possibility of improved robustness by increasing the number of hubs above five given that disruptions that remove more than ten central nodes simultaneously are not expected to occur during operational life. The worst-case scenario in naval design examples only considers single attack events and not multi-attacks. In this case, increasing the number of hubs can positively affect robustness under target and random disruptions. This finding can provide insights to guide the selection of new design options. Section 8 implements this experimental result in the redesign of the Type A technical system. As another example, a future warship power system design may have six to eight discrete power generator modules ‘DG Source feeding HV hub’ configured, separated and controlled to deliver specific functions on board.
7.2.3 Experimental set-up: varying the density of hub
The experimental set-up in Table 10 is focused on the variation in the density of hubs.
Table 10. Experimental set-up variable: density of hub


Figure 12. Robustness calculations varying the density of hubs.
The density (i.e., the number of source/sink interconnections, for example, the number of consumers/sinks connected to a hub) of the hubs does not significantly influence the robustness of the patterns under targeted or random disruptions as shown in Figure 12. There is a marginal indication that robustness with higher density hubs is slightly reduced under targeted attacks and slightly increased following random attacks.
Table 11. Modularity calculations varying the density of hubs

The results of experiments on the density at the hub level in Table 11 suggest that the modularity falls slightly to a limiting value as the density of the hub increases. This may be explained by the increased level of interconnections between hubs as the hub size increases. The density of hubs does not drastically influence either the robustness or the modularity of the system architecture. The experimental findings indicate that the density of hubs is not a significant factor in influencing the robustness of the architecture. The density of the hub relates to the number of source and sink nodes connected to the hub. This finding could be useful when designing the system architecture, because additional or fewer sink and source components could be added onto the hubs. In practice, the numbers of sources and sinks at the hub level are considered key elements for designing redundancy in the architecture. However, the experimental findings suggest that a reduction in the number of sources and sinks could be an aspect of trade-off in a future redesign given that other redundancy design strategies are adopted. This is implemented in the Type A redesign (Section 8), where the number of sources is reduced at the hub level and an additional hub is designed in the architecture.
7.2.4 Experimental set-up: varying the hub pattern
Table 12 shows an experimental set-up on the variation in the patterns of the hubs.
Table 12. Experimental set-up variable: hub pattern


Figure 13. Robustness calculations varying the hub pattern.
The robustness of architectures subjected to targeted disruptions was found to be insensitive to the type of hub pattern style (apart from a path pattern). Path patterns at the hub level showed the worst robustness under both random and targeted disruptions, as any loss of node reduced it.
In general, robustness improved as the level of interconnectivity increased. The simulated networks of this experiments show that a bus-modular hub level pattern has acceptable performance (Figure 13) while at the main structure level, a bus modular has the worst performance (Figure 8). Bus-modular-style hub level patterns are also identified in the two naval design examples. The power and propulsion expert gave the following example: ‘In ships’ electrical systems there are separate generators and switchboards. Power to ships’ equipment is taken from the EDCs, which are located throughout the ship. Each EDC has a changeover switch connecting either the normal supply from one switchboard or an alternative supply from the other switchboard. To reduce vulnerability, the switchboard/EDC cables run on opposite sides of the ship. The interconnections between EDCs and equipment are typically a single path, which tends to increase system vulnerability. For some of the critical ship systems, additional changeover switches are located close to the equipment to provide additional normal and alternative supplies from adjacent EDCs’. This arrangement suggests two ‘bus-modular’ patterns, with ‘star’ interconnections at a hub level. The choice of hub pattern may have less effect on robustness in the case of targeted disruptions; however, for random disruptions, it may be more beneficial to design bus modular or integral hub patterns because of increasing reliability and availability of engineering systems.
Table 13. Modularity calculations varying the hub pattern

The baseline hybrid cyclical patterns have a modularity of 0.52 (Figure 9) that is based on random allocations of hub patterns (bus modular, path, hierarchical, cycle and integral). The results in Table 13 show a significant reduction in modularity, when it is defined as integral hub patterns (the hub pattern is not randomly selected). This means that the integral pattern at the hub level can influence the overall degree of modularity. All of the other hub configurations show higher modularity when compared with the baseline, indicating also that the hub pattern is an influential factor in controlling the degree of modularity.
7.2.5 Experimental set-up: varying the level of redundancy threshold criterion
The experimental set-up of Table 14 concentrated on the variation in the redundancy threshold criterion that relates with the level of redundancy between source and sink nodes in the system architecture.
Table 14. Experimental set-up variable: redundancy threshold criterion


Figure 14. Robustness calculations varying the redundancy threshold criterion.
The redundancy threshold criterion represents the level of redundancy of sources: 0.25  $=$ four times the redundancy, 0.5 $=$ double the redundancy and 1.0 $=$ no redundancy. The results in Figure 14 show that double the redundancy of sources in the architecture improved overall robustness under random and targeted attacks. However, with four times the redundancy, there was only marginal improvement in the robustness. The experimental findings suggest a decreasing benefit in robustness as the level of redundancy is increased above the double redundancy. In the naval design example, this finding suggests that an optimum level of redundancy exists, given the associated additional costs, weight, space requirements and maintenance. The proposed generator can provide an early indication of the relative merits of levels of redundancy at the initial stage of design. This may suggest areas where the initial design efforts might examine new redundancy approaches without compromising robustness. For example, this finding guided the redesign of Type A (Section 8), which included three instead of four alternative independent redundancy paths between the source and the sink to satisfy power functionality.
7.2.6 Experimental set-up: varying the level of connectivity between hubs
Table 15 presents the experimental set-up of varying the level of connectivity between hubs.
Table 15. Experimental set-up variable: level of connectivity between hubs


Figure 15. Robustness calculations varying the connectivity between hubs.
The level of connectivity among hubs was controlled in the proposed generator using the ‘pal’ parameter. The pal parameter indicates the level of hub interconnectivity: pal  $=$ 0.5 means that 50% of hubs are connected; pal $=$ 1 means that all hubs are interconnected. The results in Figure 15 show that for high connectivity among hubs, robustness is better for random disruptions than targeted disruptions. In targeted disruptions with high levels of interconnectivity, the loss of central nodes reduces the robustness. In random disruptions, the high levels of hub interconnection provide alternative pathways and a higher robustness score.
Simulated patterns with less connectivity among hubs were found to be more robust against targeted attacks than patterns with more connectivity. In contrast, under random attacks, patterns with high connectivity perform better. This finding suggests that if there are only a few hubs, then low connectivity between them can reduce the damage from targeted attacks. This applies to any relatively small size network whose degrees do not follow a power-law distribution.
Table 16. Modularity calculations varying the connectivity between hubs

With respect to modularity as shown in Table 16, a lower level of connectivity among hubs improves modularity, whereas high connectivity among hubs reduces the degree of modularity in the simulated networks. The level of connectivity among hubs was found to be an influential parameter, on the basis of the experiments performed. The level of connectivity among hubs has different effects on robustness and modularity. This experimental finding guided the development of the redesign of Type A (Section 8): while it is decided to add a hub (HV Switchboard 3) to the improved design, it was decided that this additional hub would not directly feed the other hubs.
8 Redesign of technical system Type A
In order to demonstrate the value of the new network generator, a redesign of the Type A technical system presented in Section 5 is developed. The redesign of Type A was driven on the experimental results achieved in Section 7. The experimental findings of Section 7.2.2 indicated that the addition of one HV SWBD would improve the robustness of the architecture, whereas the findings of Section 7.2.3 imply that the reduction in the number of sources (density of hub) may be an acceptable trade-off. Section 7.2.5 proposed three alternative independent paths between sources and sinks for the power function. The experimental findings of Section 7.2.6 suggested that the additional hub (HV Switchboard 3) should not be connected directly to the other hubs (HV Switchboards 1 and 2). Following the experimental findings, the Type A redesign proposal includes one additional HV SWBD and reduced the total number of DGs from four to three. The redesign of Type A is shown in Figure 16.

Figure 16. Technical network Type A redesign.
Table 17. Modularity calculations for Type A and Type A redesign technical systems

The redesign of Type A was developed without changing the total number of system components (one HV SWBD was added and one DG removed) to allow a comparison of networks of the same size. For the Type A system, the cost of a DG was higher than the cost of an HV SWBD, which means that the Type A redesign is a cost-improved solution. Moreover, the Type A redesign involves hub patterns of a single-source DG supplying power to an HV SWBD hub. This is advantageous as electrical synchronisation problems can be avoided by having only one DG supply for each HV SWBD (not two DG supplies to one HV SWBD). The simpler source–hub pattern would improve integration time and cost. The redesign of Type A was discussed with experts, who verified that the Type A redesign is a rational and feasible solution.
The results (Figure 17) show a graceful degradation of robustness compared to the original Type A under targeted central component attacks and also an improved robustness under random attacks.

Figure 17. Robustness calculations for Type A and Type A redesign technical systems.
However, the modularity results in Table 17 show that the redesign of Type A has a lower degree of modularity.
Previous designs and expert opinions typically influence decisions on the number and the connectivity of the components, defining the system architecture, during the initial design phase. Such decisions have a significant impact on the time of development, system costs and robust behaviour. Typically the robustness of the system is assessed for the design chosen, not for alternative options, and a detailed analysis takes place at the later stage of the design process when more information is available. Type A redesign demonstrates the value of the novel network generator to support exploratory and analytical approaches during the initial system design phase.
9 Reflections
In the design research literature, scholars have simulated networks and compared them with the original examples in order to identify areas of improvement. Piccolo et al. (Reference Piccolo, Lehmann and Maier2018) developed two null models: one that conserves degree distribution and a second that preserves the number of edges but redistributes them randomly between nodes. In contrast, the network tool proposed in this article focuses on a different aspect, namely, the simulation attempts to preserve structural patterns (e.g., cyclical pattern) and features (e.g., hubs). It should also be noted that hubs are identified in the network not simply because they have degree but because their degree is high relative to their neighbours. In the case of networks without the power-law degree distribution seen in preferential attachment, this relative measure is suggested to be more appropriate.
Comparing the simulated networks that the generator produces against the range of technical networks exhibited in the recent work of Walsh et al. (Reference Walsh, Dong and Tumer2019), it is demonstrated that the generator populates networks that share attributes of other existing technical systems. It is observed that the technical networks reported in Walsh et al. (Reference Walsh, Dong and Tumer2019) exemplify instances of the artificial models proposed in this article. Focusing on the component-based networks reported in Walsh et al. (Reference Walsh, Dong and Tumer2019), it is observed that the bicycle drivetrain has a cyclical hub with hubs linked to paths, and the automobile drivetrain has a path as a backbone with a bus-modular hub. The aircraft network has a hybrid structure with a path backbone and hubs that are generally integral, but there is also a level of interconnection between hubs (around 25% here).
A limitation of this study is that the robustness problem that is examined in this article relates to the immediate instance after a disruption and does not include the dynamic aspects of robustness concerning error propagation and spread. Future works could adapt the generator to dynamically assess robustness. Moreover, the generality of the proposed network generator remains to be further investigated. Future research will also include applications of the generator in different technical system contexts for evaluation and validation purposes.
10 Conclusion
This article presented a network generator as a tool to analyse and improve robustness of system architectures. The methodology in the article assessed the level of the robustness and modularity of two naval engineering system architectures and various simulated networks. The application of the generator included experiments investigating the effects of variance of its parameters on robustness and modularity. The experiments focus on varying parameters of the cyclical main structure pattern as the configurations resembled the two naval systems.
The proposed generator can help the system architect to develop a set of candidate theoretical system architectures at the initial design stage, prior to the development of detailed simulation or prototype models, by motivating novel paradigms and informing analysis. In theory, the network generator can stimulate the creation of intentional complexity in the structure of systems, by populating complex networks with identifiable patterns and features. The ability to demonstrate early evidence of compliance with the design requirements also provides an additional benefit for system architects.
Acknowledgments
The authors would like to thank Willi Galloway, Senior Power and Propulsion Engineer, for his invaluable input on the development of this article. The views expressed in this article are those of the authors and do not represent the views of BAE Systems.
Funding
This work is funded by the University of Strathclyde and BAE Systems Surface Ships Ltd PhD scholarship; University of Strathclyde.
Appendix A

Figure 18. Type A – design structure matrix.
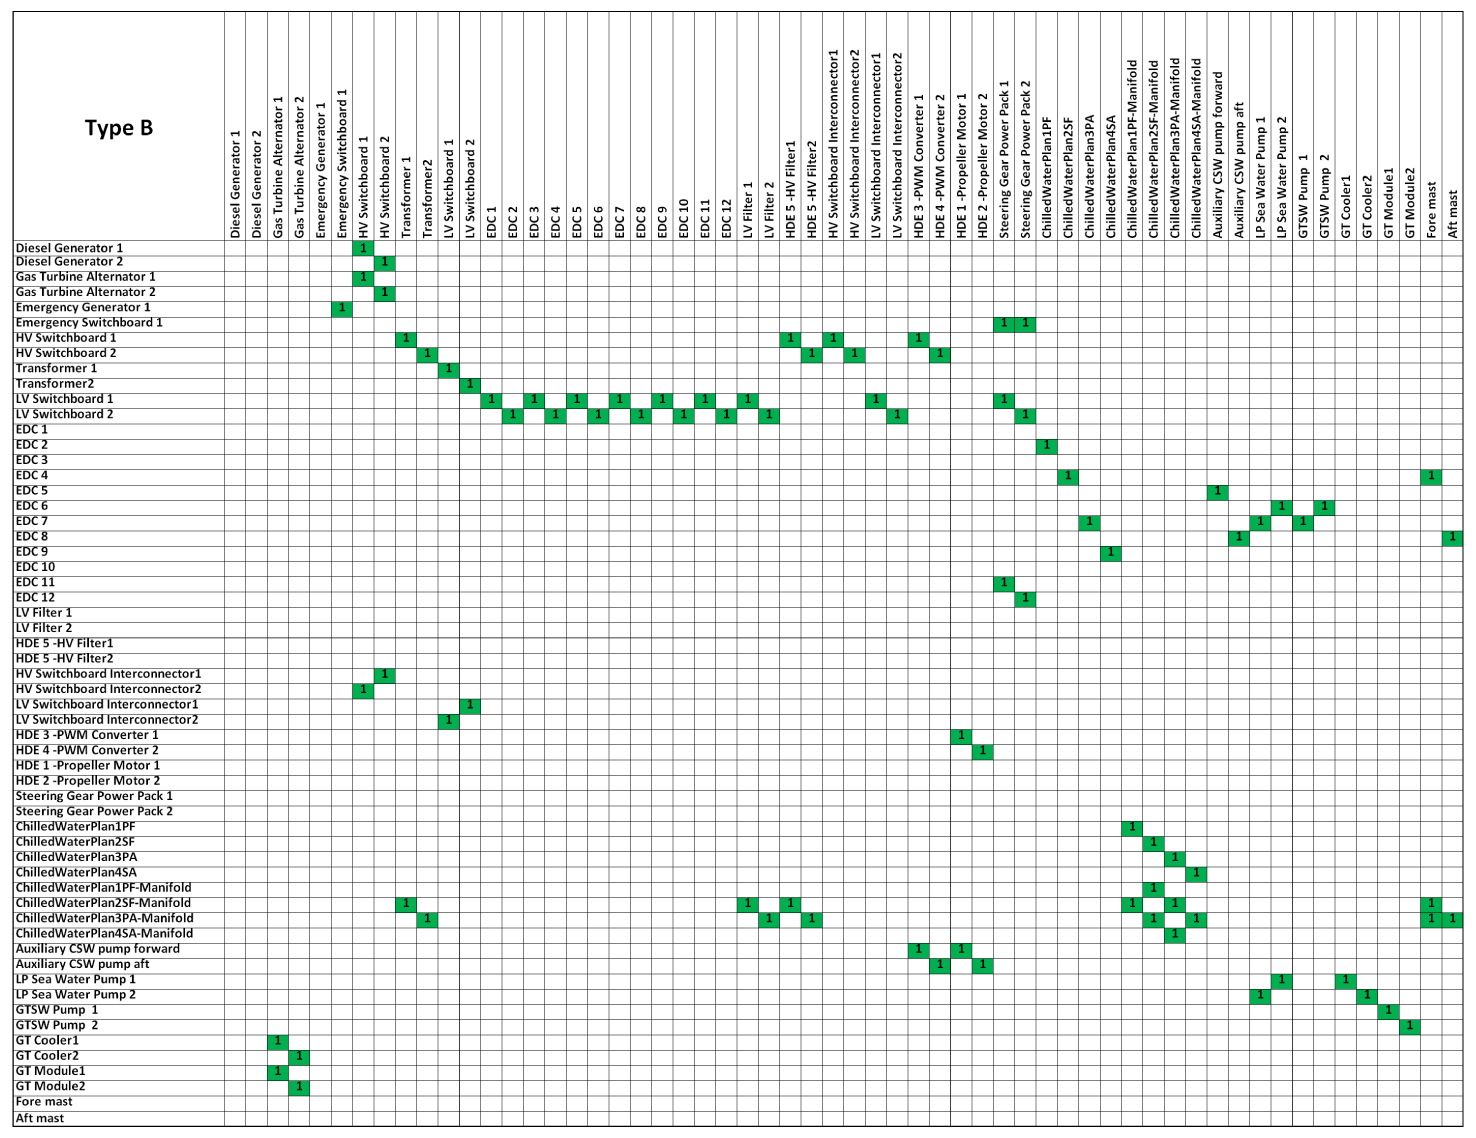
Figure 19. Type B – design structure matrix.
Appendix B
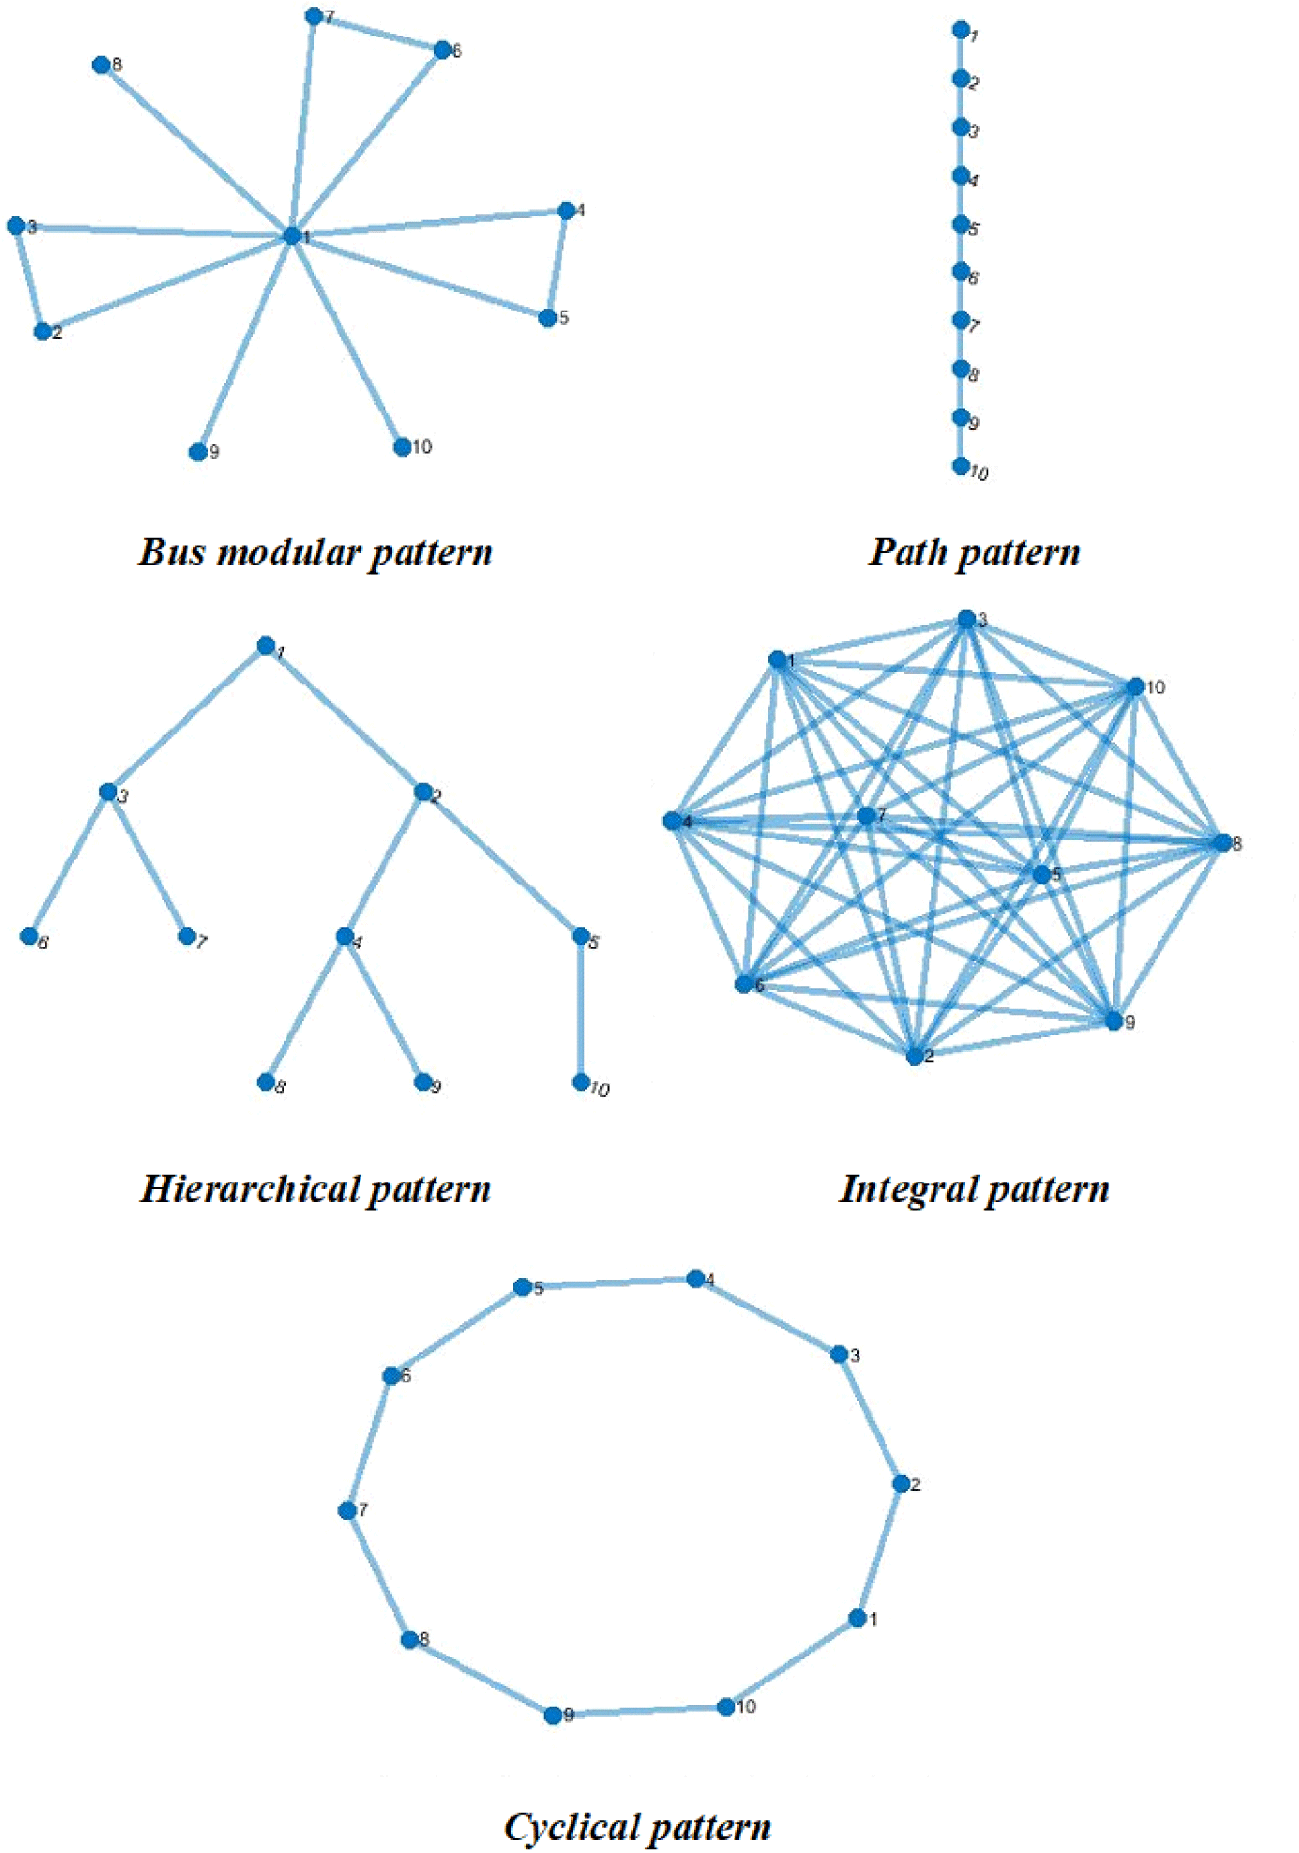
Figure 20. Examples of the main structure pattern options (parameter 2 network generator).


 Open access