


INTRODUCTION
World Politics is a quarterly journal founded in 1948. It publishes scholarly articles that speak to central debates and concerns in comparative politics and international relations. The journal publishes pieces that significantly advance theoretical debates, contribute original empirical knowledge, and deploy the most appropriate methods for the question at hand.
The journal relies on a terrific and small staff. It is run by a dedicated editorial committee with the advice of a diverse and committed editorial board. Moreover, it relies on the good will and collegiality of scholars who volunteer their time to review our manuscripts and advise us in our triple blind review process (described in detail in the conclusion). For this we are enormously grateful as the strengths of the journal rely on this talented and extended team of scholars and staff.
While there is much to be proud of, we are also concerned about the issues raised by Teele and Thelen (Reference Teele and Thelen2017), who clearly demonstrate that the preponderance of articles published in political science journals are written by men. This is also true of World Politics. The World Politics editorial committee, therefore, was eager to assess the review process with an eye toward identifying if and where gender bias was in play. We did so with utmost commitment to the anonymity of the authors and reviewers. We tallied the data to analyze the front and back ends of the review process—from submissions to review to acceptance.
The punchline is fourfold. First, men publish the lion’s share of articles in World Politics. Second, at World Politics we did not identify a gendered bias in the acceptance rates for solo-authored pieces. Men and women submitting solo-authored manuscripts have an equal likelihood of receiving an accept after being sent out for review; the rate of acceptance among reviewed manuscripts is 7.4% for both Solo Man and Solo Woman manuscripts. Third, we did identify notable variation in acceptance rates for coauthored articles. Among the pool of manuscripts that were sent out for review, coauthorship among single gender teams coincides with lower acceptance rates than both the overall acceptance rate and the acceptance rate for mixed gender teams. Teams of men and women have the greatest acceptance rates, while all women-teams have the lowest. None of the differences in acceptance rates are statistically significant based on tests conducted using several multiple logistic regressions. Fourth, withdrawal rates are highest among submissions by a solo man.
This report is organized as follows. We share descriptive statistics (and how we conducted the study). We then assess the editorial process with the aid of a range of regressions, including an in-depth look at manuscript outcomes and reviewer recommendations. This is followed by a discussion of submission rates by gender. We conclude with lessons drawn and challenges that remain for the profession at large.
DESCRIPTIVE STATISTICS
This section provides basic summary statistics for the manuscripts World Politics received between December 2007 and 2017.Footnote 1 Decision information for the manuscripts comes directly from World Politics records. We gathered data on gender and professional rank for authors and reviewers. Since World Politics has not historically asked authors and reviewers to identify their gender and rank, we individually determined gender and rank based on information that scholars posted online.Footnote 2 Gender coding was based on pronoun, picture, or name. We calculated rank as the number of years between PhD year (for the author with the most experience) and the date of the manuscript submission.Footnote 3
We categorized manuscripts into five groups based on the composition of authors. The first category, Solo Man, is assigned when a manuscript is authored by a single man. Likewise, the second category, Solo Woman, is assigned when a manuscript is authored by a single woman. Multiple Men and Multiple Women are assigned for manuscripts with two or more authors, all of whom are male or female, respectively. Finally, Multiple Mixed, is assigned for manuscripts with multiple authors, at least one of whom is a man and at least one of whom is a woman.
Table 1 provides the total number and share of submissions and acceptances for each type of manuscript. The data pool for table 1 includes all manuscript submissions for which decision data and gender information on all authors was available; accordingly, we excluded those manuscripts which are still under review and/or manuscripts where we could not identify the gender of the author(s).Footnote 4
Table 1 Manuscripts by Gender of Authors, 2007–2017
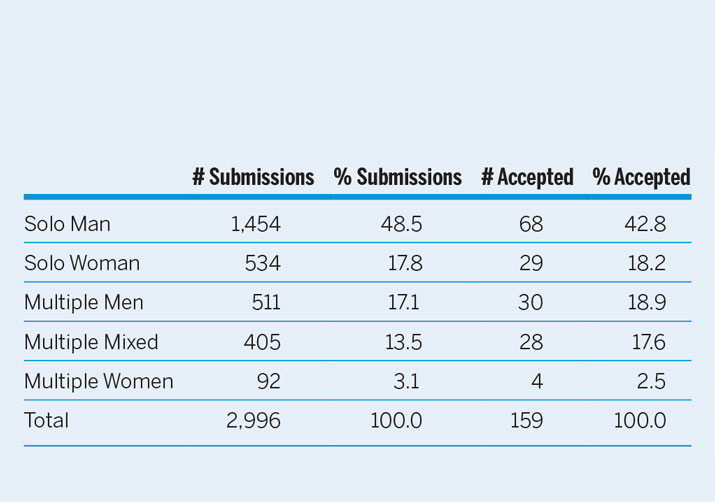
Note: The rows are listed to reflect highest to lowest number of submissions.
Across the five manuscript types, the percentage of submissions is broadly similar to the percentage of acceptances. The share of Solo Man and Multiple Women manuscripts are slightly underrepresented in the share of acceptances relative to their share of submissions. In contrast, Solo Woman, Multiple Men, and especially Multiple Mixed manuscripts have slightly higher shares of acceptances than submissions. This said, when looking at absolute numbers, it is notable that there is an imbalance in terms of who is submitting articles for review. Single authors (66.4%) submit the majority of manuscripts, and within this category Solo Man is by far the most frequent type of submitted manuscript and accepted article; nearly half of all submissions are by a solo male author. The second largest share of manuscripts are submitted by solo female authors, making up nearly 18% of all submissions in the sample. Close behind, are Multiple Men manuscripts, which make up 17.1% of all submissions. Multiple Mixed manuscripts are 13.5% of all submissions. Very few manuscripts are submitted by teams of all women (3.1% of submissions). Thus, there is a considerable gender imbalance in submissions. Manuscripts by one or several men make up 65.6% of total submissions (61.6% of acceptances), while manuscripts by one or several women make up only 20.9% of total submissions (20.8% of acceptances).
Because the review process includes multiple decision points, we provide summary statistics for each stage. In the regression analysis in the following section, we discuss the data in terms of whether manuscripts were withdrawn or reviewed and then whether they were accepted or rejected, conditional on being sent out for review. Table 2 provides a detailed breakdown of the submission and decision data for manuscripts in each author category. Withdrawn manuscripts are those that editors on the editorial committee decide not to send out for review, after having looked internally at the manuscript. Rejected manuscripts are those that are sent out for review (generally including at least two external reviewers) and are rejected either after the first review or after the revise and resubmit review process. Accepted manuscripts are those that were sent out for one or more review cycles and accepted at the end of the review process. For the purpose of the analysis here, acceptance or rejection at any stage of the review are treated the same. That is, in this analysis a manuscript rejected after initial review is equivalent to a manuscript that is rejected after a Revise and Resubmit. The third, fifth, and seventh columns in table 2 provide the percentages of submitted manuscripts for each manuscript type that are withdrawn, rejected, or accepted, respectively.
The takeaway message from table 2 is that the acceptance rates among solo authors is similar regardless of gender, while there is some variation in acceptance rates among multiple author manuscripts of different gender composition.
Table 2 Manuscript Outcome Based on Gender, 2007–2017
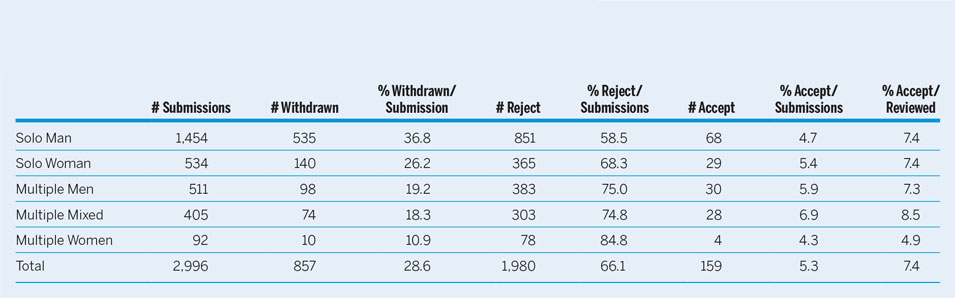
The takeaway message from table 2 is that the acceptance rates among solo authors is similar regardless of gender, while there is some variation in acceptance rates among multiple author manuscripts of different gender composition. Multiple Mixed manuscripts fare the best, with the highest acceptance rates substantially above the overall acceptance rates. Multiple Women manuscripts are the least likely to be accepted either overall or as a share of articles reviewed. After that, the ranked order of acceptance shifts depending on the denominator. When we look at all submissions, the acceptance rate favors in declining order: Multiple Mixed, Multiple Men, Solo Woman, Solo Man, and Multiple Women. When we look only at reviewed submissions, the acceptance rate is best for Multiple Mixed, a tie for Solo Man and Solo Woman, a very narrow drop for Multiple Men, and then a significant drop for Multiple Women. Stated otherwise, once withdrawals are excluded (discussed next), the rates for Solo Man, Solo Woman, and Multiple Men manuscripts are virtually the same.
Table 2 also tells us something about manuscripts that are not accepted (including withdrawals and rejections following review). Solo Man manuscripts are withdrawn at the highest rate (36.8%) and are rejected at the lowest (58.5%). At the other extreme, Multiple Women manuscripts are withdrawn at the lowest rate (10.9%) but rejected at the highest rate (84.8%). Notably, when one combines withdrawal and rejections rates, the differences between Solo Man and Solo Woman submissions washes out, as both have approximately 5% chance of being accepted, relative to all submissions. We further examine the statistical significance of selected differences in the next section with a regression analysis.
GENDER AND THE EDITORIAL PROCESS
Manuscript Outcomes
The summary statistics presented above suggest minor overall differentiation in the rates of withdrawal and acceptance by manuscript type—and raise notable concerns for multiple women author teams. In this section, we test these differences for statistical significance in a regression context. Table 3 reports six logistic regression models.Footnote 5 In the first three, the dependent variable is equal to 1 if the manuscript was sent out for review (not withdrawn). In the remaining models, the sample includes only manuscripts that were sent out for review. The dependent variable is equal to 1 if the manuscript was accepted, and is 0 otherwise. The first four independent variables are indicator variables for each of the manuscript author-types. The Solo Man manuscripts are used as the primary reference category, while the third and sixth models use Multiple Men manuscripts as the reference. Several models also include the rank variable measured by the number of years between PhD (for the most experienced author) and manuscript submission. If no author with available data has a PhD, the rank is equal to 0. We report model coefficients in odds and p-values in parentheses.
Table 3 Logit Estimates in Odds Ratio, 2007–2017
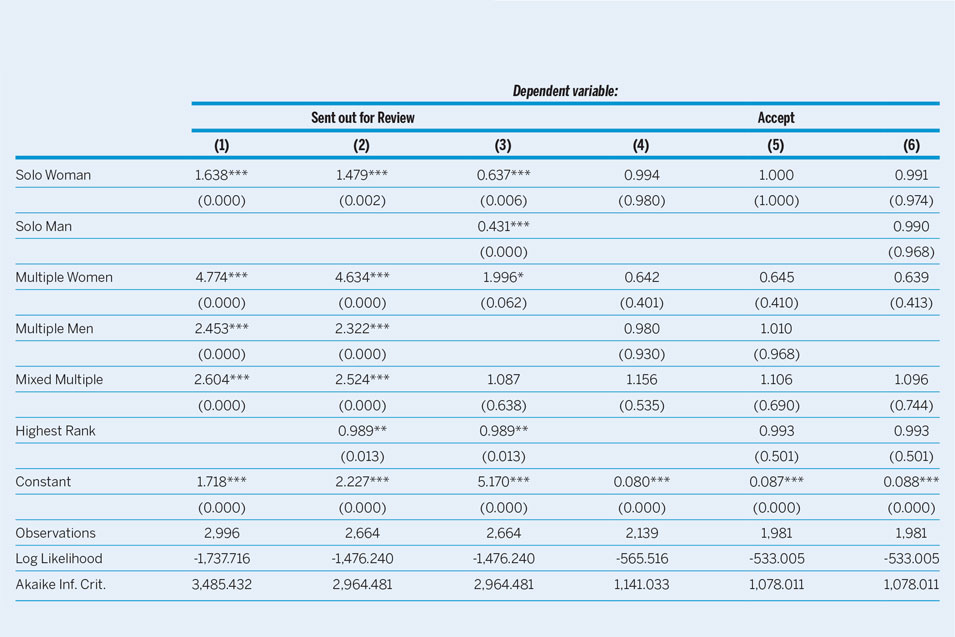
Note: *p<0.1; **p<0.05; ***p<0.01
The choice of regressions reported relies on the assumption that the best comparison to make in order to assess bias against women in the review process is to compare (1) manuscript outcomes for single-authored works for men versus single-authored women and (2) multiple-authored works by teams of men versus teams of women. We discuss the results beyond these comparisons, but these comparisons are the primary benchmark we use to test for bias.
In terms of addressing the question of potential bias against women in the review process, the most important results to highlight are the coefficients in the first row of table 3 for models 1, 2, 4, and 5 and the third row for models 3 and 6. Solo Woman manuscripts are more likely to be sent out for review than Solo Man manuscripts. They are slightly less likely to be accepted; this result is not significant and disappears in model 5.Footnote 6 When we compare the outcomes for teams of all women versus teams of all men (models 3 and 6), we find that the odds of teams of all women being sent out for review are two times the odds that manuscripts by teams of men will be sent out for review. In terms of acceptance rates, manuscripts by all women are accepted at a substantially lower rate than manuscripts for teams of men, once they have been sent out for review; this result, however, is not statistically significant. There is no evidence of bias against women in either stage of the review process, according to these tests.
When considering manuscript author-type, the results in table 3 further suggest that Solo Woman, Multiple Women, Multiple Men, and Multiple Mixed are more frequently sent out for review relative to Solo Man manuscripts. Manuscripts by multiple women are most likely to be sent out for review. These results do not change substantially when we control for the rank of the most experienced author.
Once manuscripts have been sent out for review, any differences in acceptance rates between different manuscript types and Solo Man manuscripts are not statistically significant. In terms of magnitude, manuscripts by multiple women are substantially less likely to be accepted than Solo Man manuscripts, but this result is also not significant. Multiple Mixed Manuscripts are slightly more likely to be accepted than Solo Man, but again this result is not significant. Controlling for rank does not change the results substantially.Footnote 7
These results further suggest that both Solo Man and Solo Woman manuscripts are less likely to be sent out for review, while manuscripts by teams of all women or of mixed gender are more likely to be sent for review than teams of men. Again, at the reviewer stage, none of the differences in acceptance rates among reviewed manuscripts are significant. Mixed teams fare slightly better than teams of men in terms of acceptance, but the difference is not significant.
Reviewer Recommendations
We now examine the recommendations made by individual (anonymized) reviewers to examine if these recommendations systematically vary depending on either the author-type of the manuscript or the gender of the reviewer. Importantly, reviewers undertake reviews without learning the name or gender of manuscript author(s). To preview our findings, there is no statistical evidence that reviewers recommend rejections more frequently for single-authored manuscripts by women versus men. Likewise, reviewers do not appear more likely to recommend a rejection for multi-authored manuscripts by all women relative to manuscripts by teams of all men. Reviewers are slightly less likely to recommend a rejection for teams with multiple authors of either mixed gender or all men compared with single authored manuscripts by men. Reviewers are slightly more likely to reject Solo Man and Solo Woman manuscripts (compared with teams of multiple men). The gender of the reviewer does not appear to have any significant effect on the recommendation. This result holds when we interact reviewer gender with author-type.
To preview our findings, there is no statistical evidence that reviewers recommend rejections more frequently for single-authored manuscripts by women versus men.
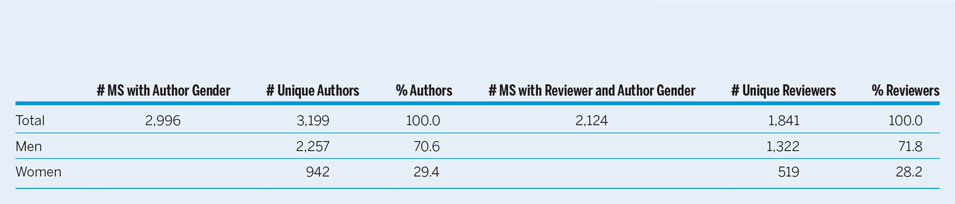
Before providing a more detailed account of the regression results we discuss the data used in this section and provide several descriptive tables. This section examines reviewer decisions. Table 4 provides background summary information for this data, as well as summary information on individual authors (who might submit one or more manuscripts in our dataset). There are 2,996 total unique manuscripts for which we have author gender information and a final decision outcome. There are 3,199 unique authors who collectively submitted these manuscripts. Some manuscripts are submitted by multiple authors and some authors submit multiple manuscripts. Just under 30% of all unique authors are women. Because many manuscripts are withdrawn in the first stage of the editorial process, the pool of manuscripts with associated reviewer information is a subset of all manuscripts. In our data, there are 2,124 unique manuscripts with final decisions that have gender information for authors and at least one of the reviewers. We have gender information for 1,841 unique reviewers associated with these manuscripts. Of the pool of reviewers, 28.2% are women. Women comprise a comparable share of authors and reviewers in this dataset.Footnote 8
Table 4 Manuscripts, Author, Reviewer Breakdown, 2007–2017
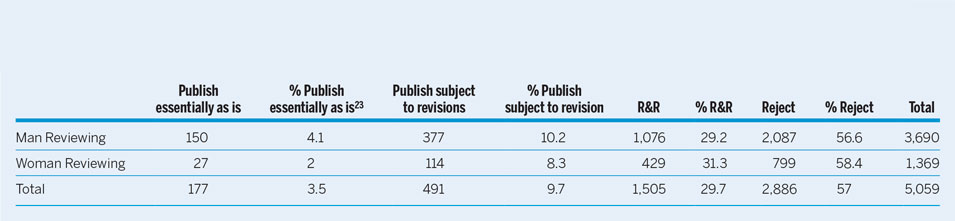
Next, we examine the distribution of reviewer decisions by reviewer gender. The unit of analysis in table 5 and in the regression analyses below is each reviewer decision on each manuscript. Thus, observations are unique at the manuscript-reviewer level. We examine the recommendations that reviewers make on the first submission only; we do not examine the decisions on revision submissions, although we have done this elsewhere and the results are consistent with what we report here.Footnote 9 Reviewers have four possible recommendations they can make: (1) Publishable essentially as is, (2) Publishable subject to revisions, (3) Revise and Resubmit, and (4) Reject. Table 5 summarizes the recommendations by the reviewer gender. In general, men and women provide similar shares of each recommendation type. Men tend to recommend “Publish essentially as is” and “Publish subject to revisions” slightly more frequently than women; women recommend “Revise & Resubmit” and “Reject” slightly more frequently.
Table 5 Reviewer Decision Breakdown by Reviewer Gender, 2007–2017
To test these differences as well as examine possible variation in reviewer recommendation by manuscript author-type, we estimate several logistic regression models.Footnote 10 In each of the models, we use a binary outcome variable that is equal to 1 if the reviewer recommends that the manuscript be rejected and 0 if any of the other three possible recommendations are made that would keep the manuscript “alive.” The manuscript author-types are the same as those used in the earlier regressions. We include an indicator variable that is equal to 1 if the reviewer is a woman. In the first two models, we examine the independent effect of reviewer gender, manuscript author-type, and rank of the most experienced author on the reviewer’s recommendation. In models 3 through 5, we also interact the gender of the reviewer with the author-type and rank. Models 1 through 4 use Solo Man manuscripts as the reference category, while model 5 provides the full specification using manuscripts authored by teams of men as the reference category.
Table 6 indicates that women reviewers do not recommend rejections more frequently than reviewers who are men. This result holds regardless of the author-type of the manuscript.Footnote 11 In terms of differences in recommendations based on the author-type of the manuscript, we find that Solo Woman manuscripts are slightly less likely to receive a reject recommendation than Solo Man manuscripts, but the difference is small and not significant (coefficient on Solo Woman with Solo Man as reference category is 0.939, in model 1). Reviewers are also less likely to recommend the rejection of multi-authored manuscripts by teams of all men (0.846) or mixed-gender teams (0.792) than Solo Man manuscripts; these differences are statistically significant. Manuscripts by teams of women are slightly more likely (1.002) to receive a reject recommendation relative to Multiple Men, according to model 5, although this finding is not statistically significant. In general, the results of reviewer decisions corroborate the findings associated with manuscript outcomes.
Table 6 Reviewer Recommendation Logit Estimates in Odds Ratio, 2007–2017
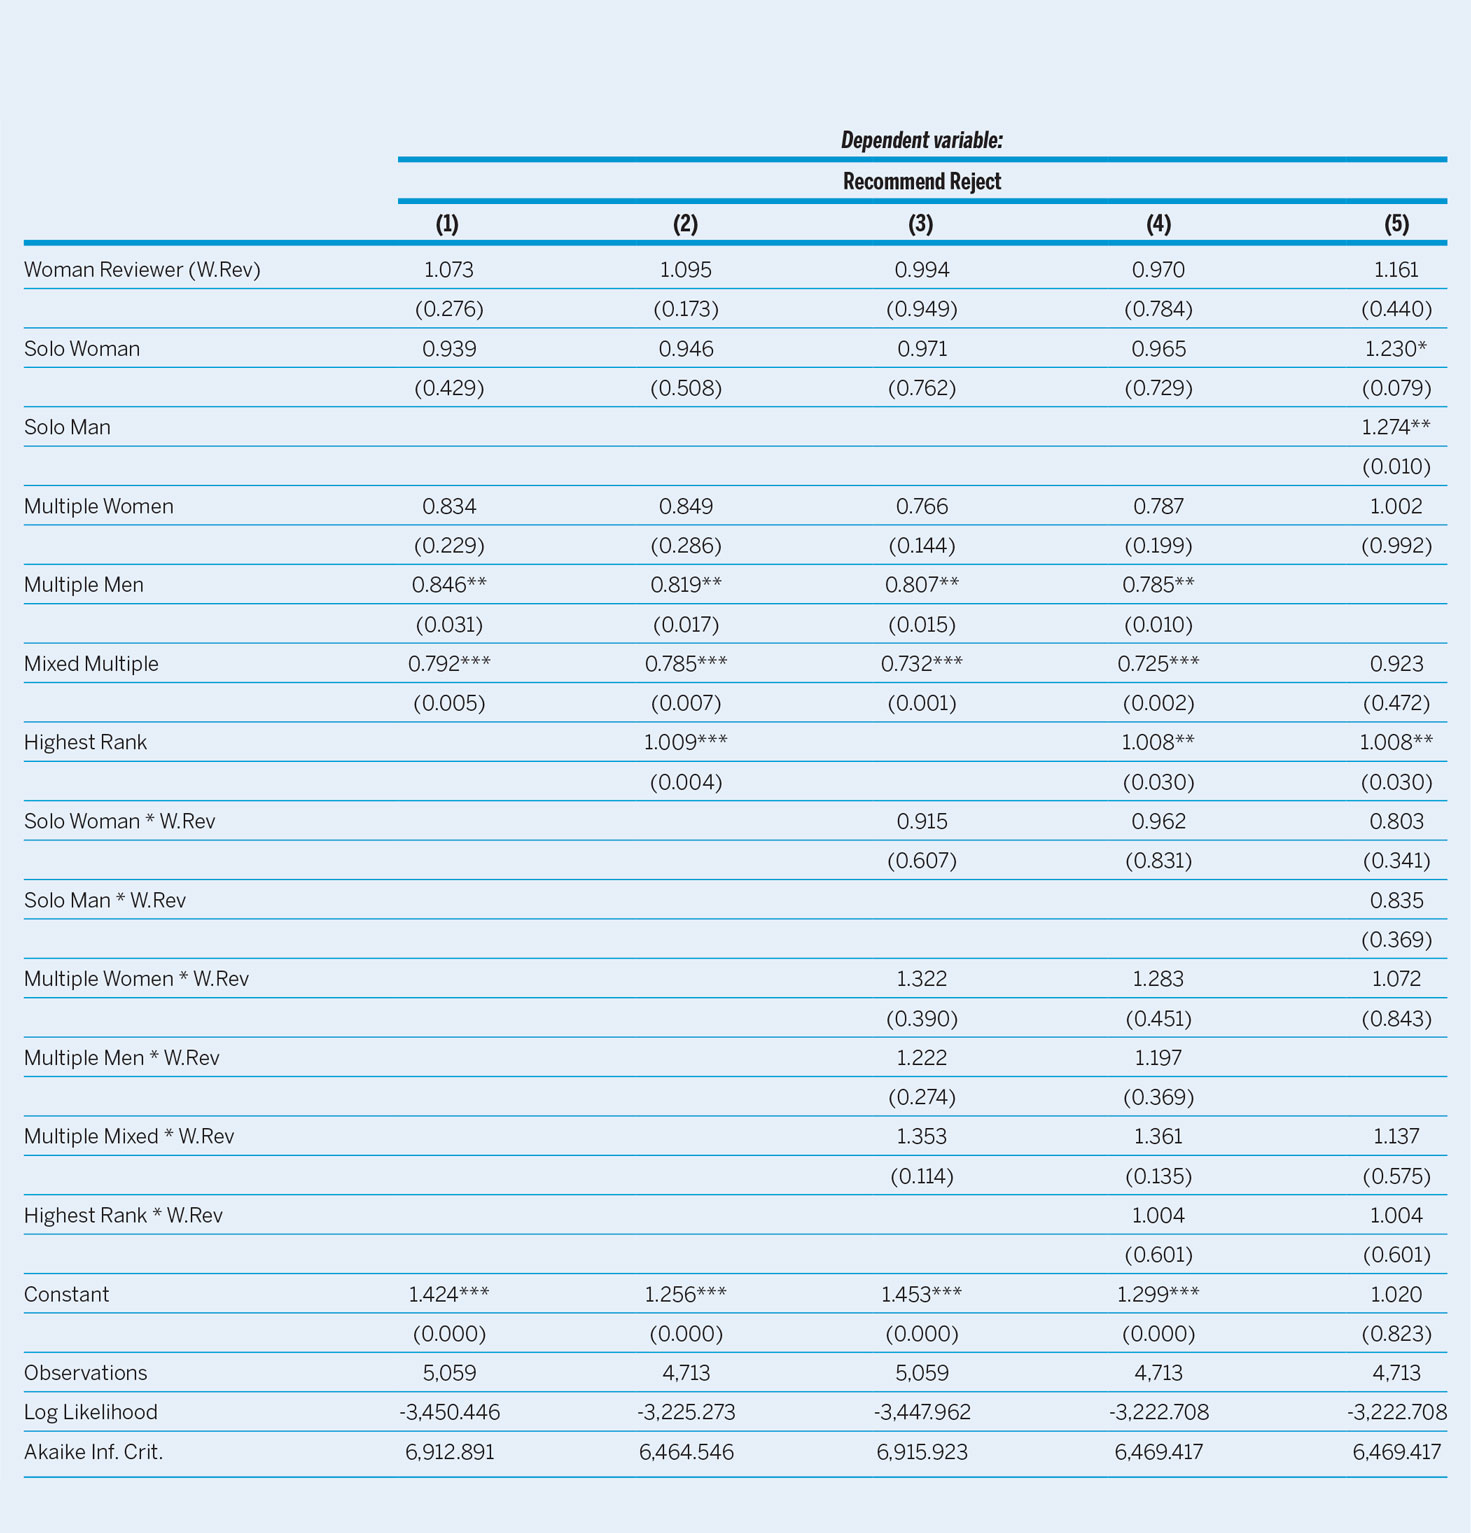
Note: *p<0.1; **p<0.05; ***p<0.01
Interesting to note, we find that the rank, measured in years since PhD of the most experienced author of a manuscript, is positively associated with a rejection recommendation. That is, the more experienced the highest-ranking author, the more likely it is that a reviewer will recommend that the manuscript is rejected; the magnitude of this coefficient is quite small. For completeness, in models 3 through 5 we additionally check for any interaction effects between manuscript type and reviewer’s gender. None of these interaction effects are significant.
GENDER DIFFERENCES IN SUBMISSION RATES
The results above strongly suggest that manuscripts written by one or more women are not systematically less likely to be sent out for review or accepted. This analysis helps us better understand the publication disproportionality identified by Teele and Thelen (Reference Teele and Thelen2017), by suggesting that—at least in the case of World Politics—the problem does not appear to be at the stage of editorial or peer review. The summary data, however, does suggest that part of the problem appears to be a pipeline issue at the stage of submission. The remainder of the report, thus, provides a preliminary look at submission trends through several different cuts of the data. We first look at the data over time, by rank, and then according to cross-rank coauthorship. Most of the data discussed in this section are measured at the manuscript level and, unless otherwise noted, include all observations for which there is both decision information and gender information.
Time Trends
We first examine the time trends in the number of submissions by different author-types. Figure 1 segments the annual submission data into three categories: (1) manuscripts written by one or multiple men, (2) manuscripts written by one or multiple women, and (3) manuscripts written jointly by at least one man and at least one woman.Footnote 12 As the chart demonstrates, and consistent with much of the data discussed above, the clear majority of manuscripts fall into the first category—with the second and third categories submitting at a significantly lower rate. The share of manuscripts in each category is relatively stable over time. There is a slight decline in manuscripts submitted by men and a slight increase in the manuscripts submitted by mixed teams.

Figure 1 Percentage of All Submissions by Manuscript Author Type
In figure 2, we break this data down further into the five author-types featured in the rest of the analysis. The graph helps visualize the problem of the extremely low share of manuscripts that are submitted by multiple women.

Figure 2 Breakdown of Submitted Manuscripts by Author Type
Breakdown by Rank
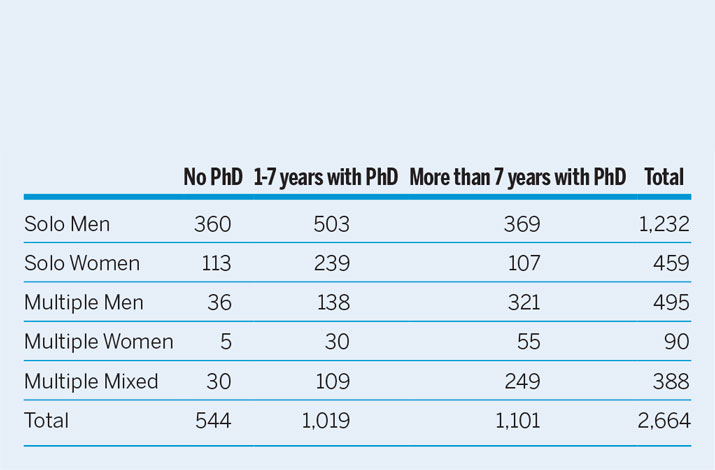
Next, we examine submission data based on the rank of the most experienced authors of a given manuscript. In table 7, we segment rank into three categories (based on available information): (1) the most experienced author does not have a PhD or its equivalent (or earned their PhD in the same calendar year that the manuscript was submitted), (2) the most experienced author earned their PhD between one and seven years prior to the date the manuscript was submitted, and (3) the most experienced author earned their PhD more than seven years prior to submitting the manuscript.Footnote 13 While there is much valuable information within this chart, we highlight just a few characteristics of the data. First, submissions for both Solo Man and Solo Woman manuscripts peak during the earlier years of authors’ post-PhD career. Second, the majority of coauthored pieces, regardless of gender, have at least one senior contributor. Third, at each career stage fewer women submit solo manuscripts than men. At each of the three career stages, men submit 76.1, 67.8 and 77.5% of solo manuscripts, respectively. As a point of reference, in 2014 men represented 60% of graduate students, 61% of assistant professors, 67% of associate professors and 77% of full professors (Teele and Thelen Reference Teele and Thelen2017, 436). Thus, the biggest discrepancy in our 2007–2017 data between representation in the field and in submission rates occurs at the graduate student level. Fourth, graduate students who are women are much less likely to submit manuscripts both as solo authors and especially as teams. Of the 71 manuscripts submitted by teams of only graduate students, only 7% were from teams of all women, while teams of all men represent nearly 51% of these submissions.
Table 7 Submissions by Author Type and Rank, 2007–2017
The data just presented provide a breakdown of gender and experience at the level of manuscript submissions. We can also consider trends at the level of author-manuscript, where each manuscript corresponds to several possible observations, one for each author involved in writing a given piece. In the first panel of figure 3, along the vertical axis, we plot the absolute number of observations in four possible author statuses (solo man, male author with coauthors of either gender, solo woman, and female author with coauthors of either gender). Along the horizontal axis, the counts are disaggregated by the number of years since the author earned their PhD. In the second panel, for each experience level, the share of observations for each author category is plotted.

Figure 3 Author Submission by Experience (Count—Left, Share—Right)
Note: For purposes of chart clarity, we only report authors with 40 or fewer years of experience.
Trends in the submission data based on author experience indicate that the number and share of solo female authors drops precipitously with experience. The absolute number of women submitting with coauthors also declines, but not until experience exceeds six years with PhD. The share of women submitting with coauthors does not decline, it even increases slightly and unevenly among authors later in their careers. The trends look somewhat different for men. Solo-authorship is common among men early in their career. The absolute number of men submitting solo-authored work declines monotonically (first panel). The share of men submitting alone (versus all other categories) decreases between 0 and 15 years of experience but does not vary systematically after that. Moreover, with the exception of several anomalous experience levels, in general, as men stop submitting solo-authored work, they seem to compensate by submitting coauthored work.
We should further probe why fewer women submit to World Politics in the middle and later stages of their academic careers. Since the pool of female scholars shrinks with years of experience and the share of women in political science has increased over time, broader disciplinary trends, including cohort effects, might provide further insight into these patterns (Teele and Thelen Reference Teele and Thelen2017).Footnote 14 It is worth remembering, however, that generational trends in women’s rank and roles in professional political science activities are likely endogenous to gendered dynamics in the submission and publication process. It might also be that more senior women are shifting their publication strategies by submitting articles to a different set of journals and/or focusing on publishing books over articles. Arguably harder to track, research productivity and manuscript submission patterns might also reflect the different and disproportionate demands that women face relative to men in the workplace and at home, as sociological studies might lead one to hypothesize.Footnote 15 Why coauthorship rates by senior women do not increase with seniority (in contrast to male peers), is a question worthy of further analysis, as noted in the conclusion.
Patterns of Cross-Rank Coauthorship
Finally, we examine the patterns of coauthorship across ranks. In table 8 we consider teams of authors with various gender-rank combinations for all manuscripts (with complete gender and rank information for all authors) between 2007 and 2017. In the first and second columns, we examine teams of one or more students (defined as 0 years since PhD at time of submission) and one or more authors who earned a PhD at least one year prior to the date of submission. Each row indicates different gender structures in cross-rank teams. A “W” or “M” indicates that these manuscripts have at least one and possibly more women (W); or at least one and possibly more men in the associated rank position (M). In the third and fourth columns, we repeat the exercise, but using different rank cut-points. Here, junior is defined as anyone with seven years or less since PhD (including students) at the time of submission and senior is anyone with more than seven years since PhD. The second to last row in the table details a count for all manuscripts in which there is no cross-rank coauthorship; of note, cross-rank coauthorship constitutes only 11.1% and 15.7% of all manuscripts, respectively, across the two sets of teams. Thus, the trends discussed in this section are only a small part of the overall submission story. Given space constraints, the following text exclusively discusses the student-PhD coauthored teams, but we refer the readers to table 8 for further data regarding junior–senior coauthor teams.
Table 8 Cross-Rank Coauthorship, 2007–2017
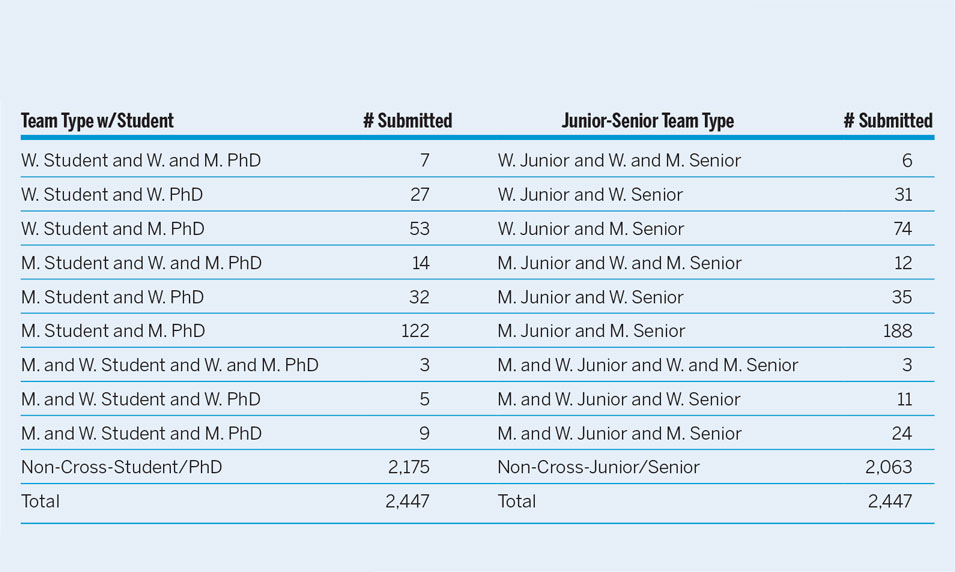
Note: W indicates female and M male.
At the graduate level, it is worth highlighting that more male students than female students coauthor with scholars who already have their PhD (168 teams with one or more male graduate students versus 87 teams with female graduate students, not including teams with male and female students). Thus, teams with female graduate students are 34.1% of these cross-rank coauthorships in World Politics submission data, but women are about 40% of graduate students.Footnote 16 Our data indicate that men and women with PhDs may show preference for coauthoring with students of their same gender. Of teams where the more senior scholar(s) is a woman, 45.8% are with one or more female students, while 54.2% are with one or more male students (again excluding teams with male and female students). If we assume for the sake of this comparative exercise that there is only one student and one advanced scholar on each team, then senior women tend to over-select female graduate students for coauthorship since the latter are only 40% of graduate students.Footnote 17 Likewise, of teams where the more senior scholar is a man, 30.3% are with one or more female students, while 69.7% are with male students; in these teams, male graduate students tend to be over-represented (as men are estimated to compose 60% of political science graduate students) while female graduate students are under-represented.
If World Politics submissions trends are consistent with other journals, the cross-rank coauthorship patterns may suggest several reasons that female students (and junior scholars) participate in fewer cross-rank submissions than their male counterparts: male mentors might not equally seek them out as coauthors; female mentors (who slightly favor them as coauthors) might submit fewer articles than their male peers; and lack of gender parity on faculty might amplify these uneven mentoring/coauthorship patterns.Footnote 18 In light of these data and other research on mentorship, further investigations into mentorship, professionalization and networks may be one of several important avenues for redressing overall underrepresentation of women in journal submissions and publications.Footnote 19
To counteract the disproportionately low number of publications, we need not only to shine a spotlight on the editorial review process but also to redress why women are submitting at lower rates.
CONCLUSION
Gender bias remains a serious concern in the profession. The World Politics editorial community, concerned about these issues, was eager to review the data, and will continue to be vigilant and attentive to biases in the publication process. In these concluding comments, we identify longstanding editorial processes that we believe have helped to minimize bias, highlight areas where we have initiated some changes, and end with some suggestions about challenges and next steps for the profession at large.
At World Politics, we have long maintained an editorial process designed to minimize the biases that exist. First, World Politics follows a strict triple-blind review process for research articles. Editors do not know the names of authors until a final decision is rendered; reviewers are not told (and should not know) the names of authors; and authors are never told the names of reviewers. This triple-blind review process is core to our mission. We believe that it helps to counteract some of the biases that exist in the field—not only for gender but also for rank, race, and friendship networks. Second, like many other journals, we make decisions by committee. This dynamic has allowed us to draw on diverse expertise that informs our review process and final decisions. Such a committee, if diverse in its composition (intellectually, methodologically, in terms of gender, alongside other dimensions) should also check against some biases, although arguably it might also lead to group think. It is for these reasons that our committee takes external reviews so seriously—both to inform our review and discussion. That said, we do not presume that these procedures and rules guard against all biases. It remains to be seen whether there is something subtler at work. Since we were not able to conduct a text analysis or experiments, we cannot say if the content of the reviews varies across gender; the content might vary, and that is something worth assessing—either if gender shapes the types of reviews one writes and/or how an author or editorial committee member evaluates the reviews that they receive.Footnote 20
In addition to our longstanding review practices, we recently made two changes. First, we revised our author and reviewer guidelines to make clear to all scholars what we expect at the submission and review stage. In doing so, we hope to provide a more level playing field for all concerned. In that process, we highlighted, among other things, that we expect authors to pay attention to citation practices, which have historically underrepresented women.Footnote 21 Second, with an eye towards tracking gender biases, we have also revised our data collection process, asking authors to identify their gender (moving beyond binaries—which we have used in this analysis for lack of an ability to use more nuanced categories). We hope this will allow us to better track gender questions. Going forward, we will also consider how best to track race/ethnicity and methods. Some of our colleagues have identified that methods might explain (or compound) some of the bias that occurs, although we have no basis for currently engaging in this important discussion given a lack of data.
Finally, this report highlights how important pipeline and mentorship issues are to the profession at large. To counteract the disproportionately low number of publications, we need not only to shine a spotlight on the editorial review process but also to redress why women are submitting at lower rates. Examining the submissions data for World Politics, we found that women are submitting at lower rates, whether solo or coauthored. Female students and junior women submit fewer collaborative pieces than their male counterparts, and this submission disparity is seemingly more pronounced than women’s under-representation among graduate students and assistant professors. Trends in author submissions suggest that the gender disparity generally increases as scholars advance in their careers. While both men and women submit solo pieces with less frequency as they progress in their careers, men appear to compensate by shifting to coauthored work.
Our findings suggest that understanding and addressing these submissions deficits would benefit from future research in several areas—research that focuses not only on the journal process but also on trends within the discipline at large. Based on our analyses, we highlight five such avenues for future research. First, we need to ask under what conditions mentorship might not only result in coauthorship but also encourage women to submit their work more frequently for publication. Second, as coauthorship becomes more prominent and prevalent in the field, a trend highlighted by Teele and Thelen (Reference Teele and Thelen2017), we must also investigate both the conditions fostering greater collaboration as well as if women are equally credited for coauthorship, since these types of evaluations affect decisions about promotion, salary, and leadership.Footnote 22 Third, we should further analyze if women scholars tend disproportionately to deploy certain methods that impact their journal submission and publication rates. Fourth, future work should investigate the relationship between women’s submission rates (over the course of their career) and their broader structural conditions at work and home—including a lack of gender parity among faculty, work environment, and disproportionate family responsibilities. Finally, this work should be attentive to the ways in which race and ethnicity may affect and even compound gendered inequalities.
We are eager to continue to work on these editorial and broader professional questions. We applaud APSA’s current efforts to address these pipeline and career trajectory questions, which are so critical to our understanding of these patterns in the discipline as a whole.
ACKNOWLEDGMENTS
This was a collective effort. The World Politics editorial committee was keen on reviewing our data, and we asked Carissa L. Tudor to assist us in doing so. We are grateful to her for the outstanding expertise, skill, dedication, and insight she brought to this project. We thank the World Politics team (Joy M. Scharfstein, executive editor, and Joan K. Hsiao, editorial assistant) for their time and effort in providing access to the data and maintaining anonymity for authors and reviewers. We thank our colleagues at ScholarOne for working with us to download the relevant data. We finally thank a team of dedicated research assistants (Erin E. Nurre, Galen M. Ogg, Helena H. Tenev, Jeffrey Kuan, Douglas Wallack, Robbie von der Schmidt, and Sarah Yashar-Gershman) for their help in coding the data. Coders were not told what the names represented and had no way of knowing if the names were associated with reviewers or authors. Tudor and Yashar only worked with the anonymized data and did not see the individual names that were entered into the data set.


