

1. INTRODUCTION
Europe and the USA are developing plans named Single European Sky Air Traffic Research System (SESAR) and Next Generation Air Transportation System (NextGen) to transform the processes of Air Traffic Management (ATM). These will improve safety and efficiency, and match predicted increases in air transportation demand. They use advanced networking technology updated with information from satellite navigation and digital non-voice communication. The strategic goal, envisaged for 15–20 years hence, is a new ATM paradigm. Aircraft using advanced Flight Management Computer Systems (FMS) would fly on Four Dimensional-Trajectories (4D-Trajectories), incorporating altitude, position, time, and other aircraft positions and vectors (SESAR Consortium, 2007). A trajectory representing the business/mission intentions of the airspace users and integrating ATM/airport constraints is determined and agreed for each flight. This produces the trajectory that a user agrees to fly and that the ATM service providers (formally, Air Navigation Service Providers – ANSP) and airports agree to facilitate. These visions will require major changes to ATM safety philosophy and cost tens of billions of dollars/euros.
The present ATM is very different to the 4D-Trajectory concept. Figure 1 is adapted from standard Eurocontrol material. This is now emblematic of the two concepts ‘Clearance-Based Operations’ (CBO) on the left, in which controllers resolve conflicts by vectoring, and ‘Trajectory-Based Operations’ (TBO) on the right, for aircraft flying on the 4D-Trajectory concept.
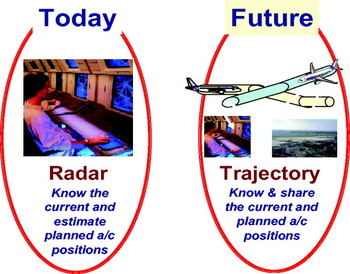
Figure 1. SESAR: The key 4D-Trajectory Paradigm Shift.
The TBO vision would involve extremely large investments from the airline industry and ANSPs. Are there ‘Killer App(lication)s’ (‘Killer Apps’ – jargon for innovations so valuable that they prove the core value of some larger technology) for 4D-Trajectory ATM? Killer Apps generate high degrees of stakeholder technical and financial cooperation by capturing the imagination of business stakeholders. Ironically, most past ATM Killer Apps have improved safety (e.g. modern radar data processing led to collision avoidance systems).
The evidence for Killer Apps has to pass key tests. Killer Apps obviously have to offer enormous benefits to stakeholders. The estimation of these benefits' magnitudes must be ‘obvious’, derived by simple calculations and ideally with robust assumptions, thus not tending to disappear under closer inspection. Wherever possible, the assessment should focus on changes to the current situation rather than attempting to estimate the future situation accurately. The bulk of ATM benefits must not be obtainable through technologically ‘cut down’ non−4D-Trajectory versions. Thus, the analysis here attempts to identify and then size (to no better than the order of a billion euros per annum) the potential TBO ATM Killer Apps, crudely but robustly.
2. DIFFUSION OF INNOVATION: GENERAL
4D-Trajectory ATM is a huge change from the present system. It is an innovation (i.e. a manufactured commercial product etc.), as distinct from an invention, which is some kind of laboratory prototype for the innovation. Getting from the invention to the innovation is a not a trivial process. To quote (Grübler, Reference Grübler1996): “In truth, a realistic history of social and technological innovation would consist mostly of nonstarters.” The main concern here is the diffusion of an innovation; i.e. how long it takes an innovation to be widely implemented.
The research and business literature on the diffusion of innovation is very extensive, so the references used here are mainly examples. (Rogers, Reference Rogers2003) is the classic work on the subject. (Grübler, Reference Grübler1996) is a good summary of work concerning the development of transport and other industrial systems. (Coplan, Reference Coplan2006) is largely concerned with electronics products but makes general points very clearly.
Technological changes are embedded in larger sociotechnical systems: organisations, institutions, markets, decision-making processes etc. (Grübler, Reference Grübler1996) stresses the importance of technological scope, distinguishing four levels:
• Level 1 Incremental improvements.
• Level 2 Radical changes in individual technologies and artefacts.
• Level 3 Changes in technology systems (i.e. combinations of radical changes in technologies combined with organisational and managerial changes).
• Level 4 Changes in clusters and families of technologies and in associated organisational and institutional settings.
The latter levels of changes, particularly for larger system sizes, entail markedly longer diffusion times.
(Rogers, Reference Rogers2003) has identified the important variables determining the rate of adoption of innovations. This checklist is summarised in Figure 2.

Figure 2. Variables Determining the Rate of Adoption of Innovations (Rogers, Reference Rogers2003).
As an example of the use of this checklist, (Coplan, Reference Coplan2006. Exhibit 8) shows how DVDs (Digital Versatile/Video Disc) penetrated the USA market and supplanted VHS tapes. Every factor was in the DVD's favour, so its diffusion was extremely rapid, taking only a few years, in comparison with the decades for aircraft, automobiles, electronics and telephones. TBO would actually score very poorly on these criteria.
3. IS ATM INNOVATION DIFFERENT?
Do general ideas about innovation provide sufficient tools for the analysis of ATM innovation? Historically, aviation developments during World War II drove present-day Air Traffic Control (ATC) concepts. Safety concerns then drove many of the subsequent changes in the ATM system. A comprehensive study (Mozdzanowska and Hansman, Reference Mozdzanowska and Hansman2008) of the dynamics of transition analysed historical cases of system changes, covering technology, infrastructure, policy, and procedure changes as well as implemented, failed, and pending changes addressing safety, security, capacity, and environmental drivers for change. Their conclusions included:
• Role of Crisis Events as a Catalyst for Change. This addresses safety drivers following accidents (catalytic safety events) and has been one of the dominant mechanisms for past system changes.
• Role that Multi-Stakeholder Objectives Play in the Change Process. In multi-stakeholder situations, stakeholders must interact and engage to choose a collective action but when stakeholders are unable to resolve their differences on problem understanding, correct actions and details of implementation, this creates delays to transition.
• Effect that Timing of Solution Development has on the Overall Time Constant for Change. If viable solutions exist when pressure for change manifests then it is more likely that a problem can be addressed (e.g. collision avoidance systems had been under development when warnings of potential mid-air collisions became a leading safety issue).
• Use of Approval and Certification Processes by Stakeholders to stall or Block Change. The complexities of conducting the necessary safety, environmental, and other approval processes can delay change; disenfranchised stakeholders can deliberately use them as a mechanism to block change (e.g. such stakeholders could use environmental approval processes to block operational changes).
Little of the work on ATM system transitions explicitly uses Rogers' ideas or examines diffusion times (Rogers, Reference Rogers2003). An exception is (Kar et al., Reference Kar, Bonnefoy and Hansman2009) which presents an analysis of the worldwide implementation of Reduced Vertical Separation Minimum (RVSM) and states: “In this case, it took 11 years to achieve 67% RVSM coverage. The implementation and diffusion of RVSM was slowed down due to barriers such as the development and deployment of new avionics to monitor aircraft separation and the design of accurate altitude indicators. In addition, there were safety concerns with aircraft wake vortices and interactions with other system components such as Traffic Collision Avoidance System (TCAS) which resulted in an increased frequency of alerts. This procedural change also required the training of air traffic controllers and setting standards when transitioning airspaces to RVSM.”
Referring back to the categorisation in Section 2 (Grübler, Reference Grübler1996), RVSM would be only a Level-2 transition.
Probably the focus of most current ATM research efforts on transition to the adoption of new technologies is developing appropriate strategies to persuade stakeholders to participate in technology transitions. This is evidenced by many of the references quoted in (Mozdzanowska and Hansman, Reference Mozdzanowska and Hansman2008). A good example of such an approach is (Marais and Weigel, Reference Marais and Weigel2006); this states: “By analyzing stakeholder values, the distribution of equipage value (costs and benefits) across stakeholders, and the distribution of value over time, appropriate strategies can be determined. Technologies that may show an overall positive value can nevertheless not provide value to individual stakeholders. Such imbalances in value distribution lead to stakeholder intransigence and can stymie efforts to transform systems. Leverage strategies that correct these imbalances and accelerate the realization of value for all stakeholders can enhance cooperation and increase the likelihood of a successful transition to the new technology.”
An example of work on financial incentives for ATM development is in (Post et al., Reference Post, Wells, Bonn and Ramsey2011).
4. RELATIVE ADVANTAGES OF SESAR/NEXTGEN PROGRAMMES
At the top of the criteria for innovation in Figure 2 is ‘Relative Advantages’ (Rogers, Reference Rogers2003). There is a long history of quantitative assessment of relative advantages by aviation bodies. These are variously termed ‘Cost Benefit Analyses’ (CBA), ‘Technology Value Modelling’, and ‘Business Cases’. The main aim is to compare different options by quantifying and monetizing their attributes, and calculating the total of monetary benefits/costs, discounting money flows at different times to produce a Net Present Value (NPV).
(JPDO, 2007) and (Deloitte LLP, 2011) report CBAs for NextGen. (SESAR Consortium, 2007) includes CBAs for SESAR scenarios. Following the requirement in the European Air Traffic Management Master Plan (European Commission, 2009), (SESAR JU, 2011) assesses and quantifies the economic, social and environmental impact of implementing SESAR for Europe. There are intrinsic problems with SESAR/NextGen CBAs. (Brooker, Reference Brooker2009a) examines the issues from the point of view of airlines, which are the major ‘paymasters’ for ATM investment. SESAR/NextGen analysts are generally very careful to explain where their numbers have come from, but there are intrinsic problems with demand scenarios, cost estimates, benefit types and estimates, portfolio options, and technical aspects (e.g. discount rate and assessment time period). It is important to note that the USA and European ATM systems have major differences. Each state in Europe has its own ATM responsibilities, whereas the USA operates one system and the federal government controls Federal Aviation Administration (FAA) funding. European ATM relies mainly on user charges, whereas NextGen developments depend on the USA's annual federal budget process and political decision-makers.
Demand scenarios are a key component of NPV calculations. For ATM developments, the project benefits mainly depend on steady long-term growth; hence they are not greatly diminished by discounting and produce chronic imbalances between demand and capacity. However, forecasting future traffic is an extremely difficult task. Figure 3 illustrates the problem. This shows the actual traffic and Long Term projected traffic in the ESRA [Eurocontrol Statistical Reference Area] (Eurocontrol, 2010).

Figure 3. Summary Scenario Forecasts for ESRA (Eurocontrol, 2010. Figure 29).
Two points are relevant here:
• First, the growth in traffic over the five years' ‘actuals’ is minimal, so the SESAR objective of system improvement has in effect moved from the earlier 2020 to 2025; note that the Master Plan (European Commission, 2009) uses 2025. Given the small changes in traffic numbers, some of the comparisons later in this paper are for simplicity with 2005 or 2009/2010 traffic.
• Secondly, Eurocontrol offers four forecasts (Figure 3: ScA, ScC, ScD and ScE) with very different growth to 2030. The lowest projection is ScE, termed ‘Resource Limits’ (Peak Oil), linked to an ‘unexpected persistent oil supply deficiency after a production peak in 2020’. There are considerable uncertainties about the timing of Peak Oil. The problem for aviation is probably not the direct effects on jet kerosene prices, but rather economic disruption leading to poor economic growth rates.
Cost estimation of ATM development work is generally extremely difficult, even for the most experienced and competent project staff. ‘Software-heavy’ projects are subject to changes of functionality and scope; the work needed for integration with other projects and legacy systems is hard to calculate; system testing can be a major exercise, particularly for safety-critical and safety-related components. (Brooker, Reference Brooker2009a) offers some references and discussion of current UK ATM projects; (Hutchings and McCulloch, Reference Hutchings and McCulloch2009) provides actual data. However, there is not universal agreement that evidence of past under-estimation will be reflected in future NextGen or SESAR implementation. For example, (Deloitte LLP, 2011) states “We assumed that the FAA and Eurocontrol have considered cost and schedule risks in their estimates of nonrecurring costs and have already added a margin for contingency. Thus, a reasonably conservative level of 10% was added in this business case.”
Benefit types and estimates are necessarily complex. Sometimes, analysts lack the data for estimation, so have to disregard some large potential benefits. Most strategic ATM benefit calculations include non-monetary social benefits of a project to the public, mainly as passengers but also through broader economic impacts on GDP and employment, rather than just the financial implications for aviation industry participants (e.g. airlines, airport operators, etc). This is presumably a good reason for government support to these developments. The economic justification for such an approach uses the concept of consumer surplus, which reflects the net gain to a buyer from the purchase of a good, and is equal to the difference between the buyer's willingness to pay and the price paid. Every additional flight accommodated by the ATM system represents an economic benefit through additional consumer surplus. However, the consumer surplus and other non-monetary benefits form a large part of SESAR/NextGen benefits. Thus, for example, (Deloitte LLP, 2011. Figure 11) estimates such ‘Tier 3’ benefits are 79.5% of a particular USA NextGen scenario and comments that “Tier 3 benefits are largely indirect, which implies that they do not accrue to any one stakeholder, or are quantifiable but ‘soft’, which implies that they typically do not result in accounting cash flow.” Individual industry stakeholders usually base their decisions on financial appraisals of ‘real money gains’ (i.e. their cash flows from [e.g.] fuel saving).
In reality, SESAR and NextGen are not monolithic projects that represent ‘all or nothing’ decisions. They are actually portfolios of individual but connected projects, which may deliver individual net benefits and create vital platforms for later stages. (Brooker, Reference Brooker2009a) discusses portfolio options in some detail. Portfolios include deployment of ‘best practices’ and replacement/enhancement of existing technology through modernisation. This is illustrated for NextGen by (FAA, 2011) and for SESAR by (Brooker, Reference Brooker2009a). In particular, airlines will want the implementation of mature pre-SESAR programmes with major business benefits and real options for stakeholders. ATM service suppliers and airlines will generally want to focus on a profitable business model, which delivers operational gains in the short and medium term. The key point is that CBA is concerned with the comparison of options which include:
• Do nothing.
• Execute the whole SESAR/NextGen programme.
• Carry out the early components of SESAR/NextGen that deliver early benefits;
and/or create a new infrastructure that can be used for a variety of technological options.
5. 4D-TRAJECTORY IMPLEMENTATION IN SESAR/NEXTGEN
The implication from the previous discussion on innovation is that SESAR/NextGen face very difficult problems, particularly in their later phases employing trajectory-based concepts. The underlying problem is that this type of innovation is Discontinuous rather than Continuous. Continuous innovation is mainly though extensions of previous technology, using existing infrastructure and requiring comparatively few behavioural changes by user stakeholders (e.g. see the business decision literature such as (Moore, Reference Moore2002; Wiefels, Reference Wiefels2002)). Discontinuous innovation involves disruptive technologies that require major changes in infrastructure and equipage, and then demand changes to strategy and operational behaviour. The consequence could be a delay by several years or part-implementation at best for these ‘new paradigm’ elements of SESAR/NextGen.
Senior managers of SESAR/NextGen are aware of the difficulties. For example, (Toner, Reference Toner2010) is blunt and states:
“I'll tell you, I think TBO is on shaky ground now. Here are just a few reasons why:
1. Today's avionics weren't necessarily built for automation. For product development, both avionics and air traffic control manufacturers need agreed-upon requirements. 2025 is only 15 years away – just at the edge of the window for avionics invention and approval.
2. Can the safety case be made to support a policy of using automation to separate aircraft? How good would the automation need to be? If we can't make the safety case with the Safety Management System process, we might need a new concept.
3. TBO relies on messaging up/down via datalink. Until the critical communication of the 4D-Trajectories is specified, we can't size the datalink.”
The business literature emphasizes that discontinuous innovations represent risk to industry participants. However, ATM industry participants, particularly airline decision-makers, may have very different responses to the potential of the successive phases of SESAR/NextGen. It is not the technology enthusiasts who set the innovation timescales, but rather the cautious bulk of the industry. They would be concerned about being ‘left behind’ competitively, but they would also feel that by delaying their involvement they could attain the benefits of the innovations and avoid any remaining implementation risks. This business attitude has a crucial effect on innovation in aviation, because of its focus on consensus, with international bodies led by the International Civil Aviation Organization (ICAO) reaching equipment and standardization decisions. For example, (SESAR Joint Undertaking Website, 2011) includes the following as needing agreement at an international level: Definition and exchange format of the 4D-Trajectory (Network Operations Plan, Flight Plan, Time Synchronisation), System-Wide Information Management, Collaborative Decision Making, Information Definitions and Security, Airspace Management, Capacity Planning.
6. KILLER APPS
Are there missing ingredients that would have a dramatic impact on the speed of innovation to the end-point of TBO? Are there 4D-Trajectory ATM Killer Apps, which are innovations so valuable that they prove the core value of some larger technology to customers? Killer Apps generate high degrees of stakeholder technical and financial cooperation.
The evidence for ATM Killer Apps has to pass key tests. Killer Apps obviously have to offer enormous benefits to stakeholders in the context of the potential costs of transition. Killer Apps real-world impacts' must be most unlikely to disappear on closer examination. It is vital that the bulk of these benefits could not be obtainable through technologically ‘cut down’ non−4D-Trajectory versions; otherwise the argument for TBO fades away. Note that TBO gains could increase progressively as the proportion of aircraft using such ATM increases (Brooker, Reference Brooker2009b).
The gains must be tangible to customers. Clever drafting and marketing could only play a supporting role (e.g. build the industry consensus) to something genuinely worthwhile. The typical customer must be able to envisage clearly how these gains will be achieved and be convinced by straightforward arguments why the estimates of their magnitude are robust. The sceptics in the aviation community, who could easily wreck the moves to TBO simply by blocking progress in international forums, should not be in a position to demolish the concept as ‘yet another high-tech scam’. The sceptics would be wholly rational in expressing such concerns. Previous multi-acronym ATM visions have rather faded out, and aviation projects are subject to the problems arising from multi-stakeholder management.
7. QUANTIFICATIONS AND KILLER APPS
It seems reasonable to assume that Killer Apps are most likely to be the outputs of major improvements in system performance. So, which of these aspects are good candidates? Compared with NextGen, the SESAR programme has frequently quoted operational performance targets, mainly deriving from the important (SESAR Consortium, 2007) document. The following text mainly uses SESAR information, but supplements with research and analysis results from NextGen. Differences with the USA are not examined (e.g. scheduling practices, the use of visual operating procedures and severe weather generally being much more significant issues for the USA, nor are the implications of long-distance oceanic flights examined).
The key ATM targets for 2020 relative to 2005, albeit with minor wording variants (SESAR JU, 2011) are:
• Improved Safety:× 3 improvement, × 10 improvement in the longer term.
• Environmental: 10% less impact/flight due to ATM.
• Capacity: 73% more available, × 3 enabled in the longer term.
• Cost: 50% less [direct] ATM cost/flight.
These are political objectives (i.e. arbitrary invented targets). They do not correspond to a known combination of projects guaranteed to deliver such gains. The aim is rather to determine and then implement a project portfolio that best achieves these targets, ‘best’ being defined somehow in terms of costs, project complexity, risk etc.
Airlines would of course be extremely pleased to see these targets achieved. Do any of the targets actually require 4D-Trajectory-based TBO? If the airlines were to judge that (say) 50% of the ‘hard cash’ targets could be achieved by spending 25% of the costs of a TBO system, then would airlines not think that would be a better business deal that the 4D-Trajectory version? If so, then TBO might not sound much like a Killer App. If TBO were in place, could something much better than these targets be achieved?
The Improved Safety target is unlikely to embody a Killer App. First, ironically, most past ATM Killer Apps have in fact been safety improvements (Mozdzanowska and Hansman, Reference Mozdzanowska and Hansman2008). TBO would certainly try to reduce risks further, but it is not obvious that there would be a guaranteed step improvement in safety (Brooker, Reference Brooker2011)). This actually demonstrates that safety is very much an ‘ATM success story’; the large cumulative investments and process changes over past decades have been very worthwhile. For ∼20 years ahead, it is essential to understand what would be the quantitative safety-defence mechanisms, in a very different system, in order to estimate future risk levels. For most projections of system operations, it is adequate to model first order quantitative effects, but this kind of thinking does not work for safety. ATM's safety improvements have in essence ‘taken out’ the leading-order risks, so the problems are with the modelling and validation of system operation ‘residual safety effects’.
There have been attempts to value safety improvements in financial equivalents, in particular values for avoided fatalities and injuries. States and aviation authorities generally use these kinds of valuations. Industry participants such as airlines might well accept such valuations as being rational ones, but it is not obvious why airlines would put a markedly higher value on them than regulators. (Collopy, Reference Collopy2011) has attempted to estimate the value of safety and other improvements for the USA ATM system, in order to find the highest payback investments. He states: “There are several attributes with respect to which the current air transportation system performs so well that no amount of improvement could earn $1 billion in benefits …. For example, if annual fatalities are reduced to zero, the annual benefit will be $0.24 billion.” If it is not obvious why an airline would place a higher value on safety, it is therefore not obvious why an airline would view such improvements as Killer Apps.
The main environmental effects arise from the combustion of jet kerosene with air during airport and airspace operations: carbon dioxide, nitrogen oxides, sulphur compounds, particulate matter. Their effects range from climate change to health impacts due to people breathing polluted air. Noise is the other major environmental problem caused by aviation. Noise effects are mainly the markedly reduced quality of life for residents in the environs of airports, but there are other possible health effects for people living at the highest noise exposure (e.g. noise affecting blood pressure and hence risks of stress or cardiac reactions). (Collopy, Reference Collopy2011) also provides some broad comparative results on environmental benefits, which appear to be generally consistent with similar case-by-case results in earlier literature. The main quantified effect, noting that (Collopy, Reference Collopy2011) again uses USA government cost parameters for damage, is carbon dioxide emission, with the other effects being of second order to it.
Supposing these damage valuations are robust, then the question is again whether an airline would place a higher value on them than governments or aviation authorities. A Killer App improvement would presumably focus on carbon dioxide emissions. In ATM terms, this would mainly be realised through fuel-efficiency, but with aircraft design being very important but obviously not an ATM element. The ATM component would be fuel-efficient flight routeings, with reduced deviations from optimal flight paths in the horizontal and vertical planes, including appropriate speed and engine thrust control. Thus, a proxy for environmental improvements is fuel efficiency. In general, better fuel efficiency will lead to reduced emissions of the other pollutants, albeit there could be some losses as well as gains and reduced noise, with cleaner configuration aircraft using lower power settings.
There is less debate about the other two SESAR performance targets. Both of these have been the subject of frequent comment and criticism by airlines. It is, however, necessary to examine carefully what is meant by ‘capacity’, as the term can mix different things. Cost issues are in part because some ANSPs are much more expensive than are others, but costs necessarily reflect the inherent difficulty of ensuring safe operations from congested airports and in complex airspace.
8. CONCLUSIONS
Why are some innovations implemented comparatively quickly and others confined to niche operations or not implemented at all? One of the key factors is the extent to which an idea is a developmental improvement of the current system or a change to a new paradigm system. A change with a positive Net Present Value (NPV) has passed a major hurdle. However, a change to a new paradigm generally requires one or more ‘Killer App(lication)s’ (‘Killer Apps’ – jargon for innovations so valuable that they prove the core value of some larger technology). Such changes seize the imagination of stakeholders and retain that strong interest until the implementation of the changes. In many cases, Killer Apps offer extremely large gains, usually with cash flows (i.e. real money) to the major stakeholders.
Aviation faces potential major changes through the Single European Sky Air Traffic Research System (SESAR) and Next Generation Air Transportation System (NextGen) programmes. In part, these are developmental improvements to the existing Clearance-Based Operations (CBO) concept, but the longer-term vision is of a change to a Four Dimensional (4D)-flight Trajectory-Based Operations (TBO) new paradigm. Currently, much of the focus is on developmental improvements with shorter-term benefits. Will TBO be implemented? Are there TBO Killer Apps for airlines, the major business stakeholders? A TBO Killer App must not be achievable through developmental improvements and should not be largely dependent on particular future projections (e.g. very large traffic growth). This is of course a fraction of the European or USA decision-making system about SESAR and NextGen. In particular, several studies indicate that a continued expansion of the aviation industry, coupled with the introduction of TBO-compliant technology, would generate large employment and Gross Domestic Product (GDP) gains. But the long-term commitment of the airline industry would be vital. Historically, individual airlines can suffer considerably from the effects of economic cycles, so their decision-makers need to be convinced of the merits of very large TBO investments.
Some ATM features are unlikely to generate Killer Apps. Safety is in fact the best example. Many of the past successful ATM innovations in fact led directly or indirectly to significant safety benefits. The current system has a very high level of safety, and the challenge for TBO is to ensure at least the same level of safety. Nor are there likely to be environmental Killer Apps, except where this relates to fuel efficiency.There have been several attempts to value safety and environmental improvements by ATM bodies, which do produce large gains, but these largely accrue to passengers and the population generally rather than airlines.
The three remaining Killer App candidates are Fuel Efficiency, Capacity and Cost, which are examined in detail in Part 2, to be published in the next issue.


