


Introduction
In 1958 the Rocky Mountain Forest and Range Experiment Station at Fort Collins, Colorado, began studies to see if it were possible to increase the amount of snow held in deep alpine snowdrifts as one means of increasing summer stream flow. These studies involved the use of artificial barriers in combination with terrain features to induce additional accumulation of drifting snow in natural catchments. If this additional snow were not held in the alpine area, the winds would carry it to lower elevations where it would add to the general spring run-off rather than contribute to the late summer stream flow.
The following working assumptions were made when the study was started:
-
In alpine areas drifting snow accumulates to great depths only in places that are protected from the wind.
-
Snow fills most terrain depressions before the end of winter. Once full, these areas are aerodynamically smooth and trap little additional snow.
-
There is no shortage of drift snow in alpine regions. Therefore, the depth of snow accumulations could be greatly increased if the capacity or the trapping efficiency of natural catchments could be increased.
-
There should be places in alpine regions where barriers of modest height (≤3 m. tall) could be combined with terrain features to increase greatly the trapping efficiency of the natural terrain.
-
If snow depths could be increased in areas where it is normally 3−5 m. deep, the amount of snow available for summer stream flow would be increased substantially.
Procedure
Seven snow fields or catchments were selected for study. These were located in a large alpine basin on the eastern side of the Continental Divide in central Colorado. Most of the experimental and control fields (fields I through VI and the check stakes) were grouped in an area 16−20 × 104 m.2 in extent at an elevation of 3,630 to 3,660 m. a.s.l. (Fig. 1). 400 m. to the windward of this area a ridge extended 150 to 210 m. above the fields. One test field (Straight Creek) and its control area were located on this ridge 1.2 km. north-west of the main group of fields. The Straight Creek site was just to the lee of the main ridge crest. Snow stakes were used to learn how snow accumulated naturally in irregular alpine terrain and how artificial barriers changed this pattern. 115 stakes were arranged at 9 m. intervals to give one or more profile lines through each of the natural catchments studied. Snow depth was read to the nearest 8 cm. on all stakes at “weekly” intervals (6 to 14 days) for five years. In April of most years the profile lines were probed at 3 m. intervals with aluminum rods and snow depths were read to the nearest 2 cm. Most of the analyses and discussions that follow are based on April snow depths since they are very close to the seasonal maximum.

Fig. 1. Sketch map showing the layout of the main group of snow fields and control areas in Loveland Basin, Colorado. Straight Creek snow field and its control area are 1.2 km. to the north-west of this area (see Fig. 4)
A different procedure was used to determine snow depths at Straight Creek. Here a hand level and tape were used to measure several cross-sections through the catchment before snow started to accumulate. Later surveys at the same places gave the shape of the snow surface. Superimposing the two surveys for a given location permitted graphic determination of snow depths at any point. Snow depths along each profile line were mechanically integrated by the use of a planimeter to give the volume of snow per unit length of catchment.
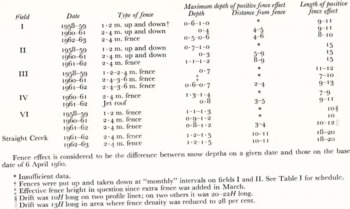
Field V in the main group of catchments was never fenced. This field plus a group of 17 check stakes located in four nearby catchments were considered the control for the experiment. The other six snow fields received the treatments outlined in Table I. Since this was an exploratory study, we were looking for situations where barriers would increase snow volumes by at least 30 to 50 per cent. The exploratory nature of the study made it desirable to try different treatments as experience was gained. Hence, a new location and two new fence patterns were tried in 1961−62.
Table I Treatments Applied to 7 Alpine Snow Fields to Increase Snow Depths. Loveland Basin, Colorado

Weather Conditions
Precipitation in this part of the Rocky Mountains is not heavy. Distribution of new snowfall for the years 1958 to 1962 showed that 51 per cent of the days from 1 November until 30 April had no precipitation. 39 per cent had to cm. of snow or less, while less than 1 per cent of the days had 30 cm. or more snow. Total annual snowfall for this period averaged 770 cm. Maximum snow depth in an area free of wind action varied from 193 to 241 cm. and averaged 219 cm. Under such conditions, significant snow depths would be unusual except for snowdrifting. Wind transport and re-deposition of snow builds deep deposits in terrain depressions and other sheltered spots.
In the catchments studied, between 54 and 69 per cent of the seasonal accumulation of snow was deposited during the 5 weeks with heaviest drifting (Table II). Furthermore, between 30 and 42 per cent of the seasonal accumulation took place in the 2 weeks of heaviest drifting. For three of the five years the first major storm of the season was also the largest accumulation period of the winter. Total seasonal accumulation varied less than 7 per cent for three of the five years. The most consistent period of heavy drifting was during the last half of February.
Table II Total Snow Accumulation on 29 Control Stakes for the 5 Major Srift Periods Each Year (1958–63). Loveland Basin, Elevation 3,650 m.a.s.l.

The above accumulation and drifting data are given as “weekly” values because that is the way the field observations were taken and there was no good way to interpolate for shorter periods. In many cases these “weekly” accumulations took place in a relatively few days. So the true periods of heavy accumulation were even more restricted than indicated above.
Daily wind speeds during the 5 weeks of heaviest drifting each year seldom exceeded 9 m./sec. (20 m.p.h.). Maximum 6 hr. wind speeds exceeded 11 m./sec. (25 m.p.h.) less than 2 per cent of the time. Winds during these drift periods were predominantly from the northwest and west. The lack of short-term snow-drift and accumulation data made it impossible to give any specific correlations between snow-drift intensity and wind speed and direction.
The seasonal accumulation of snow at the 17 check stakes and the 12 stakes in field V is shown in Figure 2 as the average snow depth per stake. Although there is a decided year-to-year variation in average snow depths, the seasonal trend is for a general increase in the average depth from mid-December until late March. Maximum snow depths were usually reached by mid-April. The melt season started in early May and proceeded rapidly and uniformly until mid July. The average maximum snow depth varied from 2.8 to 3.2 m. per stake for four of the five years. In the very poor snow year of 1962−63 it dropped to 2.2 m. per stake.
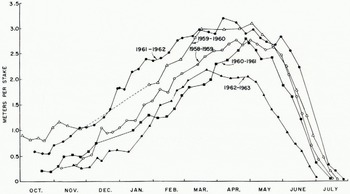
Fig. 2. Snow depths in the control area at Loveland Basin, Colorado, for,five winters. Each point represents the average snow depth at 29 stakes
Types of Artificial Barriers
Snow fences were built of commercially available slat and wire fencing which was wired to steel cables. The cables passed freely through eye bolts in stout wooden poles. The fencing was made of wood slats 1.21 m. long, 3.5 cm. wide and 1.2 cm. thick, held together by five strands of wire. The overall density was 42 per cent, i.e. 58 per cent of the fence area was open. The gap between the bottom of the fence and the ground varied from 30 to 60 cm. Barriers were located along the up-wind edges of natural snow accumulation areas.
In the fall of 1961, the density of one-half of the bottom tier of fencing on field VI was reduced from 42 to 28 per cent. This reduction in density was expected to produce a longer lee drift.
The same year, a sloping solid-wood jet roof (Diisendach) was built up-wind of the north end of field IV. This jet roof was 1.83 m. tall on the windward edge and 0.60−0.75 m. tall on the leeward edge. The wind, trapped between the sloping roof and the ground, was accelerated and deflected downward into the top edge of the catchment. It was hoped this barrier would produce a lee drift with a maximum depth of 20−30 m. to the leeward (12 to 15 times the barrier height).
Snow Accumulation—Natural and Fenced Conditions
Snow was allowed to accumulate naturally in field V (Fig. 3). In addition, all the experi.mental catchments were allowed to fill naturally during the winter of 1959−60 and all except field I and Straight Creek during the winter of 1962−63 (Table I). The intention was to use the April 1960 and April 1963 snow depths as a basis for determining fence effect in all fields except Straight Creek. The very low snow depths in April 1963 made it unsuitable as a base; therefore, snow depths measured on 6 and 7 April 1960 were used as a base for determining fence effect. For example, if a given catchment had greater snow depths after a fence had been in place all winter than it did in April of the base year, the increment was attributed to the fence. In a similar manner, any decrease in snow depths from the base year were also attributed to the fence. The admitted weakness of using a single year for a base is mitigated somewhat by the fairly close agreement in snow depths at field V and the check stakes for all years except 1963 (Table III), and by the very good agreement in depths at field I for the two years, 1960 and 1962, when there was no fence on this field (Fig. 6).

Fig. 3. Average terrain and April snow depths along three profile lines in catchment V. This catchment was not fenced and served as a control area. Snow depth for the 4 years prior to. 1963 varied less than 5 per cent from the average. Snow depths in. April 1963 were about 70 per cent of the average for the preceding 4 years
Table III Average April Snow Depths at the Check Stakes and Field V (1959−63). Loveland Basin, Colorado
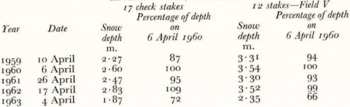
Figure 3 tends to confirm one of the basic assumptions of this study—namely, that such areas fill to a certain level with snow and then can hold no more. This is also shown by the 1960 and 1962 snow depths in field I. The factors controlling the capacity of the catchments are not known, but it seems logical that up-wind terrain features and the shape and size of the catchments would be important.
Fences were most successful at the Straight Creek snow field, the catchment located on the main ridge crest. At this location the test and control areas were both part of the same long uniform snow field (Fig. 4). Fence effect was considered to be the difference between the average amount of snow in two profile lines behind the fence compared to the average amount in two profile lines through the adjacent control area (Fig. 5). On 19 July 1962 there was an average of 62 m.3 more snow (38 m.3 of water) per meter of fence in the snowdrift behind the fence than in the control area. This means there was an extra 1,000 m.3 of water in the catchment for each 26 m. of snow fence. On 17 August there were still 51 m.3 of snow (33 m.3 of water) per meter of fence in the fenced area and no snow in the control area. This is equivalent to an extra 1,000 m.3 of water in mid-August for each 30 m. of fence.

Fig. 4. Part of the long uniform snow field at Straight Creek on 15 December 1961. The fence was 2.4 m. tall and 55 m. long; it was lengthened to 90 m. during the summer of 1962. Control lines were located beyond the fence in an undisturbed part of the catchment

Fig. 5. Average terrain and snow profiles at the Straight Creek snow field in spring and summer 1962. This catchment responded very well to snow fences. The differences between the average snow depths in two test profiles behind the fence and the average depths in two check profiles through the control area give a measure of how much the fence prolonged the melt period. Comparable results were also obtained in 1962−63
The other two successful fence sites—fields I and II—were relatively small shallow snow fields located in a broad almost level valley 150 m. below and 600 m. in the lee of the main ridge. Initially these two fields appeared to be very similar. As the study progressed, however, their natural snow-trapping ability and their response to fencing proved to be very different.
There was a fence 2.4 m. tall up-wind of field II during the winter of 1961−62. This fence doubled the amount of snow caught in the field (Fig. 6). Maximum fence effect was located down-wind of the fence a distance equal to 8 to 9 times the height of the fence (8−9H). It amounted to 2.4−2.75 m. of snow. There was still 1.2−1.8 m. of additional snow at 15H.

Fig. 6. Average terrain and April snow profiles at. fields I and II. These two fields showed good fence effect. The fence, when present, was at the left edge of the profiles. April 1960 was considered the base year. Tears when fences were active are shaded (see Table I for details of treatment)
A similar fence was in place up-wind of field I during the winter of 1962−63. Unfortunately, snow depths this year were only about 70 per cent of the average for the preceding four years, so there is no way of determining the magnitude of the fence effect. There is little doubt, however, that the fence increased snow depths over most of field I during the 1962−63 season (Fig. 6).
During the winters of 1958−59 and 1960−61, fences were alternately put up and taken down at intervals on fields I and II (Table I). By comparing the accumulation in the two fields at the end of each interval, several fenced versus unfenced comparisons could be obtained in a single year. This treatment gave the same general results as season-long fencing, i.e. both catchments responded well to fencing, but the drifts on field II were longer and deeper than those on field I. The end effect of this series of treatments is shown in Figure 6.
At two of the catchments—fields III and VI—snow fences changed the pattern of snow accumulation but made no appreciable change in the total volume of snow trapped in the catchments (Fig. 7). Under natural conditions maximum snow depths in these catchments were located 35−50 m. down-wind from the fence site in the more gentle places and 18−27 m. in the steeper places. The fences at these sites caused drifts with maximum depths only 2−4H (5−10 m.) beyond the fence. Positive fence effect extended to 8−11H (19−26 m.). Beyond this point snow depths were less than under natural conditions.
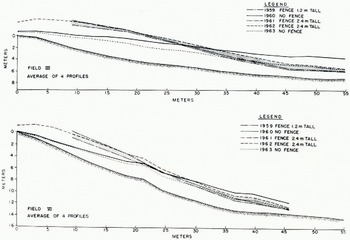
Fig. 7. Average terrain and April snow profiles at fields III and VI. These two fields showed little or no net gain of snow as the result of fences. When present, fences were at the left edge of the profiles. April 1960 was considered as base. Years when fences were active are shaded. Notice how positive fence effect shortens as terrain steepens. This trend is continued in Figure 8
At field IV, a steep catchment with slopes of 40 to 60 per cent, two types of snow fence failed to increase the volume of snow (Fig. 8). A vertical slat and wire fence 2.4 m. tall increased snow depths during the 1960−61 winter from the fence out 7−9H (17−22 m.) to the leeward, but it decreased snow depths beyond this point. A sloping jet roof was built in September 1961 to try to create a drift with maximum depths 30−35 m. to the leeward. The drift caused by the jet roof had a maximum depth of 1.5 m. (about 1H), 9 to 12 m. behind the structure (Fig. 8). At this catchment the natural snow accumulation pattern was decidedly better than those behind the two types of barriers tested.
Fig. 8. Average terrain and April snow profiles at field IV. Two types offences failed to equal the natural accumulation at this field. When present, fences were at the left edge of the profile. April 1960 was considered the base. rears when fences were up are shaded. Snow depths in 1963 were much below those for the other years (see Figs. 2 and 3)
Snow fences changed the pattern of snow accumulation in all six catchments studied. At three of the catchments fences increased the amount of snow appreciably; at two others they caused no net change in the amount of snow; at another catchment fences decreased the amount of snow.
Discussion
For our purposes fence effect was considered to be the difference in snow depth in the lee drift for a year when a fence had been in place and the depth in the natural drift formed in 1959−60 when there had been no fence. It was measured in April each year since this was the time of maximum snow depths. Based on this definition, the size and location of the positive effect caused by snow fences and a jet roof in irregular alpine terrain are outlined in Table IV. Positive fence effect usually extended 8−12H beyond the slat-and-wire fences. In the steeper areas, especially where the wind flowed down-slope before striking the fences, this distance shortened to 7−8H (Figs. 7 and 8). At Straight Creek and field II the positive fence effect extended out to about 20H. These lengths fall close to the range 10−25H, cited by Reference SchneiderSchneider (1959) for drifts behind snow fences in level terrain. The more frequent values of 8−10H also agree with the formula

Table IV Characteristics of Positive Fence Effect behind Vertical Slat-and-Wire Fences and a Jet Roof Placed Up-wind from Natural Alpine Snow Fields
Reducing the density of the lower tier of fencing to 28 per cent on part of field VI increased the length of the positive fence effect by one-third. The jet roof also gave a longer positive effect than a vertical fence of normal density at field IV.
Maximum snow depths in the fence-induced lee drifts exceeded the height of the fences at more than half of the catchments. Depths varied from 0.8 to 1.5H at most of the catchments but were as low as 0.5−0.7H at fields I and III.
The deepest part of the positive fence effect was located 3−5H behind the fence in most cases. The exceptions were field II and Straight Creek, where tile crests of the fence-induced lee drifts were 8−11H beyond the fence.
Several parameters were studied to see if they could be used to indicate superior fence sites. One such parameter was the slope of the natural snow surface measured at right angles to the contours and at the time of maximum snow depth. The other was the ratio of the area of a cross-section through the maximum snow accumulation under natural conditions and the square of the depth of the catchment. This is the K factor used by Nøkkentved to compare different types of snow fences (Reference PughPugh, 1950). The slope of the natural snow surfaces varied from 3 to 44 per cent. At a given catchment the slope was steeper in light snow years than in heavy years. K values ranged from 0.3 to 4.6. Neither K nor the slope of the snow surface gave any indication of how well a catchment would respond to fencing.
The snow accumulation pattern behind the Straight Creek fence was close to ideal for our purpose and, therefore, it is of special interest. The positive fence effect at Straight Creek was long, deep and had maximum depths a relatively long way behind the fence. It is felt that high wind speeds contributed to the Iocation of the maximum depth (Reference FinneyFinney, 1934). A combination of terrain factors—up-slope approach to the fence and a slight up-slope beyond the accumulation zone—probably contributed to the extra length and depth of the drift (Reference FinneyFinney, 1939). The lack of tall peaks or ridges for 20 km. to the west of the fence site may have been another factor favoring long deep drifts.
The most unexpected result from these studies was the negative fence effect, or reduction in snow depths, down-wind from the fence-induced drift (Figs. 7 and 8). In several catchments this reduction cancelled the increase in snow closer behind the fence. Nor were we prepared for the great variation in fence effect at catchments that appeared quite similar.
Recommended Fence Locations
These empirical studies have shown the following factors are important when vertical slat-and-wire snow fences are used in alpine areas to create maximum snow depths:
-
Fences should be located so that the deepest part of the natural drift is no more than 3−4H down-wind from the fence location. This can be increased to 8−10H at windy sites where winds approaching the fence flow up a relatively smooth slope of 18 to 50 per cent.
-
Fences should be located so the gap below the fence will not clog with snow.
-
The windward approach to the fence should be smooth and should either slope up toward the fence site or be horizontal. (The effective length of the windward approach is not known.)
-
Natural snow accumulation should be at least 3−5 m. deep in the place where maximum fence effect is expected.
-
The principal drifting winds should have a consistent direction and a minimum amount of turbulence.
Summary
Studies were carried out in the Front Range of central Colorado to see if snow fences could increase the depth of snow in alpine snow fields.
For four of the five winters studied, spring snow depths varied from to per cent below the base year of 1959−60 to 4 per cent above. In the other year spring snow depths were 30 per cent below the base year.
Between 54 and 69 per cent of the seasonal accumulation of snow in this alpine area was deposited during the 5 weeks with heaviest drifting. Furthermore, 30 to 42 per cent of the seasonal accumulation took place in the 2 weeks of heaviest drifting. For three of the five years the first major storm of the year was also the largest accumulation period of the winter.
Vertical slat snow-fencing increased snow depths and net snow volume at three of the six catchments treated. Fences more than doubled the volume of snow in two of these catchments. At a third, snow volume was increased by a lesser but indeterminate amount. At two other catchments snow depths were increased close behind the fences but were decreased farther down-wind with no net increase in the amount of snow caught. In still another catchment fences reduced the amount of snow.
The lengths of fence-induced lee drifts were usually 8 to 12 times the height of the fence (8−12H). In steep terrain drift lengths shortened to 7−8H. The deepest part of the fence-induced lee drifts were usually located 3−5H behind the fence. In a few cases the deep places were 8−1 1H. The maximum depth of these drifts varied from 0.5−0.6H at one catchment to 1.2−1.5H at another.
Neither the slope of the natural snow surface nor the Nøkkentved K factor were found useful for predicting fence effect in alpine catchments.


