


This work is dedicated to Jean-Louis d'Auzon, founder of Association pour la Sauvegarde de la Nature de Néo-Calédonienne and defender of marine turtles in New Caledonia and the South Pacific for over 40 years.
Introduction
The green turtle Chelonia mydas is categorized as En dangered on the IUCN Red List based on observed or estimated population reduction, determined using an index of abundance and potential levels of exploitation (criteria A2bd; Seminoff et al., Reference Seminoff, Crouse and Pilcher2004). This evaluation was based on the trends of nesting populations at 32 sites. Two sites are in the western Pacific Ocean, both in Australia (Heron Island in the southern Great Barrier Reef and Raine Island in the northern Great Barrier Reef), and one is in the central Pacific Ocean (French Frigate Shoals in Hawaii). However, Wallace et al. (Reference Wallace, DiMatteo, Hurley, Finkbeiner, Bolten and Chaloupka2010) noted that the Pacific populations should be separated into seven regional management units, which are population segments identified using site-based monitoring, genetic analyses, mark–recapture studies and telemetry. It is now acknowledged that the IUCN evaluation of marine turtles should be conducted at the scale of these population segments, to better reflect local pressures on populations (Seminoff & Shanker, Reference Seminoff and Shanker2008).
New Caledonia is a sui generis overseas territory of France in the south-west Pacific Ocean, c. 1,210 km east of Australia. As part of the Melanesia subregion the archipelago includes the main island of Grande Terre, the Isle of Pines to the south, the Loyalty Islands to the east, the Belep Archipelago and the d'Entrecasteaux Reefs to the north and the Chesterfield and Bellona Reefs 550 km west of Grande Terre (Fig. 1). Loggerhead turtle Caretta caretta nesting in New Caledonia is well known and has been much studied (Boyle et al., Reference Boyle, Fitzsimmons, Limpus, Kelez, Velez-Zuazo and Waycott2009; Etaix-Bonnin et al., Reference Etaix-Bonnin, Farman, Géraux and Faninoz2011; Read et al., Reference Read, Booth and Limpus2013). The presence of green turtles in New Caledonia has been less studied because the main nesting sites are located far from the main island, on remote, uninhabited islands.

Fig. 1 The New Caledonian archipelago, indicating the main geographical regions assessed in this study. The French economic exclusive zone of New Caledonia is shown in dark grey. Within this zone, the d'Entrecasteaux, Chesterfield and Bellona Reefs are highlighted in light grey.
The first mention of green turtles in New Caledonia was made by Lieutenant William Chimmo of HMS Torch after being ordered to rescue the lorcha Ningpo in 1854 (a lorcha is a type of sailing vessel that has a junk rig with Cantonese or other Chinese-style batten sails on a Portuguese or other European-style hull). Chimmo described numerous massive turtles nesting in the d'Entrecasteaux Reefs, with one weighing 272 kg (Chimmo, Reference Chimmo1856). Based on our current knowledge of the species, these were probably green turtles. P.C.H. Pritchard succeeded in setting up an expedition with the NGO Association pour la Sauvegarde de la Nature Néo-Calédonienne to visit the d'Entrecasteaux Reefs in December 1991. A total of 310 tracks were counted on Surprise Island, 1,800 tracks on Huon Island, 572 tracks on Fabre Island and 130 tracks on an unnamed fourth islet (Pritchard, Reference Pritchard, Schroeder and Witherington1994). An aerial survey over all of the beaches of New Caledonia in 2006–2007, excluding Chesterfield and Bellona Reefs (Mounier, Reference Mounier2007; Etaix-Bonnin et al., Reference Etaix-Bonnin, Farman, Géraux and Faninoz2011), estimated 1,000–2,000 female green turtles nesting annually (but neither the raw data nor the analysis method of this survey have been published). During 1989–2004 the Association pour la Sauvegarde de la Nature Néo-Calédonienne carried out 12–15 day tagging campaigns on Surprise, Fabre, Le Leizour and Huon Islands in the d'Entrecasteaux Reefs, resulting in the tagging of 3,651 female green turtles (Read & Fontfreyde, Reference Read and Fontfreyde2012).
The Chesterfield Islands to the north and the Bellona Reefs to the south are 550 km to the west of Grande Terre in the Coral Sea (Fig. 1). The surroundings of the Chesterfield Islands, visited in some seasons by humpback Megaptera novaeangliae and sperm whales Physeter macrocephalus, attracted whalers from New Zealand in the 19th century. Thiercelin (Reference Thiercelin1866) reported that turtles weighing 60–100 kg lay on these islands, and the whalers ate their eggs.
Data from turtles tagged in the d'Entrecasteaux Reefs indicate that some of these individuals forage in New Caledonia, Australia and Papua New Guinea (Read et al., Reference Read, Wantiez, Werry, Farman, Petro and Limpus2014); tags were recovered from only 1% of the initially tagged individuals. The same study also identified individuals nesting in Australia and foraging in New Caledonia (Read et al., Reference Read, Wantiez, Werry, Farman, Petro and Limpus2014). A genetic study on foraging green turtles conducted in the south of New Caledonia provided information regarding the genetic composition of this species in the South Pacific (Read et al., Reference Read, Fitzsimmons, Wantiez, Jensen, Keller and Chateau2015). Individuals from the d'Entrecasteaux Reefs were identified as representing a formerly unknown and independent genetic pool, now known as the d'Entrecasteaux genetic stock (Read et al., Reference Read, Fitzsimmons, Wantiez, Jensen, Keller and Chateau2015). Individuals from the Chesterfield Reefs were found to be linked to the Coral Sea genetic stock (Read et al., Reference Read, Fitzsimmons, Wantiez, Jensen, Keller and Chateau2015).
These studies have highlighted two nesting habitats in New Caledonia, the d'Entrecasteaux and Chesterfield–Bellona Reefs, although no consolidated data have been published on the actual numbers of green turtles nesting in these two areas.
Quantifying the nesting of marine turtles has become the preferred tool for evaluating their status (Delcroix et al., Reference Delcroix, Bédel, Santelli and Girondot2014; Laloë et al., Reference Laloë, Monsinjon, Gaspar, Touron, Genet and Stubbs2020; Omeyer et al., Reference Omeyer, McKinley, Bréheret, Bal, Balchin and Bitsindou2022). This approach considers the fact that some nights are not monitored during a season (missing intra-season data) whilst providing information at the scale of the nesting season (phenology) and between nesting seasons (trend). Spatial tools have recently been developed to allow for the fact that some sites may not be monitored for several seasons (Morales-Mérida et al., Reference Morales-Mérida, Muccio and Girondot2023). These tools are important when evaluating the status of marine turtles as they can determine any trend and an associated confidence interval, even when some information is lacking (Girondot & Rizzo, Reference Girondot and Rizzo2015). With the objective of assessing the status of green turtles in New Caledonia, we have collected all of the available information regarding the nesting of green turtles on the d'Entrecasteaux, Chesterfield and Bellona Reefs and we have quantified nesting in these remote, uninhabited reefs.
Study area
The exclusive economic zone of New Caledonia was established by Decree No. 78-142 of 3 February 1978 (Fig. 1). Order No. 2014-1063 of 23 April 2014 created the Natural Park of the Coral Sea, which includes the maritime space of New Caledonia in addition to the islands and islets included therein, along with the ground and subsoil of the maritime space as well as the water mass that covers them. The Park has an area of 1,291,967 km2. The exterior limits of the Park conform with the external limits of the exclusive economic zone of New Caledonia (Fig. 1).
The d'Entrecasteaux Reefs are the northern-most land of New Caledonia (Fig. 1) beyond the Grand Passage. They should not be confused with the d'Entrecasteaux Islands (Normanby, Fergusson, Goodenough, Sanaroa, Dobu) to the east of Papua New Guinea. Located c. 230 km north of Grande Terre, the d'Entrecasteaux Reefs extend the Caledonian reef system to the north-west. These reefs form a complex system with seven atolls. Islands, islets and cays are also present as part of the barriers. Here we use the term ‘island’ to designate a part of the barrier that is always emerged and covered with vegetation, whereas ‘cay’ is defined as a small, low-elevation, sandy island without vegetation on the surface of a coral reef. In the d'Entrecasteaux Reefs only Huon and Surprise Atolls have emerged lands. Surprise Atoll is a coral, oval-shaped atoll that consists of three islands (Le Leizour, Fabre and Surprise) and two unnamed cays. Only one island (Huon Island) is present as part of the barrier of Huon Atoll. The d'Entrecasteaux Reefs have been listed on the UNESCO World Heritage List since July 2008. The whole area is classified as the Natural Park of d'Entrecasteaux, which is included with the exclusive economic zone atolls in Decree No. 2013-1003/Gouvernement de la Nouvelle-Calédonie of 23 April 2013. It is also included in the Natural Park of the Coral Sea (Decree No. 2014-1063/Gouvernement de la Nouvelle-Calédonie of 23 April 2014 and Law No. 2022-1 of 12 January 2022 on the protection of New Caledonian marine areas).
The Chesterfield and Bellona Plateau comprises two sets of reefs: the Chesterfield Reefs to the north and the Bellona Reefs 60 km to the south-east. The latter is sometimes incorrectly written as ‘Bellone’. The name comes from the Bellona ship commanded by Matthew Boyd, who first reported these reefs in 1793. The lagoon of the Chesterfield Reefs is located at 19°00'–20°30'S and 158°10'–159°00'E and covers 4,765 km2, with a perimeter of 344 km. The Chesterfield Reefs form a structure that is 120 km long and 70 km wide, located c. 550 km north-west of Grande Terre and equidistant from the Great Barrier Reef in Australia (Fig. 1). Overall, 15 islands and 14 cays are present in the Chesterfield Atoll, whereas the Bellona Atoll features only one island and one cay. These reefs are outside the jurisdiction of New Caledonian provinces. It is therefore the New Caledonian territory that ensures the management and conservation of the natural resources of these reefs according to Article 20 of Organic Law No. 99-209 of 19 March 1999. The Chesterfield and Bellona complex was classified as a natural reserve on 14 April 2018 (Order No. 2018-1987/Gouvernement de la Nouvelle-Calédonie of 14 August 2018, amended and replaced by Order No. 2022-1387/Gouvernement de la Nouvelle-Calédonie of 1 June 2022).
Methods
d'Entrecasteaux Reefs
Various field missions have collected data on the d'Entrecasteaux Reef since 1988. Most of these missions were short (15 days at most). There has been only one long-term mission (45 night counts during 18 October–31 December 2003), in which three 2-week camps were organized on Huon Island (Liardet & D'Auzon, Reference Liardet and D'Auzon2004). The Natural Park of the Coral Sea of the Government of the Territory of New Caledonia conducted short annual monitoring missions (c. 6 days per mission) of green turtles and birds on the d'Entrecasteaux Reefs during 2007–2022.
Bellona and Chesterfield Reefs
The first field mission on the Chesterfield Reefs took place during 21–25 January 1991 (Sirgouant et al., Reference Sirgouant, Jacquier, Bonnerot, Leducq, Couzy and Sintes1991). During 2011–2022, Natural Park of the Coral Sea conducted annual monitoring missions at the Chesterfield and Bellona Plateau. Teams comprised members of the Association pour la Sauvegarde de la Nature Néo-Calédonienne, the Caledonian Society of Ornithology, the Département des Technologies et Services de l'Information of the Government of New Caledonia, WWF–France and volunteers.
Monitoring
Monitoring protocols during 1988–2006 were relatively simple: boats stopped close to a cay or island and field workers landed and counted all observable turtle tracks. The observers separated the tracks into four categories: from the previous night, < 4 days old, < 1 month old and > 1 month old. However, based on current knowledge, tracks older than 10 days are generally no longer visible (Omeyer et al., Reference Omeyer, McKinley, Bréheret, Bal, Balchin and Bitsindou2022). We therefore recoded these data to take this into account. The number of tracks is referred to as ‘number of nesting activities’ and included the number of clutches laid plus additional beachings with no clutches.
From 2007, when the Natural Park of the Coral Sea began organizing field surveys, a more precise protocol was followed using teams of 3–4 people deploying at sunrise: (1) When the team arrives at a new site, they use a rake to erase the tracks along the shore and to facilitate the reading that will take place on the following day. (2) On subsequent days the first person counts all of the ascending and descending tracks of the turtles (for the first patrol of the mission) and those that cut the line previously made by the team (see below); any turtles present on the beach are counted. (3) The second person pulls a harrow made of a chain held apart by a metal bar, to flatten the sand. (4) The third person uses a rake to erase the tracks along the flattened area to facilitate the reading that will take place on the following day. (4) The fourth person pulls a ball along the area flattened by the chain, to create a new line (this activity can also be done by the person using the rake). A report is made for each cay or island surveyed during a mission, to indicate the number of visible tracks since the previous session.
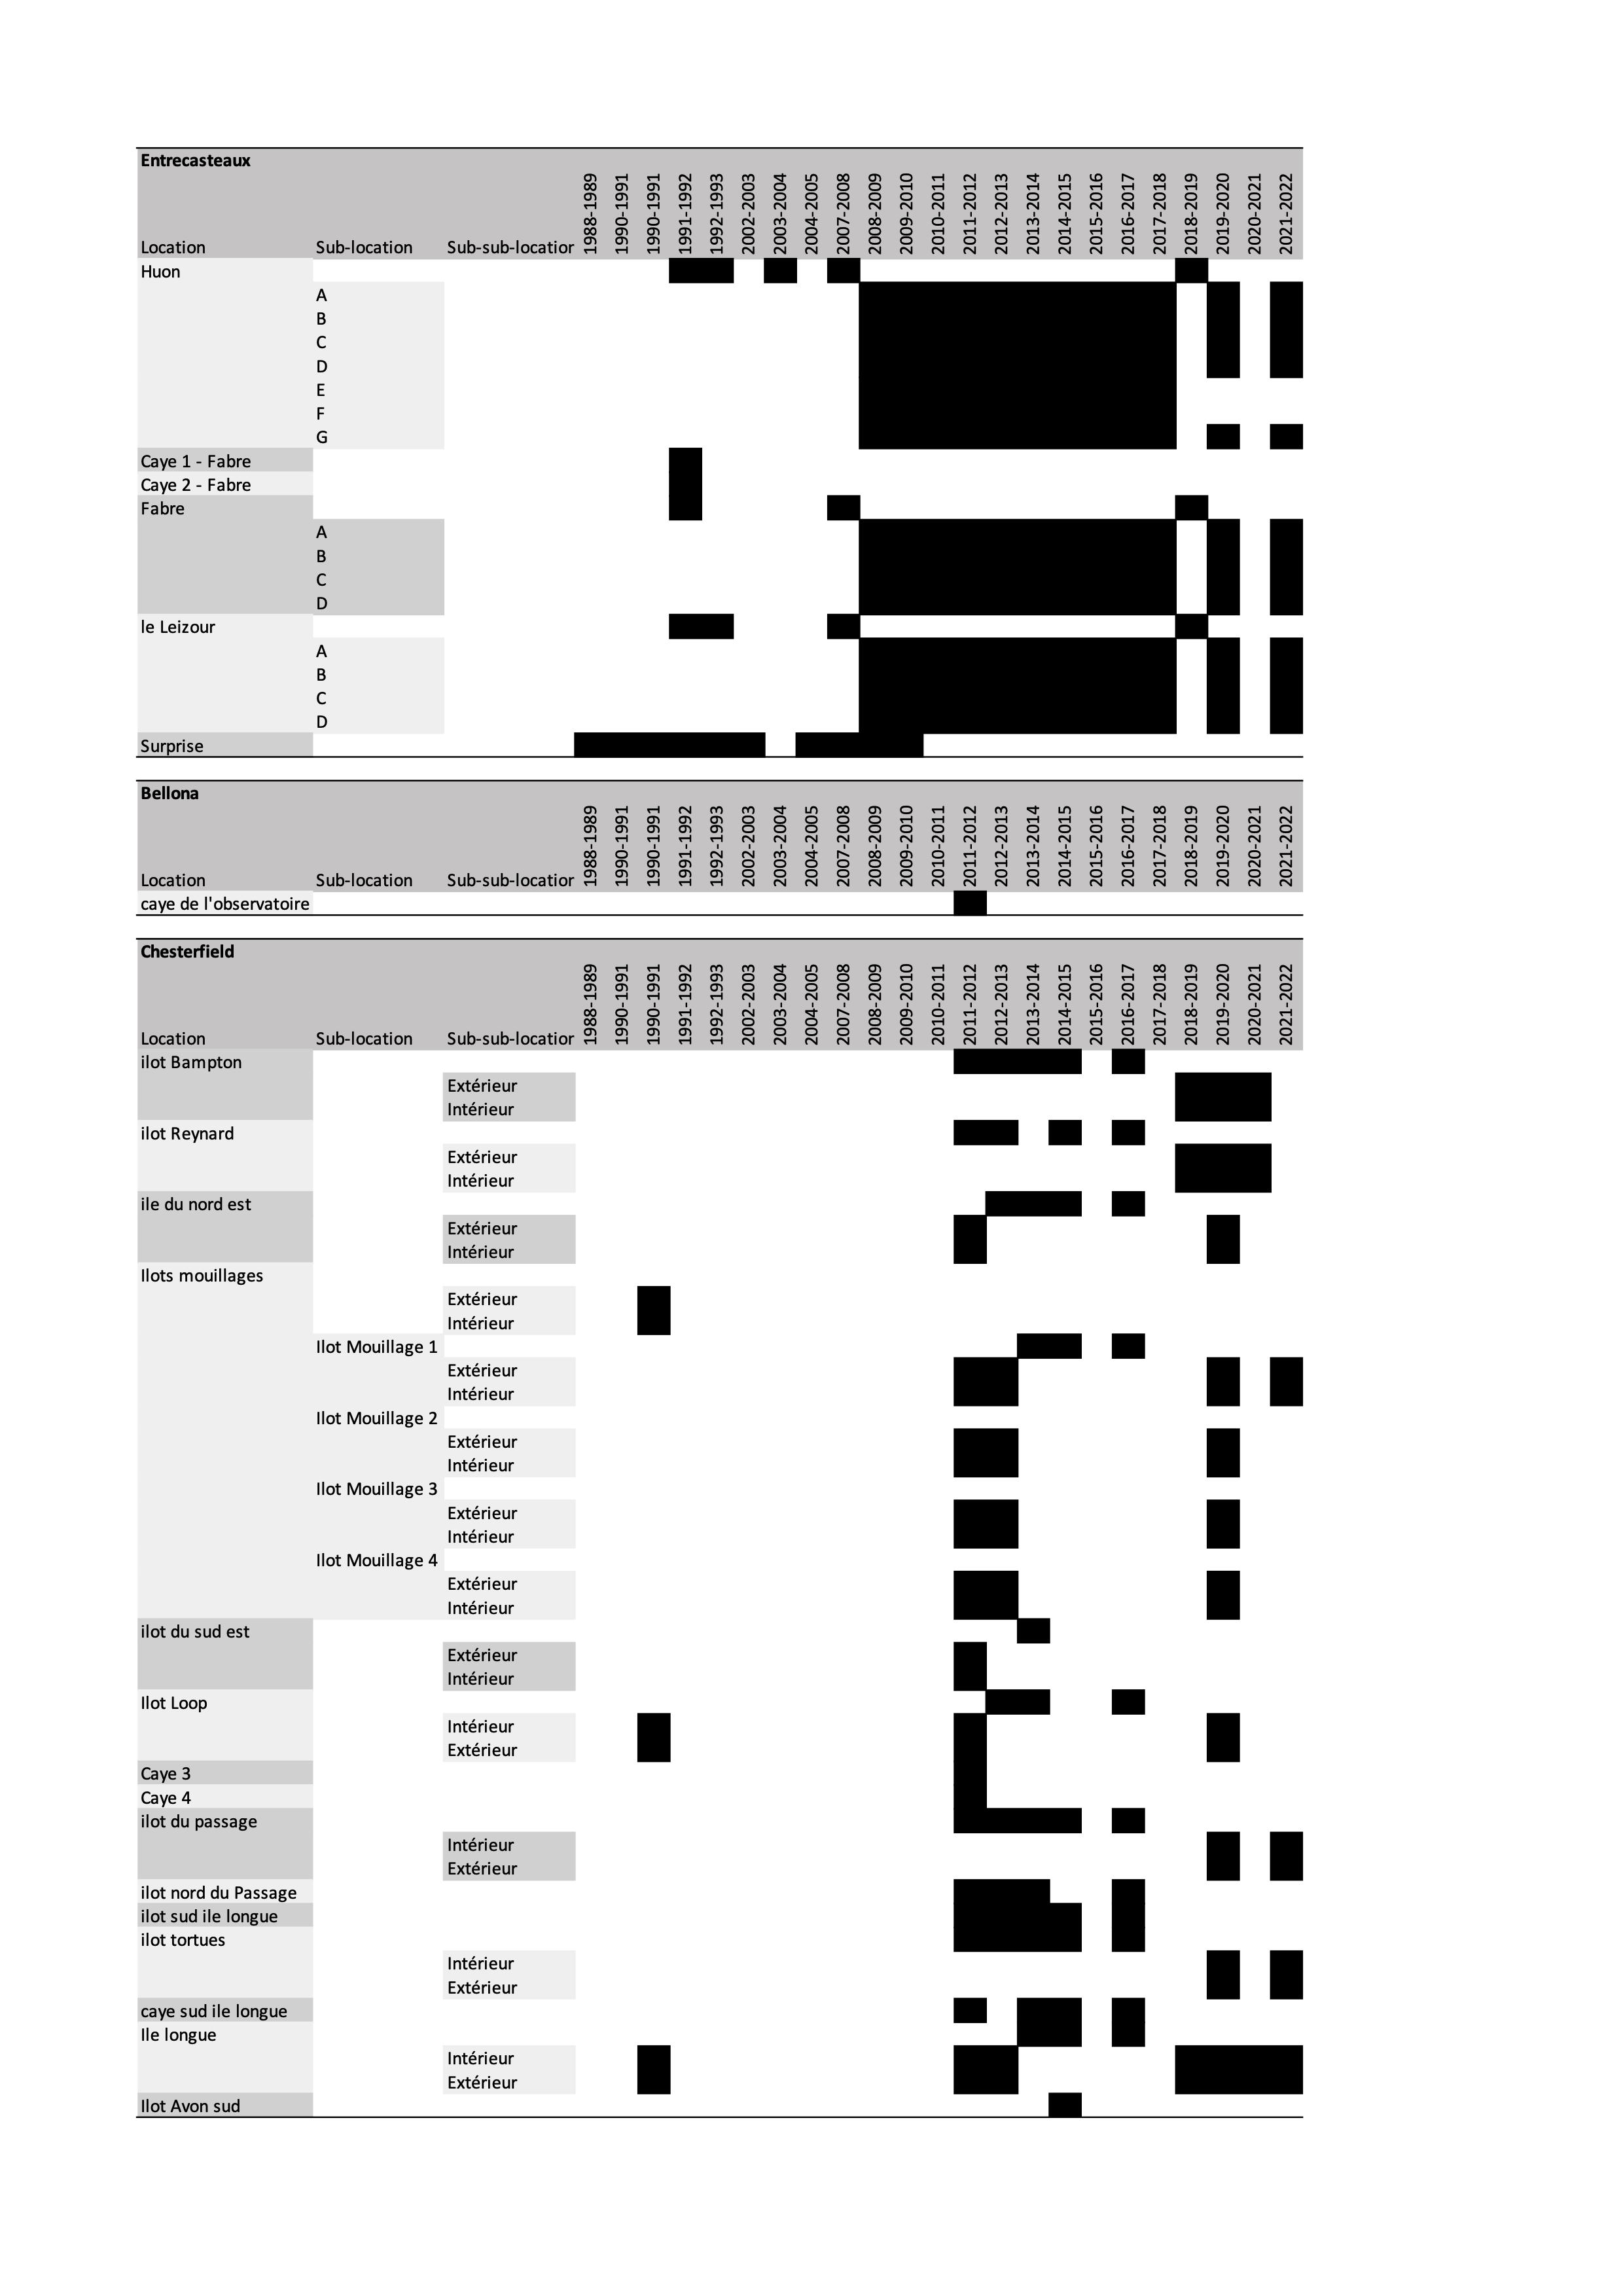
We used the nightly nesting data in two stages. Firstly, we modelled the phenology of nesting for each cay or island to estimate the total number of tracks for a particular year and location. Secondly, we used a spatialized model to estimate the overall trend. In total there were 1,456 night counts on the d'Entrecasteaux Reefs during 1988–2021 and 371 on the Chesterfield and Bellona Reefs during 1990–2021 (Supplementary Table 1).
Model for nesting seasonality
We modelled nesting seasonality following a phenological model developed specifically for marine turtles (Girondot, Reference Girondot2010, Reference Girondot2017). This model can be applied to any proxy of nesting such as clutch, nest or track counts. Here we applied it to the number of tracks. The parameters have direct biological interpretations: Peak is the ordinal date of the peak of the nesting season, LengthB and LengthE are the lengths of the nesting season from the beginning to the peak and from the peak to the end, respectively, Max is the mean number of tracks at the peak of the nesting season and PMin is the mean nightly per cent of track numbers relative to Max (Min = Max × PMin/100) before and after the nesting season. A symmetrical nesting season is defined by Length = LengthB = LengthE. The parameter k is an aggregation parameter of the negative binomial distribution (Girondot, Reference Girondot2017). Length, LengthB, LengthE and Peak are shape parameters and k, Max and PMin are scale parameters.
Interannual spatial and temporal estimates
A model is used to estimate the number of tracks for a beach that was never patrolled during a given nesting season. Let the total theoretical number of tracks be Ti for year i in the entire region where K beaches were monitored during a range of Y years. The distribution of track numbers across the various beaches is defined by the proportion pj of Ti tracks on beach j. For a total of K beaches, K – 1 parameters p are necessary because of the relation $\sum\nolimits_{j = 1}^K {p_j = 1.}$ The expected number of tracks for year i on beach j is thus Ei,j = Ti × pj.
Let Ni,j be an observed number of tracks with a standard deviation of Si,j. The distribution of Ni,j could be close to a Gaussian distribution when the number of tracks and monitoring coverage are high, although it could also be positively skewed when the number of tracks or monitoring coverage is low. For this reason, we used a gamma distribution to model the data; the gamma distribution is always positive and can show positive skew when the standard deviation is high compared to the mean. We then investigated the parameters that maximized the likelihood, using a gamma distribution for the number of tracks. For the final estimates we used the expected number of tracks Ei,j only when no observations were available; in other situations we preferred the distribution of track numbers fitted using the phenology model.
Synthesis of the data-fitting strategy
The strategy used to fit the parameters is the same for the seasonality model, and the strategy used for the interannual spatial and temporal trend model is similar to that used by Morales-Mérida et al. (Reference Morales-Mérida, Muccio and Girondot2023).
None of the data collected from d'Entrecasteaux, Chesterfield or Bellona Reefs allowed us to fit all of the parameters of a complete nesting season because most of these missions were short (< 15 days) and only occurred around the peak of the nesting season, which prevents us from determining the limits of the nesting season. We obtained the longest time series for New Caledonia during 2003–2004. We then searched for the available time series of green turtle counts that was the nearest to New Caledonia. We took two time series available in the literature for the Coral Sea: Bramble Cay 1979–1980 in Torres Strait (9.1425° S, 143.8761° E; Limpus et al., Reference Limpus, Carter and Hamann2001; Whiting et al., Reference Whiting, Chaloupka, Pilcher, Basintal and Limpus2021) and Heron Island (23.4423° S, 151.9148° E; C. Limpus, pers. comm. in Whiting et al., Reference Whiting, Chaloupka, Pilcher, Basintal and Limpus2021; Fig. 1). However, the 1979–1980 data for Bramble Cay, which are supposed to be the same as those shown in Fig. 5 in Limpus et al. (Reference Limpus, Carter and Hamann2001) and Fig. S2a in Whiting et al. (Reference Whiting, Chaloupka, Pilcher, Basintal and Limpus2021), appear to be different. For this reason, we used only the original data (Limpus et al., Reference Limpus, Carter and Hamann2001) instead of those from Whiting et al. (Reference Whiting, Chaloupka, Pilcher, Basintal and Limpus2021).
We associated the time series of nest track counts with the reef of origin (Bellona, Chesterfield and d'Entrecasteaux), the cay or island (sometimes its subsection) and the season (centred on December). We fitted each time series using the previously fitted Huon Cay in the d'Entrecasteaux Reefs with the 2003–2004 shape phenology as a guide. We then estimated the median and 95% CI for the total number of tracks during the season. As the posterior predictive distribution of the track numbers is not symmetrical, we used a gamma distribution to model the distribution of uncertainty in the number of nests. We fitted the matrix of the total number of tracks within each location and each nesting season to fill in the missing information. For this we fitted a global SD value, the constant proportion for the use of different beaches and a year-specific estimate of the total number of tracks in the season. We fitted the data separately for Bellona–Chesterfield and d'Entrecasteaux, and for all reefs together. We then tested the models that did and did not group the data using the Akaike information criterion corrected for small sample sizes (AICc) and the Akaike weight (Burnham & Anderson, Reference Burnham and Anderson2002). Briefly, AICc evaluates the quality of the fit and penalizes the overfitting of too many parameters, whereas the Akaike weight gives the relative support for the different models (i.e. the probability that each model is the best one). This allowed us to test whether a single model was sufficient to fit the Bellona–Chesterfield and d'Entrecasteaux distributions of nesting track numbers or whether a different model should be used for these two reefs.
Signature of South Pacific nesting sites
The number of green turtle nests observed in two distant nesting sites in Australia (Heron Island and Raine Island; Fig. 1) has been shown to be correlated with the sea-level pressure measured at Darwin (Australia) Station (Limpus & Nicholls, Reference Limpus and Nicholls1988). In a more recent analysis the correlation was calculated using the mean Southern Oscillation Index during May–October 2 years before the breeding season (Limpus & Nicholls, Reference Limpus, Nicholls, Hammer, Nicholls and Mitchell2000). The Southern Oscillation Index is a time series used to characterize large-scale sea-level pressure patterns at Tahiti (French Polynesia) and Darwin (Australia) meteorological stations in the tropical Pacific. We used monthly mean Southern Oscillation Index values obtained from the Climate Prediction Center (2022). The Southern Oscillation Index is linked to large-scale tropical sea-surface temperature variability, and as such it is a measure of the Southern Oscillation part of the El Niño–Southern Oscillation phenomenon. We searched the Southern Oscillation Index signatures for Heron Island, Raine Island, d'Entrecasteaux and Chesterfield–Bellona nest or track time series using the standardized residuals of linear fitting for each time series. The reason for using residuals instead of nest counts is to remove the trends of the time series. We standardized these residuals by dividing them by the range of observed residuals for each site to take into account the fact that the level of nesting was different in different rookeries. We conducted the analysis of the Heron Island and Raine Island nest count data again to confirm the presence of the original observed correlation with the Southern Oscillation Index because in the original analysis the number of nests was not standardized and the trend was not removed (Limpus & Nicholls, Reference Limpus, Nicholls, Hammer, Nicholls and Mitchell2000).
Results
Phenology of green turtles in Australia compared with New Caledonia
We fitted the Bramble Cay 1979–1980 time series with Peak, Length, PMin, Max (symmetrical model) or LengthB, Peak, LengthE, PMin, Max (asymmetrical model) and k. We selected the symmetrical model based on AICc (Akaike weight = 0.66).
We tested different combinations of parameters to fit a phenological model of the New Caledonian data with the time series from Huon Island during 2003–2004 and Bramble Cay during 1979–1980. The selected model is symmetrical and has a different peak date and nesting season length for both time series (Table 1, Fig. 2). The fitted dates for seasonality in Huon Island during 2003–2004 and Bramble Cay during 1979–1980 are shown in Table 2. We used the fitted parameters Length, Peak, PMin and k describing phenology in Huon Island during 2003–2004 as well as their distribution based on 10,000 iterations using a Markov chain built with Monte Carlo sampling (Morales-Mérida et al., Reference Morales-Mérida, Muccio and Girondot2023) in all of the fits performed with the New Caledonian data. We fitted only the Max parameter for each time series.

Fig. 2 Number of tracks in (a) Bramble Cay in the Torres Strait during the 1979–1980 nesting season (Limpus et al., Reference Limpus, Carter and Hamann2001) and (b) Huon Cay in the d'Entrecasteaux Reefs during the 2003–2004 nesting season. The central solid line in each graph represents the median of the selected phenological model (Table 1) and the dark grey band represents the 95% CI. The light grey band in each graph represents the 95% probability of the number of tracks per night based on the fitted negative binomial distribution.
Table 1 Model selection for the phenology of the number of green turtle Chelonia mydas nesting activities at Huon Island during 2003–2004 (d'Entrecasteaux Reefs, New Caledonia) and Bramble Cay during 1979–1980 (Torres Strait, Australia; Fig. 1). When the phenology is symmetrical around the peak, only one parameter Length = LengthB = LengthE is used, but when the phenology is asymmetrical around the peak, the LengthB and LengthE parameters can differ. If the peak and lengths are indicated as ‘Common’, then this indicates that a single set of values is used for both Huon Island and Bramble Cay; otherwise, a different set of values is used for each location. The selected model (Table 2) is shown in bold.

1 LengthB, length of the nesting season from the beginning to the peak; LengthE, length of the nesting season from the peak to the end.
2 AICc, Akaike information criterion corrected for small sample sizes. ΔAICc is the difference in AICc from the best-performing model.
Table 2 Posterior predictive phenology indicators of the number of green turtle nesting activities in Huon Island during 2003–2004 (d'Entrecasteaux Reefs, New Caledonia) and Bramble Cay during 1979–1980 (Torres Strait, Australia) for the selected phenological model (Table 1).

Quantification of green turtles nesting in New Caledonia
We fitted each time series from New Caledonia using the fitted parameters Peak, Length, PMin and k describing phenology in Huon Island during 2003–2004 (see previous subsection) as fixed parameters, with Max being specific to each New Caledonian time series. We obtained the posterior predictive mean number of nests during the season by taking into account the posteriors of both the fitted parameters from the Huon Island during 2003–2004 time series (Peak, Length, PMin and k) and the posterior of the Max parameter for each New Caledonian time series.
We then estimated the number of nesting activities for the locations not monitored during a season to provide an overall estimate for each subsection, cay and reef. Separate models for the Bellona–Chesterfield and d'Entrecasteaux Reefs were strongly supported compared to a single model for these locations (ΔAICc = 110.53, Akaike weight = 1). The overall annual number of nesting activities in the d'Entrecasteaux Reefs ranged from 5,513 (95% CI = 3,998–7,294) during 2012–2013 to 103,511 (95% CI = 69,031–152,711) during 2004–2005. The overall annual number of nesting activities in the Bellona–Chesterfield Reefs ranged from 1,676 (95% CI = 599–4,458) during 2012–2013 to 39,277 (95% CI = 27,078–51,781) during 2021–2022 (Fig. 3). The 10,000 posterior predictive trends using linear regressions are shown in Fig. 3a for the d'Entrecasteaux Reefs and in Fig. 3b for the Chesterfield–Bellona Reefs. The number of nesting activities in the d'Entrecasteaux and Chesterfield–Bellona Reefs are highly significantly correlated (Pearson correlation, r = 0.80, P = 0.01). We tested each of the 10,000 slopes to determine the probability that a significant (P = 0.05) trend could be observed. The probabilities of a significant negative, stable or positive trend are < 0.001, > 0.999 and < 0.001, respectively, for the d'Entrecasteaux Reefs and 0.002, 0.996 and 0.002, respectively, for the Chesterfield–Bellona Reefs.

Fig. 3 Estimate of the total numbers of green turtle nesting activities during seasons with monitoring in (a) the d'Entrecasteaux Reefs and (b) the Bellona and Chesterfield Reefs when the fitted spatial and temporal model is fitted separately for the two reefs. The whiskers represent the 95% CI and the circles are the median estimates. The grey lines represent 10,000 posterior predictive regression lines.
South Pacific signature
We calculated the relationship between the lagged Southern Oscillation Index during 0–40 months before the January of the breeding season and the standardized residual numbers of nests for the two Australian nesting sites (Heron Island and Raine Island; Fig. 4a) as well as for the New Caledonian sites (d'Entrecasteaux and Chesterfield–Bellona Reefs; Fig. 4c). The 6-month mean effect of the Southern Oscillation Index 2 years before the breeding season (May–October) is highly significantly correlated with the standardized residual of the number of nests in both locations (Fig. 4b,d).

Fig. 4 Relationship between 0–40 month lagged Southern Oscillation Index (SOI) and the standardized residual numbers of nests in (a) Australia and (b) New Caledonia. The scatterplots represent the standardized residual numbers of nests in (c) Australia and (d) New Caledonia in relation to the 6-month mean SOI (May–October) 2 years prior to the nesting season.
Discussion
For the first time we have estimated the overall nesting activities of green turtles in New Caledonia in the remote uninhabited reefs of Chesterfield, Bellona and d'Entrecasteaux. The total annual number of nests is high, ranging from < 10,000 in some years to > 50,000 for the lowest limit of the 95% CI for others, and up to 150,000 nesting tracks for the highest limit of the 95% CI (Fig. 3). Even if the CI is large, the lower limit of this CI indicates that the d'Entrecasteaux and Chesterfield–Bellona sites are exceptional sites for nesting green turtles.
The correlation between the number of nesting activities in the Chesterfield–Bellona and d'Entrecasteaux Reefs is high and statistically significant (Pearson correlation, r = 0.80, P = 0.01). Note that the lowest number of nesting activities occurred in the same years for both reefs (2012–2013 and 2018–2019; Fig. 3). We observed a strong correlation between the number of nests in the distant sites of Raine Island (Torres Strait) and that of Heron Island located 1,850 km to the south (r = 0.77, P < 0.0001; Limpus & Nicholls, Reference Limpus, Nicholls, Hammer, Nicholls and Mitchell2000), which could be a characteristic shared by Coral Sea nesting sites. The green turtles nesting on the d'Entrecasteaux and Chesterfield–Bellona Reefs are geographically close to those nesting in the Great Barrier Reef area in eastern Australia, and frequent exchanges of individuals have been noted between these two locations (Limpus, Reference Limpus2009). This could indicate that the same resources are shared between these populations. In green turtles, breeding rates are regulated to some extent by regional climatic events driven by the El Niño–Southern Oscillation (Limpus & Nicholls, Reference Limpus and Nicholls1988, Reference Limpus, Nicholls, Hammer, Nicholls and Mitchell2000). The El Niño–Southern Oscillation is therefore a forcing factor that synchronizes the nesting of green turtles and produces large interannual changes in the number of nesting activities. We found the same correlation signature between the May–October Southern Oscillation Index 2 years before the breeding season and the standardized residual of the number of nests in Heron Island and Raine Island (Limpus & Nicholls, Reference Limpus, Nicholls, Hammer, Nicholls and Mitchell2000) as well as in the d'Entrecasteaux and Chesterfield–Bellona Reefs. This result indicates that the estimations made for the d'Entrecasteaux and Chesterfield–Bellona Reefs drew on some shared information, even if they were produced using limited data for each season. This is an encouraging result when working in such remote locations with their associated logistical difficulties. For the modelling we used the strong assumption that the nesting season was similar across all sites of New Caledonia and throughout all nesting seasons (Fig. 2). At this stage we cannot prove whether this is correct, although operating on this assumption has not greatly degraded the signal because the South Pacific signature is still present.
The values reported here are the total number of tracks, which include both females coming to the beach and depositing eggs and those coming to the beach but returning to the sea without nesting. It is impossible at this stage to convert the total number of nesting activities reported into the number of nests deposited on the beach or the number of individual females. However, it is possible to find such conversion factors in the literature for other locations, although they should be adapted to the local context to be pertinent. We thus prefer to present the data as the number of tracks.
Threats in the remote reefs of New Caledonia
It was mentioned in some reports that during certain missions cadavers of dehydrated female green turtles were observed, these turtles perhaps having been disorientated on their return to the sea. For example, six females were discovered dead on Huon Island in 1995. Pritchard (Reference Pritchard, Schroeder and Witherington1994) also mentions seeing dead females on Huon Island, specifying that they were not stuck on obstacles that prevented them from regaining the sea. Read & Fontfreyde (Reference Read and Fontfreyde2012, p. 20) wrote: ‘When counting tracks, we have repeatedly observed individuals trapped in Huon's beachrock but the mortality in the beachrock is low’ (translated from French). These authors also noted that eggs laid during the season but unearthed by other turtles laying their eggs during the same season were observed on several occasions on Huon Island. Courchamp (Reference Courchamp2003) indicated that fishermen from the Belep Islands came to the d'Entrecasteaux Reefs to capture unknown numbers of turtles.
Predators of hatchlings in the study area are numerous, being present in both the sand and water (Read & Fontfreyde, Reference Read and Fontfreyde2012). These range from greater crested terns Thalasseus bergii and buff-banded rails Gallirallus philippensis to ghost crabs Ocypode sp., blacktip reef sharks Carcharhinus melanopterus and giant trevallies Caranx ignobilis. This list of predators is not exhaustive and only includes those predations observed during the various missions. Rodents have been introduced by people to the d'Entrecasteaux islets. The black rat Rattus rattus abounds on Surprise Island but seems to be absent on Huon, Le Leizour and Fabre Islands. The house mouse Mus musculus is also present but its population is low. As early as the early 1980s the possible predation of eggs by rats was described on Surprise Island (Lorvelec, Reference Lorvelec2002). The predation of hatchlings by rats has also been observed on various occasions (Jean-Louis d'Auzon, pers. comm. in Lorvelec, Reference Lorvelec2002). An initial rat control campaign was implemented unsuccessfully in 2000. Three years later a large population of R. rattus was confirmed on Surprise Island in the d'Entrecasteaux Reefs (Caut et al., Reference Caut, Angulo and Courchamp2008). It was estimated that in February, when chickens are absent from Surprise Island, turtle hatchlings are the main diet of rats (Caut et al., Reference Caut, Angulo and Courchamp2008).
In the January 2012 mission, members of the Caledonian Society of Ornithology confirmed the presence of electric ants Wasmannia auropunctata on Long Island in the Chesterfield Reefs. This ant has been observed in shearwater burrows, but attacks on eggs and hatchlings emerging from the nests have not been observed. Other threats exist but have not been fully characterized. In January 2015, two recently dead turtles were seen on the southern Longue Cay. Turtle skeletons have also been observed on Longue and Reynard Cays.
There is also concern regarding the temperatures at which sea turtle nests incubate in the South Pacific and more specifically in New Caledonia (Read et al., Reference Read, Booth and Limpus2013, Reference Read, Petit, Magnan and Booth2020; Jensen et al., Reference Jensen, Allen, Eguchi, Bell, LaCasella and Hilton2018). A study on the temperatures at both nesting sites would be important for quantifying the importance of these islands for green turtle recruitment in the South Pacific.
Considering the new information provided by this study, these sites should now be considered high-priority areas for sea turtle conservation in the South Pacific and New Caledonia. Safeguards should be implemented to ensure that adequate protection measures are in place to maintain these important nesting sites.
This study conducted in the d'Entrecasteaux and Chesterfield–Bellona Reefs shows for the first time that nesting by green turtles on these remote reefs in the South Pacific has been largely ignored to date when assessing the global status of the green turtle. The median annual total number of nesting activities (i.e. tracks) is 10,000– > 100,000 in the d'Entrecasteaux and Chesterfield–Bellona Reefs, which is more than previously estimated for the entire South Pacific. The trend in the number of nesting activities is positive. Our recommendations for the French authorities are to continue monitoring these populations to ensure the protection of what should be considered a natural treasure for New Caledonia. Priority should be given to estimations of the life-history parameters in these areas, to build a population dynamic model to evaluate the long-term conservation status of this population. These should include sex ratio studies, evaluations of predation at different life stages, the effects of climate change, genetic studies and estimations of the numbers of nests derived from the numbers of tracks.
Acknowledgements
We thank the volunteers who conducted surveys in the d'Entrecasteaux and Chesterfield–Bellona Reefs; the crew members of the Amborella of the New Caledonian government for data collection and the smooth running of operations; the New Caledonian government for its support; Caroline Groseil (Service of Natural Park of the Coral Sea, Nouméa, New Caledonia) for her help in obtaining the most recent data; Victoria Grace for her careful reading and correction of the text; two anonymous referees for their helpful comments; and Martin Fisher for his editorial help.
Author contributions
Study design, fieldwork: TCR, LC, CF, AF, J-AK, VL, MO, MR-T; data analysis: MG; writing: JF, TCR, MR-T, MG.
Conflicts of interest
None.
Ethical standards
This research abided by the Oryx guidelines on ethical standards.
Data availability
Data are available on request to the corresponding author.


 Open access