


Introduction
Holes bored into glaciers have been used to obtain information about ice depths, the structure and composition of the interior of glaciers, and the distribution of velocity within glaciers. The determination of bore-hole tilting plays an essential role in the last of these measurements. An accurate and efficient system for measuring the orientation of bore holes is a valuable tool for investigating glacier flow.
In the pioneering work of Reference Gerrard, Gerrard, Perutz and RochGerrard and others (1952), on the Jungfraufirn, several inclinometers of varying design were used to measure bore-hole orientations. The instrument which ultimately evolved was capable of measuring tilt to an accuracy of ±1.0°, and could be read remotely from the surface. The tilt-sensing mechanism was a pendulum constrained to swing in a plane, thus only the component of bore-hole tilt in this plane was given by a measurement of tilt. It was therefore necessary to control the azimuthal orientation of the pendulum. This was accomplished by using a gyroscopic compass and anti-topple motor, which greatly complicated the design and construction of the instrument. This instrument was found to be very efficient in its field operation, but it lacked the accuracy essential to high-resolution glacier deformation measurements and was difficult to construct.
The most extensive and accurate bore-hole deformation measurements (Reference Savage and PatersonSavage and Paterson, 1963; Reference Kamb and ShreveKamb and Shreve, 1966; Reference Shreve and SharpShreve and Sharp, 1970) have been obtained by use of optical type inclinometers constructed by Parsons Survey Company. This type of inclinometer works by recording the positions of a pendulum bob and compass needle photographically. The photographic record gives magnitude of tilt to an accuracy of about 2% of the maximum amplitude of the pendulum and azimuth of tilt to within 2°. For a single orientation determination the instrument must be loaded with a photographic disk, lowered to the desired depth in the bore hole, and returned to the surface for removal of the photographic record and loading of an unexposed photographic disk for the next measurement. Although this system of inclinometry gives quite accurate results and is reliable, it has the distinct disadvantage of being very inefficient. The high density of orientation measurements which is required for an accurate determination of the shape of a bore hole, demands numerous entries into the hole and considerable expenditure of time and physical effort in raising and lowering the instrument.
This paper describes a newly developed inclinometer with electrical output, which combines in a relatively simple design the advantages of the remote read-out of the earlier inclinometers used on the Jungfraufirn and the greater accuracy of the optical inclinometers. Only one lowering of the instrument is required for complete logging of a bore hole. Its greater efficiency in comparison to the optical methods makes it possible to take a higher density of data in a shorter time, with less physical effort, and with reduced danger of accidental loss of an instrument and blockage of a hole. This new instrument was used with considerable success on the Athabasca Glacier, Alberta, Canada, during the summers of 1967 and 1968. The results of these measurements will be reported in separate articles.

Fig. 1. Schematic diagram of the instrument. Scale is only approximate.
General Description
The basic design is similar to that used in the optical type inclinometer. The positions of a pendulum bob and compass needle are determined by the electrical output of photodiodes (solar cells) mounted in a manner such that the area of illumination by a light source of fixed intensity varies with changing orientation. The light source is powered and controlled from the surface, and is monitored within the instrument by a separate photodiode not affected by any displacement of the pendulum or compass. Since the efficiency of energy conversion of the photodiodes is temperature dependent, the instrument would not be satisfactory for general applications in a temperature-changing environment without some method of temperature compensation. However, in the nearly isothermal environment of a water-filled bore hole, such temperature dependence presents no problem.
Figure 1 illustrates the arrangement of the basic components in the instrument.
Pendulum Unit
The pendulum unit sits below the light source. A square pendulum bob (1.48cm × 1.48 cm) is suspended from four parallel chains of equal length, so that the azimuthal orientation of the pendulum bob relative to the inclinometer case is fixed and remains unchanged upon tilting. The pendulum bob swings in a square aperture (2.46 cm × 2.46 cm) whose sides are parallel to those of the bob. The length of the chains determines the maximum possible angular swing of the pendulum in the square aperture and thus the maximum possible measurable tilt magnitude of the pendulum unit. The sides of the squares define two perpendicular directions (x and y axes) fixed in the instrument body. Beneath the pendulum bob are four silicon photodiodes (0.98 cm × 0.49 cm) mounted normal to the sides of the pendulum weight and parallel to the x and y axes, in such a manner that approximately 50% of the area of each cell is shaded from the light source at zero inclination. Cells on opposite sides of the pendulum bob are connected electrically “back-to-back” as shown in Figure 1. The output of each cell pair is then approximately zero at zero inclination. The adjustable resistance in the circuit of each cell pair allows some adjustment so that the outputs at zero inclination can be set to zero in the event of small differences in efficiency of the photo-cells and non-uniformity of illumination. When the instrument is tilted, the output changes as one of the cells becomes more shaded and the other less shaded.
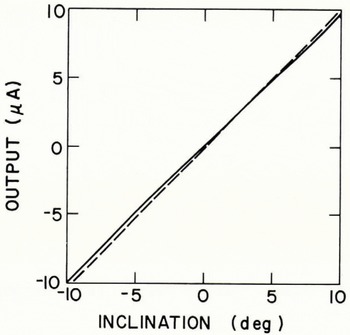
Fig. 2. Calibration curves for a pendulum unit of approximately 10º maximum amplitude. Solid curve: y-axis. Dashed curve: x-axis.
Pendulums of different maximum amplitude can be easily interchanged in the instrument. The instrument has been used with pendulums of 10º, 20°, and 30° maximum amplitude. Figure 2 shows the form of the electrical output versus tilt for a pendulum with 10º maximum amplitude. Plotted is the electrical output for a given cell pair (x or y) when the instrument is tilted in a vertical plane parallel to the axis of the cell pair. The two perpendicular vertical planes defined by the cell pairs are designated as the x and y planes. If the instrument is tilted in a plane not parallel to the x or y planes, then the curves of Figure 2 can be used to determine x and y components of till, provided that the x and y outputs are not coupled (i.e. the x output docs not change with a variation of the y component of tilt and vice versa). Experience has shown that by blackening all non-light-transmitting and non-photo-sensitive surfaces to avoid unwanted reflections, and by taking care in achieving parallelism and equality of length of the suspension chains so that the pendulum bob does not twist upon tilting, the effects of coupling of the x and y outputs can easily be limited to 1% of the total amplitude of the pendulum. The x and y components of tilt can then be combined in a simple trigonometric calculation to give, to a good approximation, the magnitude of tilt and azimuth of tilt with respect to the x or y planes.
Compass Unit
Complete determination of the orientation of the instrument requires knowledge of the azimuth of the x or y planes. The compass unit serves to determine the azimuthal orientation of the instrument body and thus the x and y planes. The compass assembly is mounted above the light. A cylindrical bar magnet is mounted on a shaft that turns in jewel bearings. A card rigidly attached to this shaft has a spiral-shaped aperture cut in it, so that the area of illumination on a photo-cell above the card depends on the relative azimuthal orientation of the card and the inclinometer body. Two such cells (designated A1 and A2) are read independently.
The forms of the output versus relative orientation of the instrument body and compass card for the two cells are shown in Figure 3. The shapes of the calibration curves could be altered by modification of the compass card aperture. No attempt was made to optimize the shape of the aperture because friction in the compass bearings is the dominant limitation on the resolution of the compass unit. Since for any aperture shape the output curve for each cell must necessarily be continuous, the electrical output of a single cell corresponds to at least two possible orientations. With the aperture actually used, the output of a single cell (A1 or A2) gives two possible orientations. The two pairs from the two cells are compared, and the orientation which is common to both pairs gives the correct orientation.
Supporting Components
Because of the five independent current measurements (x-axis, y-axis, A1, A2, and light standard) required for an orientation determination, a stepping relay is used in the instrument. Activation of the relay from the surface causes successive instrument components to be sequentially connected to the output channel. With this feature a four-conductor cable provides a sufficient number of independent conductors.
After the first extensive field use of the instrument, it was modified to include a vibrator for the purpose of reducing the effects of friction in the compass bearings. The vibrator consists of an eccentric cam on a flexible shaft which is powered by a direct-current electric motor. The vibrator is activated with each advance of the stepping relay.
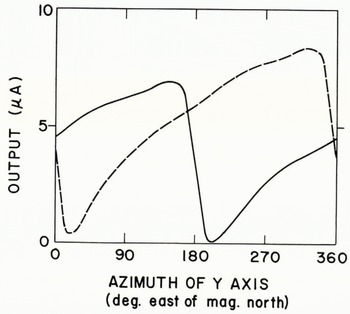
Fig. 3. Calibration curves for compass unit. Solid curve; A1 cell. Dashed curve: A2 cell.
Both the motor and the stepping relay are sufficiently far from the compass magnet (greater than 25 cm) to avoid detectable perturbation of the compass.
The complete inclinometer assembly is in a waterproof outer case (diameter 4.2 cm. length 88 cm) sealed with O-rings. The suspension cable contains four insulated “copper weld” conductors (number 18 American wire gauge). Electrical connection of the instrument to the cable is made with a four-prong “Cannon” plug. The plug is also isolated from water by O-ring seals.
Equipment at the surface includes three 6 V batteries for powering the light source (70 mA at 5.4 V), an ammeter (100 mA full scale) for monitoring light current, one 45 V battery for activating the stepping relay and motor-driven vibrator, an ammeter (10 μA full scale, taut band movement, 0.2% reproducibility) for reading the instrument output, and supporting switches, resistances, and diodes for light-current regulation, protection of the microammeter, and control of the instrument components. These are integrated into a compact control unit for easy transport and convenient use.
Field Procedure and Performance
In actual field operation, the instrument is calibrated before and after each use, thus any drift resulting from changes in light intensity and the efficiency of the cells can be detected. In the case of the pendulum unit calibrations before and after the logging of a 300 m hole at 2 m intervals have agreed to within 1% of the maximum amplitude of the pendulum. In the case of the compass unit the reproducibility of the electrical output is limited by friction in the compass bearings. Without the vibrator, as the instrument was used in the summer of 1967, error caused by friction could be as great as 20°. With the vibrator the possible error caused by friction is less than 10°, as shown by field results in the summer of 1968.
Calibration in the field is accomplished by use of a specially constructed calibration stand. When mounted in the leveled stand, the instrument can be tilted up to 36° from vertical at ½, 1, and 2° intervals determined by precisely located stops. Systematic error in the tilt magnitude calibration caused by imprecise leveling of the stand is easily evaluated and eliminated by 180 º rotation of the instrument and recalibration. The instrument can also be rotated at precise 30º intervals for the purpose of calibrating the compass unit. Because of the temperature dependence of the instrument components, the actual calibration is carried out with the instrument immersed in ice-cold water.
Use of the instrument is very simple. Field experience has shown that a 300 m bore hole can be completely logged at 2 m intervals in about 4 to 5 h including the time for setting up, calibration, recalibration, and dismantling the instrument. The accuracy and density of orientation data given by such a logging are sufficient to determine the relative horizontal coordinates of the surface intersection and bottom of the bore hole to within 0.25 m.
The main disadvantage of this method of inclinometry is that the electrical outputs cannot be interpreted quickly in terms of tilt magnitude and azimuth at the time the measurement is made in the field. Large blocks of data are most efficiently reduced on a digital computer.
Acknowledgements
The author drew considerably on the technical skills of Curtis Bauman, Sol Giles, Devere Smith, and James Westphal of the California Institute of Technology in the design and construction of the instrument. Professor W. B. Kamb was a particularly helpful source for ideas. Development of the instrument was supported by the National Science Foundation under grant number 5447.
MS. received 19 June 1970


