


Impact Statement
Organisms often carry loads (e.g. captured prey) that can hinder their locomotion. We used models and experiments to study microorganisms at low Reynolds number to determine how loads affect swimming and feeding performance. Focusing on unicellular choanoflagellates, which wave a flagellum to swim and create a water current transporting bacterial prey to a microvilli collar, we discovered that swimming speed decreases as number of prey increases. Flux of water into a choanoflagellate's capture zone is reduced by bacteria on the collar, and feeding efficiency is decreased more by prey in the plane of flagellar beating or near microvillar tips than by prey in other locations.
Our computational model captures morphological details of the choanoflagellate and attached prey. This regularized Stokeslet framework may also be used to probe the hydrodynamics of biohybrid microswimmers, where added loads such as microcaps are fitted to natural microorganisms to steer them for targeted drug delivery.
1. Introduction
Experimental analyses and mathematical models of the fluid dynamics of swimming and flying are generally done for organisms that are not carrying loads. However, swimmers and fliers often carry loads (e.g. captured prey, nesting material, eggs) in their natural environments. If load carrying hampers the aero- or hydrodynamic performance of a flier or swimmer, this can have important ecological consequences such as hindering an organism's escape from predators, slowing its travel through the environment, reducing its foraging effectiveness and increasing its energy requirements.
Experimental studies have shown that load carrying altered the performance of animals operating at high and intermediate Reynolds numbers ( $Re$), where inertial forces are important. For example, flying animals must increase lift production when carrying additional weight, and must increase thrust to overcome the drag on the objects being carried. For animals flying at high $Re$, load carrying decreased the speed and increased the power requirements and energetic costs for birds (e.g. Reference AlexanderAlexander, 2004; Reference Chai, Chen and DudleyChai, Chen, & Dudley, 1997; Reference Chai and MillardChai & Millard, 1997), bats (e.g. Reference MacAyeal, Riskin, Swartz and BreuerMacAyeal, Riskin, Swartz, & Breuer, 2011) and insects (e.g. Reference Altshuler, Dickson, Vance, Roberts and DickinsonAltshuler, Dickson, Vance, Roberts, & Dickinson, 2005; Reference Buchwald and DudleyBuchwald & Dudley, 2010; Reference Coelho and HoaglandCoelho & Hoagland, 1995; Reference Dillon and DudleyDillon & Dudley, 2004; Reference Mountcastle and CombesMountcastle & Combes, 2013; Reference Muijres, Chang, van Veen, Spitzen, Biemans, Koehl and DudleyMuijres et al., 2017). Although supporting the weight of a load is not as important to aquatic swimmers as it is to flying animals, swimmers do have to overcome the increase in hydrodynamic resistance to their locomotion caused by a carried load. At intermediate $Re$, female copepods (body lengths of the order of millimetres) carrying external egg cases swam more slowly, had higher respiration rates and were more vulnerable to capture by fish predators than were females without eggs (Reference Lehette, Ting, Chew and ChongLehette, Ting, Chew, & Chong, 2016; Reference Mahjoub, Souissi, Michalec, Schmitt and HwangMahjoub, Souissi, Michalec, Schmitt, & Hwang, 2011; Reference Parra, Jiménez-Meler and GuerreroParra, Jiménez-Meler, & Guerrero, 2003; Reference SeurontSeuront, 2006, Reference Seuront2013; Reference Svetlichny, Hubareva and IsinibilirSvetlichny, Hubareva, & Isinibilir, 2017; Reference Svetlichny, Hubareva and KhanaychenkoSvetlichny, Hubareva, & Khanaychenko, 2012). The effects of load carrying on microorganisms (body lengths of order 1 to 100 $\mathrm {\mu }$m) swimming at low $Re$, where viscous forces predominate, have received little attention.
Microscopic eukaryotes that eat bacteria, phytoplankton or other protozoans are critical components of marine and freshwater food webs (e.g. Reference Azam, Fenchel, Field, Gray, Meyer-Reil and ThingstadAzam et al., 1983; Reference FenchelFenchel, 1987; Reference Jürgens and MassanaJürgens & Massana, 2008; Reference Laybourn-Parry and ParryLaybourn-Parry & Parry, 2000; Reference Ohtsuka, Suzaki, Horiguchi, Suzuki and NotOhtsuka, Suzaki, Horiguchi, Suzuki, & Not, 2015; Reference TillmanTillman, 2004; Reference Weisse, Anderson, Arndt, Calbet, Hansen and MontagnesWeisse et al., 2016; Reference Worden, Follows, Giovannoni, Wilken, Zimmerman and KeelingWorden et al., 2015). In spite of their ecological importance, little is known about the hydrodynamic consequences for these low- $Re$ swimmers of carrying captured prey. Some experimental evidence that load bearing affects swimming at low $Re$ comes from studies of biohybrid microswimmers used for targeted drug delivery (Reference Schwarz, Medina-Sanchez and SchmidtSchwarz, Medina-Sanchez, & Schmidt, 2017; Reference Wu, Chen, Mukasa, Pak and GaoWu, Chen, Mukasa, Pak, & Gao, 2020). This intriguing technology uses living microorganisms or sperm to carry structures such as microcaps (Reference Xu, Medina-Sánchez, Maitz, Werner and SchmidtXu, Medina-Sánchez, Maitz, Werner, & Schmidt, 2020) or beads (Reference Weibel, Garstecki, Ryan, DiLuzio, Mayer, Seto and WhitesidesWeibel et al., 2005; Reference Yasa, Erkoc, Alapan and SittiYasa, Erkoc, Alapan, & Sitti, 2018) used for magnetic steering of the swimmers. There are some reports that carrying a load reduces the swimming speed of these microswimmers. For example, tumour-targeting bacteria, Salmonella typhimurium, have been used to carry liposomes loaded with an anti-tumour drug to cancer cells. These liposome-carrying microswimmers swam at a mean speed of 3 $\mathrm {\mu }$m s $^{-1}$ (Reference Nguyen, Han, Choi, Cho, Zheng, Ko and ParkNguyen et al., 2016), whereas S. typhimurium without loads swam at 20 $\mathrm {\mu }$m s $^{-1}$ (Reference Khoramian-Falsafi, Harayama, Kutsukake and PechereKhoramian-Falsafi, Harayama, Kutsukake, & Pechere, 1990). Similarly, when very small (cell ${\rm diameter} = 10 \mathrm {\mu }$m) biflagellated unicellular algae, Chlamydomonas reinhardtii, carried 3 $\mathrm {\mu }$m beads, they swam at an average speed of 136 $\mathrm {\mu }$m s $^{-1}$, whereas they swam more rapidly (162 $\mathrm {\mu }$m s $^{-1}$) without attached beads (Reference Yasa, Erkoc, Alapan and SittiYasa et al., 2018). The velocity of the biohybrid C. reinhardtii depended on the location of the attached beads, with those close to or on the flagella impeding forward motion more than those elsewhere on the cell body (Reference Weibel, Garstecki, Ryan, DiLuzio, Mayer, Seto and WhitesidesWeibel et al., 2005).
Here we use the marine choanoflagellate Salpingoeca rosetta as the research system to study effects of captured prey on the hydrodynamic performance of microswimmers (Reference LeadbeaterLeadbeater, 2015). Salpingoeca rosetta has a complex life cycle with various types of free-swimming and sessile life stages, and is able to form multicellular colonies (e.g. Reference Brunet and KingBrunet & King, 2017; Reference KoehlKoehl, 2021; Reference LeadbeaterLeadbeater, 2015). We focused on the unicellular ‘slow swimmer’ stage of S. rosetta (Reference KoehlKoehl, 2021; Reference Mino, Koehl, King and StockerMino, Koehl, King, & Stocker, 2017; Reference Nguyen, Koehl, Oakes, Bustamante and FauciNguyen, Koehl, Oakes, Bustamante, & Fauci, 2019), which has an ovoid cell body and a single flagellum surrounded by a collar of microvilli (figure 1). The cell swims by waving its flagellum, which also creates a water current that brings bacteria to the collar of prey-capturing microvilli (figure 1). These unicellular organisms are ideal for studying load carrying by microswimmers because: (1) the bacteria they carry on their collars are easy to count and (2) they are a well-studied model organism for research into the evolutionary origins of animals (choanoflagellates and sponges have a common ancestor) (e.g. Reference Brunet and KingBrunet & King, 2017; Reference Fairclough, Chen, Kramer, Zeng, Young, Robertson and KingFairclough et al., 2013; Reference KingKing, 2004; Reference King, Westbrook, Young, Kuo, Abedin, Chapman and RokhsarKing et al., 2008; Reference NielsenNielsen, 2008; Reference Richter and KingRichter & King, 2013) and the hydrodynamics of choanoflagellates without loads has already been measured and modelled (reviewed by Reference KoehlKoehl, 2021).

Figure 1. Swimmer morphology and flow. (a) A micrograph of the choanoflagellate Salpingoeca rosetta showing bacteria captured on its collar. (b) Computational swimmer with five attached bacteria on its collar. Streamlines in plane of flagellar beat. Colours depict velocity magnitude. (c) Swimmer with no attached bacteria. Streamlines in plane of flagellar beat. (d) The zoomed-in region about captured bacterium in (b). (e) Swimmer with five attached bacteria. Streamlines in plane normal to flagellar beat. ( f) Swimmer with no attached bacteria. Streamlines in plane normal to flagellar beat. The last column shows the flow differences around the choanoflagellates with and without bacteria captured outside their collar in (b)  $-$ (c) the flagellar plane and in (e) $-$ ( f) the normal plane.
In the last two decades, several hydrodynamic models have been used to investigate the swimming and feeding performance of choanoflagellates (e.g. Reference Kirkegaard and GoldsteinKirkegaard & Goldstein, 2016; Reference Nguyen, Koehl, Oakes, Bustamante and FauciNguyen et al., 2019; Reference Nielsen, Asadzadeh, Dolger, Walther, Kiorboe and AndersenNielsen et al., 2017; Reference Orme, Blake and OttoOrme, Blake, & Otto, 2003; Reference Pettitt, Orme, Blake and LeadbeaterPettitt, Orme, Blake, & Leadbeater, 2002; Reference Roper, Dayel, Pepper and KoehlRoper, Dayel, Pepper, & Koehl, 2013; Reference SmithSmith, 2009). These range from minimal models that represent flagellar dynamics by a single point force (Reference Roper, Dayel, Pepper and KoehlRoper et al., 2013) to detailed models of sessile choanoflagellates encased in a lorica (Reference Nielsen, Asadzadeh, Dolger, Walther, Kiorboe and AndersenNielsen et al., 2017). In Reference Nguyen, Koehl, Oakes, Bustamante and FauciNguyen et al. (2019), we presented a three-dimensional model of a free-swimming, single choanoflagellate in a viscous fluid that explicitly represented the organism's cell body, collar and flagellar kinematics. We demonstrated that morphological details are essential to include when predicting swimming and feeding performance. For example, we found that longer microvilli reduce speed and that cell shape only affects speed when the collar of microvilli is very short. We also found that models that ignore the collar overestimate flux and greatly overestimate the benefit of swimming to feeding performance. In this previous work, we used the flux of prey-carrying water through a capture zone around the collar as a proxy for the rate of bacterial prey capture. However, the diameter of a typical bacterial cell (1.4  $\mathrm {\mu }$m) is of the same order of magnitude as the cell body diameter of S. rosetta (4.4 $\mathrm {\mu }$m) and the length of the microvilli collar (5.8 $\mathrm {\mu }$m). Therefore, the prey itself can alter the hydrodynamics of both swimming and fluid flux through a capture zone. In the model presented below, we move from treating bacterial prey as fluid particles that do not affect hydrodynamics to treating them as neutrally buoyant cells with specified morphology and non-zero volume that have been seeded on the microvilli collar. A related study (Reference Sørensen, Asadzadeh and WaltherSørensen, Asadzadeh, & Walther, 2021) used simulations to investigate the hydrodynamic contribution to forces that keep non-zero-volume bacteria fixed to the collar of a sessile choanoflagellate Diaphanoeca grandis. The morphology of this choanoflagellate, unlike S. rosetta, includes a curved collar and a lorica. The results in Reference Sørensen, Asadzadeh and WaltherSørensen et al. (2021) indicate that there is a hydrodynamic effect that could aid in transporting prey to the cell. We note that in our simulations we assume that the bacteria are stuck to the microvilli collar, and that they remain rigidly attached as the organism swims. As demonstrated for computational swimmers without captured prey (Reference Nguyen, Koehl, Oakes, Bustamante and FauciNguyen et al., 2019), hydrodynamic performance is highly dependent upon flagellar waveform and microvillus lengths. When flagellar waveform and microvillus lengths vary from one individual to another, their performance will, likewise, vary. However, here we examine how one individual, endowed with a fixed flagellar waveform and collar morphology, will experience performance changes when it captures bacterial prey. As such, we isolate the effect of attached bacterial prey on hydrodynamics by fixing the cell morphology and kinematics. Moreover, while it is possible that the flagellar waveform of a biological swimmer changes when prey are captured, a computational framework allows us the luxury of a controlled environment where waveform and load are completely decoupled.
The goal of this study is to examine the effects of carrying captured prey on the swimming and feeding performance of low- $Re$ flagellated microorganisms. Using unicellular choanoflagellates with captured bacteria on their collars of microvilli as our research system, we addressed the following questions: (1) What are the effects of captured bacteria on the flow fields produced by choanoflagellates? (2) How do the number, size and location of prey on the collar affect choanoflagellate swimming performance? (3) How do the number, size and location of prey on the collar affect the flux of prey-carrying water into a choanoflagellate's capture zone? Are reductions in flux due only to occlusion of parts of the collar by captured prey, or does the deflection of water by the three-dimensional (3-D) structure of bacteria on the collar contribute to flux reduction? (4) What are the effects of captured bacteria on the work required for a choanoflagellate to swim and create a feeding current? (5) What are the effects of captured bacteria on choanoflagellate feeding efficiency? (6) What are the effects of captured bacteria on the flux of water into the capture zone of swimming choanoflagellates compared with the effects of captured prey on the flux of thecate choanoflagellates attached to a surface?
2. Methods
2.1 Experiments
Unicellular choanoflagellates, S. rosetta, were cultured using published protocols (Reference Dayel, Alegado, Fairclough, Levin, Nichols, McDonald and KingDayel et al., 2011; Reference King, Young, Abedin, Carr and LeadbeaterKing, Young, Abedin, Carr, & Leadbeater, 2009; Reference Levin and KingLevin & King, 2013). Videos (33 f.p.s.) were made with a CCD camera (PCO 1600) of choanoflagellates viewed at a magnification of  $\times$ 40 using a Nikon TE2000e inverted microscope with phase-contrast illumination. The choanoflagellates were swimming at room temperature (20 $^\circ$C) in a vessel (3.0 mm wide, 45 mm long, 100 $\mathrm {\mu }$m deep) in media containing bacteria, Algoriphagus machipongonensis (details described in Reference Levin and KingLevin and King (2013)). At the $\times$ 40 magnification used, the field of view of the videos was $180 \mathrm {\mu }{\rm m} \times 134\ \mathrm {\mu }{\rm m}$, so long trajectories of the choanoflagellates could be digitized, but the lengths of the collars and flagella of the choanoflagellates could not be resolved with precision. The working distance of the lens was long enough such that the focal plane used for the videos was mid-depth in the vessel to minimize wall effects on swimming speed. The instantaneous swimming speed of a choanoflagellate was measured at 0.03 s intervals using ImageJ software for segments of video when the choanoflagellate was in sharp focus, and the mean swimming speed was calculated for that individual. The distance travelled along the trajectory of each in-focus choanoflagellate was measured, as was the straight-line distance between its starting point and final location. The number of bacteria on the collar of each choanoflagellate during the video segment that we digitized were counted.
2.2 Computational model
The pattern of fluid flow around a choanoflagellate and the mechanisms by which it generates the forces to swim or to create currents past itself operate in a viscous-dominated regime and, therefore, can be described by the Stokes equations of incompressible flow:  $\mu \Delta \boldsymbol {u}(\boldsymbol {x}) - \boldsymbol {\nabla } p(\boldsymbol {x}) = -\boldsymbol {F}(\boldsymbol {x}), \boldsymbol {\nabla } \boldsymbol {\cdot } \boldsymbol {u}(\boldsymbol {x}) = 0$. Here, $\boldsymbol {u}$ is the fluid velocity, $p$ is the fluid pressure, $\mu$ is the dynamic viscosity and $\boldsymbol {F}$ is the force density applied at discrete points on the organism and the attached bacteria. We use the well-established method of regularized Stokeslets in three dimensions (Reference Cortez, Fauci and MedovikovCortez, Fauci, & Medovikov, 2005) by prescribing the velocities of all elements of the organism and solving a system of equations for the forces on the structure and for rigid-body velocities. In particular, zero velocity is prescribed on the surface of the cell body, the microvillus centrelines and the surfaces of the cylindrical bacteria that are attached to the microvilli. However, along the flagellum's centreline, velocities corresponding to a travelling wave given by $x(s,t) = s$, $y(s,t) = a(1 - {\rm e}^{-s/b})\sin (ks - 2{\rm \pi} \omega t)$, $z(s,t) = 0$ are prescribed. Here $0 \leq s \leq L$ and $L$ is the projected flagellar length (the maximum extent in the $x$ direction). In the case of a free-swimming cell, the total force and torque on the organism must be zero. These constraints give rise to a rigid-body translation and rotation of the swimmer. The linear relationship between velocity and force in the Stokes regime results in a linear system of equations for the forces distributed on the organism, as well as the resulting translation and rotation velocities. Once these are computed, the forces on the organism are used to construct the fluid motion in any region where the flow is desired. As in Reference Nguyen, Koehl, Oakes, Bustamante and FauciNguyen et al. (2019), we repeat this procedure at different phases of the flagellar beat in order to get a complete picture of the swimming motion and the fluid flow around the swimmer. The physical parameters that describe the morphology of the model choanoflagellate, the flagellar waveform and the bacterial morphology are given in table 1. The numerical parameters used such as discretization sizes of organism components and regularization parameters are given in table 2.
Table 1. Morphology and flagellar kinematics of S. rosetta and bacterium dimensions used to construct our models.
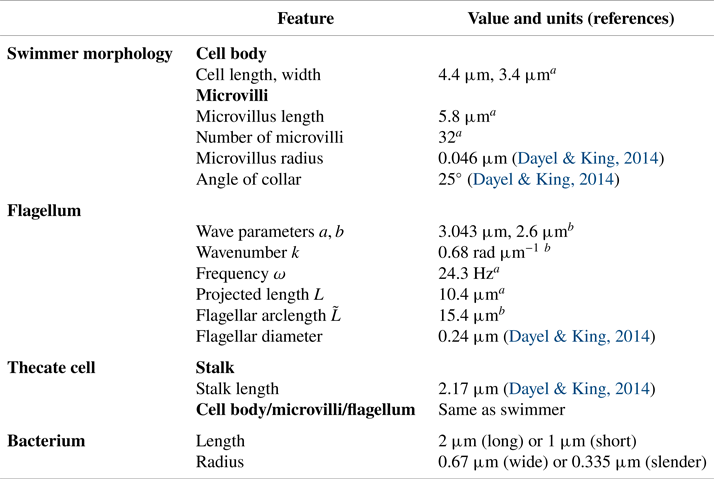
 $^{a}$Our data can be viewed online at: http://ib.berkeley.edu/labs/koehl/pdfs/Choano%20data.pdf. $^{b}$Model parameters to roughly match with flagellar data.
Table 2. Numerical parameters used in our simulations.

A measure of the feeding performance of the choanoflagellate is the flux of prey-carrying water into a capture zone surrounding its microvilli collar (see Reference Nguyen, Koehl, Oakes, Bustamante and FauciNguyen et al., 2019). We designate a capture zone around the collar at a distance of one bacterial radius away and compute the inward flux of fluid during one flagellar beat cycle (see figure 4):
 \begin{equation} Q = \rho \int_{0}^{T} \int _{\mathcal{S}, {\boldsymbol v} \boldsymbol{\cdot} {\boldsymbol n} > 0} {\boldsymbol v} \boldsymbol{\cdot} {\boldsymbol n} \, {\rm d}\sigma \, {\rm d} t, \end{equation}
where  $\rho$ is the density of water, $T$ is the duration of a flagellar beat, $\mathcal {S}$ is the surface of the capture zone, ${\boldsymbol v}$ is the fluid velocity on the capture zone relative to the cell and ${\boldsymbol n}$ is the unit inward normal to the capture zone. Note that the capture zone is not part of the organism's structure and causes no obstruction to the fluid flow.
2.3 Statistical analyses
In analyses of measurements from videos of laboratory experiments, the mean swimming speed of an individual choanoflagellate was used as an independent sample. In analyses of swimming speeds and feeding current fluxes calculated using the model, each run of the model with a specific number and arrangement of bacteria on a collar was used as an independent sample. Data used in parametric statistical tests met the assumption of normality (Shapiro–Wilk test) and homogeneity of variance (Levene's test). Shapiro–Wilk, Levene's, Kruskall–Wallis and Mann–Whitney  $U$ tests were done using Statistics Kingdom Online Calculators (Reference Statistics KingdomStatistics Kingdom, 2017), as were linear regressions for experimental data. Regressions for model data were done using Excel. Kendall tau rank correlation tests and one-way ANOVA with post hoc Tukey HSD analyses were done using the Astasa Online Statistical Calculator (Reference VasavadaVasavada, 2016). The data for all the statistical analyses are provided in the spreadsheet in the supplementary material available at https://doi.org/10.1017/flo.2023.16.
3. Results
3.1 Effects of captured bacteria on flow fields produced by choanoflagellates
Figure 1 shows examples of streamlines and water speeds relative to a model of a freely swimming S. rosetta, with five attached bacteria (figure 1b,e), and with no bacteria attached (figure 1c, f). Streamlines in the flagellar plane (figure 1b,c) and in the plane perpendicular to the flagellar plane through the swimmer's axis (figure 1e, f) are shown. The inset (figure 1d) shows that captured bacteria on the collar do affect the flow. The differences in flow velocities produced by the swimmer with bacteria from those produced by the swimmer without bacteria are depicted in figures 1(b,c) and 1(e, f). Here we see that the captured bacteria on the collar slow the flow in a region extending about 5  $\mathrm {\mu }$m from the bacteria. The effect is more pronounced for bacteria on the collar in the plane of flagellar beating (figure 1b,c) than for bacteria in the plane normal to the plane of flagellar beating (figure 1e, f). Similar observations may be made for a model thecate S. rosetta attached to a surface (more details can be found in figure S1 in the supplementary material).
3.2 Effects of captured bacteria on swimming speeds of choanoflagellates
Both laboratory measurements and model calculations of swimming speeds of S. rosetta show that bacteria on the collar slow the translation of the choanoflagellates through the water (figure 2). The collar and flagellar lengths of the choanoflagellates whose swimming speeds are plotted in figure 2( f) probably varied between individuals (but these lengths could not be measured with precision at the magnification used), and we could not control the size or location of bacteria on their collars. Even with this variability, swimming speed was lower for choanoflagellates carrying large numbers of prey on their collars than for those carrying few or no bacteria (figure 2f) (slope of linear regression:  $\beta = -0.71, R^2 = 0.51$). The units of $\beta$ in this section are $\mathrm {\mu }$m s $^{-1}$ per number of attached bacteria. In addition, two of the 23 choanoflagellates in our videos captured bacteria on their collars while they were swimming in the focal plane, and in both cases their speed decreased as the number of prey on their collars increased (figure 2(g); $\beta = -1.23, R^2 = 0.74$ for a choanoflagellate that caught six additional bacteria, and $\beta = -2.1, R^2 = 0.43$ for a choanoflagellate that caught four additional bacteria).

Figure 2. Captured bacteria reduce swimming speed. (a) A micrograph of a Salpingoeca rosetta carrying bacteria. (b) Model with long, wide bacteria ( $\text {length} = 2\ \mathrm {\mu }{\rm m}$, $\text {radius} = 0.67\ \mathrm {\mu }{\rm m}$). (c) Model with long, slender bacteria ( $\text {length} = 2\ \mathrm {\mu }{\rm m}$, $\text {radius} = 0.335\ \mathrm {\mu }{\rm m}$). (d) Model with short, slender bacteria ( $\text {length} = 1\ \mathrm {\mu }{\rm m}$, $\text {radius} = 0.335\ \mathrm {\mu }{\rm m}$). (e) Model without any bacteria. ( f) Mean translational velocity as a function of the number of attached bacteria. The open circles represent the mean data from the experiments. The number of individual choanoflagellates measured for each mean data point are: $n = 14$ choanoflagellates with 0 bacteria on their collars, $n = 4$ choanoflagellates with 1 bacterium on the collar, $n = 2$ choanoflagellates each for 2, 4, 5, 6, 7 and 8 bacteria on the collars and $n = 1$ choanoflagellate each for 3 and 9 bacteria on the collar. The filled markers represent the mean data for the simulations with attached bacteria (each point is the mean of five runs of the model with that number of bacteria placed in different randomly chosenlocations and orientations on the collar). The open triangle and dashed line represent the swimming speed of the model without any bacteria. Error bars show 1 SD. (g) Swimming speeds of choanoflagellates that captured additional bacteria during a video. One choanoflagellate (black triangles) with two bacteria on its collar captured an additional six bacteria during a video, and another choanoflagellate (red circles) with four bacteria on its collar captured an additional four bacteria during a video. (h) The zoomed-in portion of ( f) that contains only simulation results.
Using the model, we are able to hold the collar and flagellar lengths constant and can control the sizes and locations of bacteria on the collar. For instance, figure 2(b) shows two long, wide bacteria placed randomly on the collar, figure 2(c) shows long, slender bacteria also placed at the same locations and figure 2(d) with short, slender bacteria, also at the same locations. Figure 2(e) shows the control model swimmer with no attached bacteria.
For the cases of 2, 5, 7 and 18 bacteria of different sizes, simulations were run for five replicates, each with a different random placement of bacteria on the collar. The mean values of the computed translational velocities are also presented in figure 2( f). As in the laboratory experiments, the models show that the greater the number of prey on a choanoflagellate's collar, the more slowly it swims (long, wide bacteria:  $\beta = -0.18, R^2 = 0.94$; long, slender bacteria: $\beta = -0.12, R^2 = 0.97$; short, slender bacteria: $\beta = -0.11, R^2 = 0.97$). See figure S3 and table S1 in the supplementary material for more details about linear regression analysis for the dimensional and normalized translational velocities.
In each of our simulations, the choanoflagellate morphology and kinematics were held constant so we could focus on the effects of prey number, size and position on the collar. The collar and flagellar lengths, and the flagellum beat frequency and amplitude used in our calculations were mean values of laboratory measurements, whereas real choanoflagellates show a range of values: collar lengths can vary by 5  $\mathrm {\mu }$m between different individuals, flagellar lengths by 10 $\mathrm {\mu }$m and flagellar beat frequencies by about 11 Hz. In Reference Nguyen, Koehl, Oakes, Bustamante and FauciNguyen et al. (2019), we used Stokes equations of fluid dynamics to explore the effects of collar and flagellar lengths on swimming speeds. We found that a reduction in collar length of less than 30 % could double swimming speed, as could an increase in flagellar length of less than 30 %, and that swimming speed was linearly related to flagellar beat frequency. Therefore, it is not surprising that the standard deviations (SDs) around the mean swimming speeds measured for real choanoflagellates (figure 2f) are large. Our simulations of choanoflagellates with constant morphology and kinematics carrying a particular number of prey in different randomly chosen locations on the collar produced small SDs. There was some overlap between measured and calculated swimming speeds, although the mean measured values were higher by about 3 to 10 $\mathrm {\mu }$m s $^{-1}$ (figure 2f).
The swimming speeds we measured for choanoflagellates that were not carrying bacteria in this study were slightly higher than those reported in Reference Nguyen, Koehl, Oakes, Bustamante and FauciNguyen et al. (2019). In our earlier study, swimming speeds were measured on videos made at low magnification, so the choanoflagellates appeared as dots, and whether or not there were prey on their collars could not be determined. Therefore, the mean swimming speed of choanoflagellates in each video would have been lowered by those choanoflagellates in the population that were carrying bacteria and thus swimming more slowly.
The model enables us to explore the effects of the location of bacteria on the collar on the overall hydrodynamic performance of the swimmer. As an illustration, we perform four simulations where two long, wide bacteria are placed on the plane of the flagellum on the distal end of the collar (figure 3b), on the plane normal to the flagellum on the distal end of the collar (figure 3c), on the plane of the flagellum near the cell body (figure 3d) and on the plane normal to the flagellum near the cell body (figure 3e). We see that bacteria on the wide, distal area of the choanoflagellate's collar reduce swimming speed more than do bacteria on the narrow region of the collar close to the cell body. Prey on the collar in the plane of flagellar beating slow swimming more than do prey on the collar in the plane normal to flagellar beating. In addition to the four cases in figure 3 of two bacteria on the collar, figure S2 in the supplementary material examines ten more realizations of the model with two captured bacteria. After a bacterium is captured on the collar of the choanoflagellate S. rosetta, the prey is moved to the base of the collar (a process that takes 12.5 s), where the cell body engulfs the prey in a phagocytic vesicle (Reference Dayel and KingDayel & King, 2014). Thus, newly captured bacteria can have a greater effect on performance than those that have been transported towards the cell body.

Figure 3. Details of bacterial arrangement effect on translational velocity, inward flux, work and efficiency. (a) The choanoflagellate model with no attached bacteria shown with a capture zone (0.67  $\mathrm {\mu }$m away from the collar). Also shown are the inward flux on the proximal half of the capture zone (blue), as well as the inward flux on the distal half (grey). (b–e) Simulations with different arrangements of two bacteria on collar, viewed both in a plane parallel to the flagellar wave and in a plane perpendicular to the flagellar wave.
We also compared the effects of bacteria of different sizes at the same locations on the collar. We found that when choanoflagellates carry two, five or seven bacteria on the collar, those carrying long, wide bacteria swim significantly more slowly than those carrying long, slender or short, slender bacteria (for each number of bacteria, one-way ANOVA with post hoc Tukey HSD,  $df = 2,12, p < 0.01$), but there is no difference between carrying long versus short, slender bacteria ( $p > 0.05$). Similarly, when there are 18 bacteria on the collar, choanoflagellates carrying long, wide bacteria swim significantly more slowly than those carrying long, slender or short, slender bacteria (one-way ANOVA and post hoc Tukey HSD, $df = 2,12, p < 0.01$), but choanoflagellates carrying 18 long, slender bacteria swim significantly more slowly than those carrying 18 short, slender bacteria ( $p < 0.01$). Thus, the length of slender bacteria only affects choanoflagellate swimming speed when there are many bacteria on the collar, whereas the width of bacteria affects speed for low and high numbers of prey on the collar.
3.3 Effects of captured bacteria on turning by choanoflagellates
The distribution of bacteria in the water in the oceans is patchy on the scale of millimetres (e.g. Reference Mino, Koehl, King and StockerMino et al., 2017; Reference Stocker and SeymourStocker & Seymour, 2012). If microswimmers turn more when in a patch of water with high concentrations of bacteria, they are more likely to remain in that patch of dense prey. We asked whether bacteria accumulating on the collar of a choanoflagellate might physically cause it to turn more. We digitized the trajectories of swimming choanoflagellates in our videos, and for each we calculated the straightness index (SI, the ratio of the distance between the position of the choanoflagellate at the start and the end of the trajectory to the length of the path that the choanoflagellate followed along its trajectory) and counted the number of prey on the collar. There was no correlation between number of prey and SI (two-sided Kendal Tau rank correlation test,  $p = 0.85, n = 32$ choanoflagellates). The median SI for all the choanoflagellates was 0.68 (first quartiles 0.53 to 0.79). To explore whether lopsided bacterial distributions on collars might affect turning, we assessed the asymmetry of the bacterial load on collars by subtracting the number of prey on the half of the collar with the fewest prey from the number of prey on the other half of the collar with the most prey. There was no correlation between this measure of asymmetry and SI (two-sided Kendal Tau rank correlation test, $p = 0.77, n = 10$ choanoflagellates).
Our model results also show that bacterial load on the collar does not affect turning. Choanoflagellates wobble from side to side in the plane of flagellar beating as they swim forward. There is a significant, but small reduction in the amplitude (degrees) of the back-and-forth wobble as more bacteria are carried on a collar (e.g. linear regression for long, wide bacteria:  $\beta = -0.089, R^2 = 0.92$; range of wobble amplitude: $8.6^\circ$ to $10.4^\circ$). The units of $\beta$ in this section are rad s $^{-1}$ per number of attached bacteria. If we calculate the mean angular velocity for a full flagellar beat cycle, the instantaneous angular velocities due to wobbling back and forth are removed. Then we can measure the net angular velocity of the choanoflagellate to determine if it is turning as it swims along its trajectory. Because a choanoflagellate can turn clockwise (positive) or counterclockwise (negative), we used the absolute value of the net angular velocity as a measure of turning. There was no significant effect of number of bacteria on the absolute value of the net angular velocity of the choanoflagellates ( $\beta = -0.003, R^2 = 0.08$). Mean angular velocity was 0.23 rad s $^{-1}$ ( ${\rm SD} = 0.06, n = 21$).
3.4 Effects of captured bacteria on flux of water into capture zones of choanoflagellates
One measure of feeding performance is the flux of prey-carrying water into a capture zone (volume of water per area of capture zone per flagellar beat cycle). To be caught by a choanoflagellate, a bacterium must contact the collar. Therefore, we choose the capture zone to be the surface around the collar that is one bacterium radius outside the collar (figure 4a–c). Note that in the absence of caught bacteria, this capture zone would be a portion of a conical surface. However, when bacteria are attached to the collar, regions of the surface blocked by the bacteria are removed from the flux calculation. We used our model to calculate the flux for five random placements each of 2, 5, 7 and 18 bacteria on the collar of a model swimmer and found that the greater the number of bacteria on a collar, the lower the flux into the capture zone. Large bacteria have a greater effect than small ones (linear regressions: long, wide bacteria,  $\beta = -0.81, R^2 = 0.98$; long, slender bacteria, $\beta = -0.49, R^2 = 0.99$; short, slender bacteria, $\beta = -0.37, R^2 = 0.98$). The units of $\beta$ in this section are $\mathrm {\mu }{\rm m}^3$ per number of attached bacteria. Figure 4(d) shows the flux values normalized by the flux to a swimmer with no bacteria on its collar. This normalized flux decreases with increasing numbers of bacteria (figure 4d, solid lines). See figure S4 and table S2 in the supplementary material for more details about linear regression analysis for the dimensional and normalized inward flux.

Figure 4. Captured bacteria reduce inward flux and increase work. (a) Capture zone used to calculate inward flux of a swimmer. The flow is affected by 3-D attached bacteria. (b) Capture zone used to calculate inward flux of ‘void’ model to compare with that computed in (a). The flow is not affected by attached bacteria. (c) Capture zone used to calculate inward flux to a thecate cell. The flow is affected by 3-D attached bacteria. (d) Inward flux into the capture zone per flagellar cycle as a function of the number of attached bacteria, normalized by the inward flux for a swimmer with no bacteria attached. Solid curves show inward flux computed using the full model, where attached bacteria affect the flow. Dashed curves show inward flux computed using the ‘void’ model, where the attached bacteria do not affect the flow, but the region that they occupy on the capture zone is omitted from the flux calculations. The capture zone is 0.67  $\mathrm {\mu }$m away from the collar for the simulations with long, wide bacteria and is 0.335 $\mathrm {\mu }$m for those with long, slender or short, slender bacteria. (e) The work done by the flagellum of the swimmer as a function of the number of attached bacteria normalized by the work done by the flagellum of a swimmer with no bacteria attached.
Large bacteria can reduce flux more than small ones. When there are 2, 5, 7 or 18 bacteria on collars, the flux for long, wide bacteria is significantly lower than for short, slender bacteria (Kruskal–Wallis test using right-tailed Chi-Square distribution, followed by post hoc Dunn's test,  $p < 0.01$). However, the flux for long, slender bacteria did not differ from that for long, wide bacteria or for short, slender bacteria ( $p > 0.05$).
Next, we turned to the question of whether the reduction in flux by bacteria on the collar is caused simply by occluding patches on the capture zone, or if the caught bacteria also reduce the flux by changing the pattern of water flow near the collar. We assessed whether the redirection of water flow by the 3-D presence of bacteria (e.g. figure 1d) contributes to flux reduction. For a fixed distribution of bacteria, we calculated the flux using the flow created by a swimmer with no bacteria on its collar on a capture zone where ‘voids’ of the same length and width as the bacteria were removed (shown by blue hatch marks in figure 4b); any fluid flow into these void areas was not added to the total inward flux over the cycle. The greater the number of voids, the lower the flux of water into the capture zone (linear regressions: long, wide voids,  $\beta =-0.48, R^2 = 0.99$; long, slender voids, $\beta = -0.24, R^2 = 0.99$; short, slender voids, $\beta = -0.13, R^2 = 0.99$). For each of the sizes of bacteria we modelled, the flux of water into the capture zone for 3-D bacteria is significantly lower than the flux for voids at the same locations on a collar (for each number of bacteria, one-way ANOVA, $df = 1,8, p < 0.01$). The decrease in normalized flux with increasing numbers of 3-D bacteria (figure 4d, solid lines) is more pronounced than for voids (figure 4d, dashed lines). Thus, the reduction of water flux into the capture zones of choanoflagellates carrying bacteria on their collars is due both to redirection of the water flow by 3-D bacteria and to bacterial blockage of areas of the collar.
3.5 Effects of captured bacteria on the work to create a feeding current
During each phase of the flagellar cycle, we construct both the force and velocity distributions along the flagellum. These are used to calculate the mechanical work done per flagellar cycle for choanoflagellates carrying different numbers of bacteria on their collars. Figure 4(e) shows the work required as a function of the number of attached bacteria normalized by the work required for a swimmer with no bacteria attached to its collar. We find that work increases slightly with numbers of bacteria on the collar (linear regression: long, wide bacteria,  $\beta = 0.0003, R^2 = 0.87$; long, slender bacteria, $\beta = 0.0004, R^2 = 0.88$; short, slender bacteria, $\beta = 0.0006, R^2 = 0.90$). The units of $\beta$ in this section are pJ per number of attached bacteria. We see that even for 18 long, wide bacteria, the work is only increased by less than 6 %. The work done by choanoflagellates carrying 2 or 5 bacteria is not affected by bacterial size, whereas the work to carry 7 bacteria is greater for long, wide prey than for short, slender prey, and the work to carry 18 bacteria is greater for long, wide bacteria than for long, slender bacteria, which is greater than for short, slender prey (one-way ANOVA with post hoc Tukey HSD for each number of prey, $df = 2,12, p < 0.05$ for significance). The increase in normalized work with higher numbers of prey on the collar is more pronounced for large bacteria than for smaller prey. See figure S5 and table S3 in the supplementary material for more details about linear regression analysis for the dimensional and normalized work.
3.6 Effects of captured bacteria on feeding efficiency
Feeding efficiency is the energy that a predator gets from captured prey relative to the energy expended to catch the prey. If we assume that prey capture rate (and thus rate of energy intake) is proportional to the flux of water into the capture zone, then the flux per flagellar cycle divided by the work per cycle is a rough proxy for feeding efficiency. Since the increase in work per flagellar cycle when choanoflagellates are carrying prey is very small, feeding efficiency is controlled by the flux of water into the capture zone. Therefore, the effects on feeding efficiency of prey numbers and prey size are the same as those reported for flux (figure 4d). In the illustrative example with different placements of two bacteria shown in figure 3, we report the corresponding inward flux, work and efficiency. We see that feeding efficiency is decreased more by prey in the plane of the flagellum near the tips of the microvilli than by prey in other locations. This prompted us to ask if there was greater flux through the distal region of the capture zone only because of its larger surface area, or if this was also due to more pronounced flow from the larger amplitude of flagellar wave in the distal region. Figure 3(a) shows the inward flux values separated into the flux across the proximal region (blue) and the distal region (grey) for the swimmer with no bacteria. Whereas the surface area of the distal region of the capture zone accounts for 74 % of the inward flux, it only accounts for 61 % of the surface area. Hence, the larger-amplitude flagellar wave at the distal end has an effect on the inward flux. See figure S6 and table S4 in the supplementary material for more details about linear regression analysis for the dimensional and normalized feeding efficiency.
3.7 Effects of captured bacteria on performance of thecate choanoflagellates attached to surfaces compared with swimming choanoflagellates
We used our model to compare the consequences of captured bacteria for the performance of swimming choanoflagellates with that of thecate choanoflagellates of the same dimensions attached to a surface. When choanoflagellates have five bacteria on their collars, the flux of water per flagellar cycle into the capture zone was significantly higher for swimmers ( ${\rm mean} = 17.5\ \mathrm {\mu }{\rm m}^3$, ${\rm SD} = 0.9, n = 5$) than for thecate choanoflagellates ( ${\rm mean} = 14.9 \mathrm {\mu }{\rm m}^3, {\rm SD} = 0.8, n = 5$) (one-way ANOVA, $df = 1,8, p < 0.01$), but there was no significant difference in their work per flagellar cycle ( $\text {mean for swimmers} = 0.19\ {\rm pJ}, {\rm SD} = 0.001, n = 5$; $\text {mean for thecate} = 0.20\ {\rm pJ}, {\rm SD} = 0.001, n = 5$) (one-way ANOVA, $df = 2,8, p= 0.17$). Furthermore, there was no significant difference between swimmers and thecate choanoflagellates in the reduction of flux due to carrying bacteria (normalized flux: Mann–Whitney $U$ test, $p = 0.21$) or in the increase in work (normalized work, $p = 0.34$).
4. Conclusions and discussion
Using both microvideography and a computational model of the hydrodynamics of a choanoflagellate, we found that bacteria captured on the collar slow swimming speed. Although differences in flagellum or collar length between individual choanoflagellates can have large effects on their swimming speeds relative to each other (Reference Nguyen, Koehl, Oakes, Bustamante and FauciNguyen et al., 2019), here we show that an individual of a given morphology is slowed as it accumulates bacteria on its collar.
For both thecate choanoflagellates attached to a substratum and freely swimming choanoflagellates, our model showed that captured bacteria reduce the flux of water into the capture zone. This reduction is due both to the redirection of the water flow by the 3-D structure of the captured bacteria and to blockage of parts of the surface area of the collar by the bacteria. We found that the work required to create a feeding current increases slightly with the number of prey on the collar. Feeding efficiency (prey captured per work to produce the feeding current) is decreased more by large than by small prey, and by prey in the plane of flagellar beating and near the tips of the microvilli than by prey in other locations.
As has been shown for birds, bats and insects flying in air at high  $Re$, and for copepods swimming in water at intermediate $Re$, the swimming performance of microscopic choanoflagellates operating at low $Re$ is also hampered by carrying loads and the cost of transport is increased. In addition, feeding performance is diminished for choanoflagellates already carrying prey, which may affect the rates at which they remove bacteria from patches of water in which bacteria are in high density versus from water where bacteria are sparse. In this work we have prescribed the flagellar kinematics of the model choanoflagellate to be the same across all of the simulations, regardless of the load of bacterial prey on the collar. While it is known that birds (Reference Hambly, Harper and SpeakmanHambly, Harper, & Speakman, 2004; Reference Nudds and BryantNudds & Bryant, 2002) and insects (Reference Altshuler, Dickson, Vance, Roberts and DickinsonAltshuler et al., 2005; Reference Mountcastle and CombesMountcastle & Combes, 2013; Reference Muijres, Chang, van Veen, Spitzen, Biemans, Koehl and DudleyMuijres et al., 2017) can change their wingbeat frequency and/or amplitude, and can alter wing shape, angle of attack and stroke kinematics when carrying loads, the dependence of flagellar kinematics on the load of bacterial prey carried by a choanoflagellate has not yet been measured in the laboratory. In the current model, we held flagellar kinematics and frequency constant, but our model may be used to probe the effects of flagellar kinematics on swimming and feeding performance for given distributions of prey. Recognizing that the flagellum and, to some degree, the microvilli are not rigid structures, more refined models (e.g. Reference Simons, Olson, Cortez and FauciSimons, Olson, Cortez, & Fauci, 2014), where the waveform of the elastic, actuated flagellum emerges from the full coupled system, should also be pursued.
Many species of choanoflagellates can form multicellular colonies of various configurations. Choanoflagellates and animals share a common ancestor, and therefore choanoflagellates have been used as a system to study the evolution of multicellularity in the ancestors of animals (reviewed by Reference Brunet and KingBrunet & King, 2017). The hydrodynamic effects of forming colonies and the performance consequences for swimming, feeding and predator avoidance have been studied to shed light on possible selective advantages of forming colonies (reviewed by Reference KoehlKoehl, 2021). Although Reference Roper, Dayel, Pepper and KoehlRoper et al. (2013) and Reference Kirkegaard and GoldsteinKirkegaard and Goldstein (2016) modelled the hydrodynamics of chain-like and rosette colonies of choanoflagellates, they did not incorporate the uneven arrangement of cells in real choanoflagellate colonies, nor did they consider the hydrodynamic consequences of prey on the collars of cells in colonies. Although Reference Kirkegaard, Marron and GoldsteinKirkegaard, Marron, and Goldstein (2016) described noisy helical trajectories for rosette colonies of S. rosetta, the trajectories we measured for S. rosetta colonies feeding on bacteria were not helical (Reference KoehlKoehl, 2021). Feeding experiments showed that the number of prey on the collars of S. rosetta varies between cells within a rosette colony (Reference KreftKreft, 2010), and this uneven distribution of prey might contribute to the messiness of colony trajectories. Future studies should explore how colony formation affects the consequences of load carrying by choanoflagellates.
Supplementary material
Supplementary material is available at https://doi.org/10.1017/flo.2023.16. Available experimental data can be requested from M.A.R.K. while simulation data can be requested from H.N.
Acknowledgements
We thank R. Stocker for the use of his microscope and camera, N. King for useful discussions and providing choanoflagellate cultures and E. Robinson and E. Winoto for help with video analysis. The research meets all ethical guidelines, including adherence to the legal requirements in the USA.
Funding statement
This research was supported by NSF-DMS/NIH-NIGMS Initiative to Support Research at the Interface of the Biological and Mathematical Sciences Collaborative grants 2054333 (to H.N.), 2054143 (to M.A.R.K.) and 2054259 (to L.F. and R.C.), and NSF grant IOS-1655318 (to M.A.R.K. and N. King). We thank Trinity University for the provision of computational resources and NSF MRI-ACI-1531594 for providing Trinity the High Performance Scientific Computing Cluster.
Declaration of interests
The authors declare no conflict of interest.
Author contributions
M.A.R.K., L.F., R.C., H.N., E.R. contributed to model conceptualization, analysis of results and writing of the manuscript. M.A.R.K. provided empirical data, conceived biological questions to address and performed data analysis. H.N., L.F. and R.C. developed the computational methodology and validated results. H.N. mentored one undergraduate student (E.R.) on model development and implementation to generate simulation results and data analysis. E.R. did linear regressions of the simulation data, created movies with fluid particle motion and helped in making figures.


 Open access