


1. Introduction
Auctions are a common mechanism used to trade heterogeneous goods such as fine art, antiques, wines, and the focus of this article, Thoroughbred horses. Historically, yearlings have been the most common age group among Thoroughbreds to be traded in auction; however, Thoroughbreds of other ages are also sold in auction. One example is the Keeneland November Breeding Stock Sale, which occurs every fall in Lexington, Kentucky. During this sale, Thoroughbreds of all ages are sold, but the primary focus of the sale is on weanlings, broodmares, and broodmare prospects.Footnote 1 The market for Thoroughbred broodmares and broodmare prospects has already been studied (Maynard and Stoeppel, Reference Maynard and Stoeppel2007; Neibergs, Reference Neibergs2001), but the market for weanlings has not yet been explored. The objective of this article is to fill this gap; more specifically, the determinants of Thoroughbred weanling auction prices are investigated.
Weanling Thoroughbreds represent an interesting segment of the market. Because weanlings at the auction are generally between 5 and 11 months old, they are immature in their growth process. This means that their conformation upon maturity is even more difficult to assess than their yearling or 2-year-old counterparts. Consequently, predicting future racing or breeding quality is more difficult, and accordingly, it becomes more difficult to assess the value of that individual. In spite of this, the weanling auction market is very active; between 2006 and 2013, about 7.5% of the Northern American Thoroughbred foal crop was sold as weanlings, which represents about 2,000 weanlings sold every year.
The weanling market may attract a different type of horse and buyer than the more common yearling market. Weanlings are typically at least 16 months from starting their first race, which, for a buyer, is a significant time span before realizing a potential return on investment. Additionally, there is greater risk for these buyers as there is a longer time span in which the horse could injure itself and never make it to the track. On the other hand, selling a horse as a weanling allows the seller to reduce risk for the same reason risk increases for buyers. Horses are often sold as weanlings for different reasons than yearlings, from a farm needing to liquidate some of its assets before winter to those whose sire (the father of a horse) or dam (the mother of a horse) has become “hot,” or more commercially desirable, because of outstanding progeny racetrack performance earlier in the year. Additionally, the weanling market is popular for one type of market participant, the pinhooker. A pinhooker is someone who buys horses for resale. This includes the purchase of weanlings that are resold as yearlings, weanlings that are resold as 2-year-olds, and yearlings that are resold as 2-year-olds.
The results of this analysis suggest that, similar to Thoroughbreds of other ages sold at auction, pedigree quality is a key factor in determining prices. On the sire's side, the market value of the sire, as measured by his stud fee, is a main determinant of weanling prices. On the dam's side, the dam's racing quality and the ability of the dam to produce successful racehorses are key factors in determining prices. However, individual qualities such as age and gender are also factors, along with the placement of the weanling in the sale.
This article proceeds as follows. Section 2 provides more information on the background of Thoroughbred auctions and discusses related literature. Section 3 presents the empirical model, and Section 4 describes the data used in the analysis. Section 5 presents the results and discussion, and Section 6 concludes and offers agribusiness implications.
2. Background
Thoroughbreds are sold in auctions at a number of different ages. As seen in Table 1, most Thoroughbreds are sold as yearlings; however, they are also sold as weanlings and as 2-year-olds in training.
Table 1. Percent of 2006–2013 North American Registered Foal Crop Sold as Weanlings, Yearlings, and 2-Year-Olds2
At the 2-year-old in-training sales, prospective buyers can watch a horse “breeze” a short distance on the racetrack, observing its speed and running form. Both weanlings and yearlings, however, are too young to have begun race training. At these sales, prospective buyers are limited to evaluating an individual's conformation, or physical build, and the quality of its walk; industry experts suggest that the quality of a horse's walk is indicative of the quality of its gallop. It is on this basis, along with information available in the sales catalog and veterinary records, that buyers make their bidding decisions. However, because of their immaturity, weanlings are the most difficult age group to predict future racing ability. Not only is it difficult to assess their conformation at racing age, but in addition, they are young enough that any conformation problems that exist may be improved or entirely grown out of as the horse ages (McIlwraith, Anderson, and Sanschi, Reference McIlwraith, Anderson and Sanschi2003).
The determinants of weanling Thoroughbred sales prices have not been studied before, which makes this article of particular interest in understanding not only this segment of the market, but also how the entire market has developed to diversify risky investments. Other segments of Thoroughbred auction markets are better understood; several studies have investigated the determinants of yearling prices (for an overview, see Plant and Stowe, Reference Plant and Stowe2013) and broodmare prices (Maynard and Stoeppel, Reference Maynard and Stoeppel2007; Neibergs, Reference Neibergs2001), and recent research has investigated the determinants of prices for Thoroughbreds sold at the 2-year-old in-training auctions (Robert and Stowe, Reference Robert and Stowe2016). Although not traded in auction markets, the determinants of advertised stud fees of Thoroughbred stallions have also been examined (Stowe, Reference Stowe2013; Stowe and Ajello, Reference Stowe and Ajello2010). Hedonic price analysis is the analytical tool of choice in these studies to estimate the value of certain attributes of horses.
Because they are closest in age, we anticipate that price determinants for weanling Thoroughbreds will be most similar to those of yearlings. Research in that area shows that yearling prices are influenced by pedigree quality and individual-specific characteristics of the horse such as age and gender (Buzby and Jessup, Reference Buzby and Jessup1994; Chezum and Wimmer, Reference Chezum and Wimmer1997; Neibergs and Thalheimer, Reference Neibergs and Thalheimer1997; Parsons and Smith, Reference Parsons and Smith2008; Plant and Stowe, Reference Plant and Stowe2013; Poerwanto and Stowe, Reference Poerwanto and Stowe2010; Robbins and Kennedy, Reference Robbins and Kennedy2001; Vickner and Koch, Reference Vickner and Koch2001). Pedigree quality is measured in a number of ways. For example, previous studies have shown that the quality of a horse's sire is best represented by his most current advertised stud fee, which is the price a mare owner pays for one breeding to a stallion. Stud fees appear to collect available information regarding a stallion's ability to produce successful racehorses and commercially attractive progeny. The quality of a horse's dam is measured by her own racing performance as well as her ability to produce successful racehorses.
3. Empirical Model
Hedonic pricing models have been the primary tool of analysis in investigating price determinants in the Thoroughbred industry. In a hedonic pricing model, the price of a product is a function of the quantity and quality of its attributes or characteristics. The coefficient estimates for these attributes can be used to predict the marginal value of the characteristics of a product.
In this study, the product is a weanling Thoroughbred. The hammer price of a weanling serves as the dependent variable.Footnote 3 Demand is assumed to depend on attributes of that weanling, including individual characteristics (such as age, gender, whether the weanling was foaled in Kentucky, and whether the weanling is Breeders’ Cup eligible), pedigree variables (such as the sire's stud fee, whether a weanling's sire is relatively early in his breeding career, and whether the dam and her progeny have earned “black type”Footnote 4 ), and a sale variable (the placement of the weanling in the sale).
Two models are estimated to analyze price determinants for weanling Thoroughbred prices, and they differ in the way they account for sire pedigree. The first model is a log-linear ordinary least squares (OLS) model, with the general model to be estimated being represented by
 $$\begin{equation*}
{\rm{ln}}\left( {{y_i}} \right) = \alpha + {x_i}\beta + {\varepsilon _i}
\end{equation*}$$
$$\begin{equation*}
{\rm{ln}}\left( {{y_i}} \right) = \alpha + {x_i}\beta + {\varepsilon _i}
\end{equation*}$$
where ln(yi ) is the hammer price of weanling i during the 2010 November Breeding Stock Sale, xi is an n × k matrix of explanatory variables (n is the total number of observations, and k is the number of regressors), and εi is the error term. All monetary variables included in this analysis (hammer price and sire's stud fee) are modified using the natural log transformation to normalize their distributions. Histograms of hammer price and the natural log transformation of price are presented in Figure 1. In this model, the effect of sire pedigree is controlled for by the sire's stud fee and whether he is in the first 3 years of his breeding career.
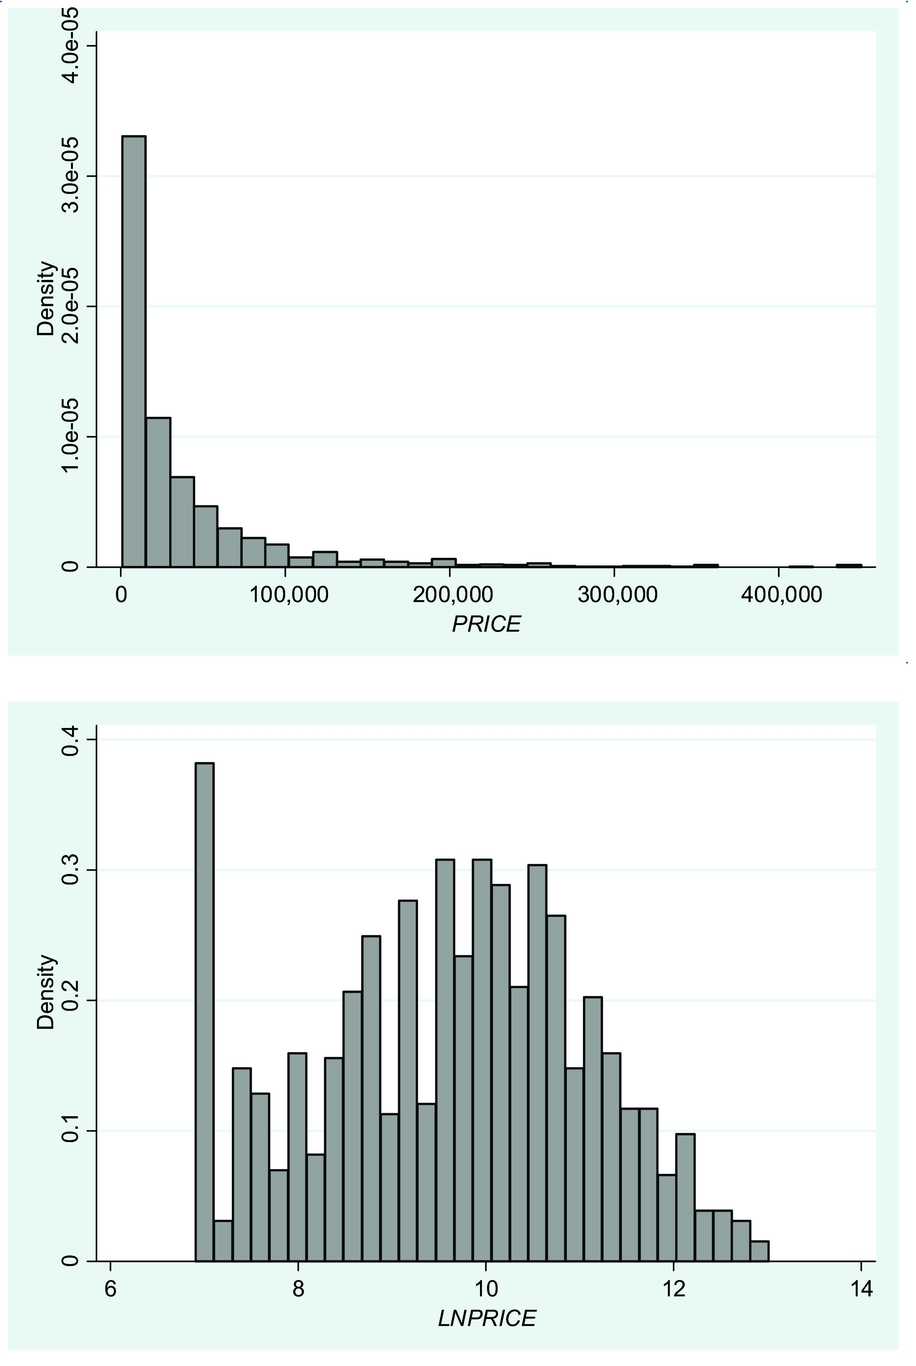
Figure 1. Histograms of PRICE and LNPRICE
An alternative to accounting for sire pedigree is to control for each individual sire in the data set with a dummy variable. Thoroughbred sires can be thought of as “brand names,” and what is included in that brand may encompass more than just his stud fee and the number of foal crops he has produced. In general, this could be modeled as follows:
 $$\begin{equation*}
\ln \left( {{y_i}} \right) = \alpha \; + \;{{\bm x}_i}\beta \; + \;{\gamma _1}{d_1}\; + \;{\gamma _2}{d_2}\; + \;{\rm{ }} \ldots \;{\gamma _j}{\;_{\; -\;\, {\rm{ }}1}}{d_{j\;}}_{ - \;1}\; + \;{\varepsilon _i},
\end{equation*}$$
$$\begin{equation*}
\ln \left( {{y_i}} \right) = \alpha \; + \;{{\bm x}_i}\beta \; + \;{\gamma _1}{d_1}\; + \;{\gamma _2}{d_2}\; + \;{\rm{ }} \ldots \;{\gamma _j}{\;_{\; -\;\, {\rm{ }}1}}{d_{j\;}}_{ - \;1}\; + \;{\varepsilon _i},
\end{equation*}$$
where dj represents a dummy variable for each of the j – 1 sires in the data set.
There are 212 individual sires represented in this data set,Footnote 5 creating a large number of dummy variables and drastically reducing the degrees of freedom. The areg procedure in Stata handles this approach by “absorbing” the dummy variables (specific coefficient estimates for each of the dummy variables are not available), but the coefficients on the remainder of the explanatory variables are estimated. The estimation tests for the joint significance of the dummy variables.
Had we excluded the sire-specific variables in model 1 and rather included 211 dummy variables to control for sire, the coefficient estimates for the remaining variables would be the same, as would the R 2 values and root-mean-square error. However, the model F tests would not be the same.
The first model is tested for multicollinearity by using the variance inflation factor (VIF) test. The highest VIF is 3.46, indicating no concern of multicollinearity. The Breusch-Pagan/Cook-Weisberg is used to test for heteroskedasticity; the results of the test cannot reject the null hypothesis of constant variance. Finally, the Ramsey RESET (regression equation specification error test) test is utilized to test for omitted variables. We cannot reject the null hypothesis that the model has no omitted variables.
After the models are estimated, marginal values are computed to illustrate the effect of a 1-unit increase in the independent variable on weanling hammer price. Marginal values are calculated at the sample mean for continuous variables and at zero for all dummy variables except the variable under consideration.
4. Data
The Keeneland sales website (accessible at https://www.keeneland.com/sales) and the 2011 American Produce Records (Equibase Company LLC, 2011), which contains pedigree and racing records of dams and foals between 1960 and 2010, are used to compile the data set used in this study. Information provided in these resources includes the weanling's pedigree, color, gender, age, state of birth, Breeders’ Cup eligibility, seller, buyer, and other auction details. In addition, advertised sale-year stud fees for a weanling's sire are obtained from the December 2009 Blood-Horse MarketWatch.
Data were collected from the Keeneland 2010 November Breeding Stock Sale in Lexington, Kentucky. Of the 4,772 total horses cataloged at this sale, 1,786 were weanlings. Four hundred forty-three of the weanlings were removed from consideration prior to the sale by the seller, leaving 1,343 weanlings that were presented for sale. Among these, 29 weanlings did not receive a bid, and there was missing information for an additional 12 weanlings; these 41 weanlings were excluded from this analysis. Accordingly, the final sample size for this study is 1,302 weanling Thoroughbreds.
Variables used in the models are described subsequently. Table 2 enumerates the variables and provides their definitions and expected influence on weanling hammer price. Table 3 reports the summary statistics for these variables.
Table 2. Definitions of Variables and Expected Signs
Note: n/a, not applicable.
Table 3. Summary Statistics
The dependent variable used in this study is the natural log of the hammer price (LNPRICE). The minimum and maximum hammer prices in the sample are $1,000 and $450,000, respectively, with a mean hammer price of $37,467.
Independent variables include the weanling's individual characteristics such as gender, age, Breeders’ Cup eligibility, and whether it was foaled in the state of Kentucky. Gender is represented by the variable COLT, which is set equal to 1 if the weanling is an uncastrated male and 0 if the weanling is a filly (there were no geldings, or castrated males, in this sample). In studies where gender is significant, colts sell for higher average prices than fillies. Just over half of the sample (50.8%) consists of colts. Age is represented by the variable DPF, which stands for “days past foaling” as calculated on the first day of the sale. It is expected that older weanlings will sell for higher average prices because they will be more mature when they begin race training. The average age of weanlings in the sample is about 233 days, or nearly 8 months old. The youngest weanling in the sale is about 5.5 months, whereas the oldest is over 10 months. If a weanling has been nominated to compete in the Breeders’ Cup championships when it is older, the variable BC equals 1 and is 0 otherwise. The nominator pays a fee of $400 to $1,500 to nominate a foal, and all nominated foals are eligible to compete in all Breeders’ Cup World Championships.Footnote 6 About 75% of the weanlings in the sample are Breeders’ Cup eligible. State of birth is represented by the variable KY, an indicator variable equal to 1 if the weanling was foaled in the state of Kentucky and 0 otherwise. Evidence from previous research in yearling and 2-year-old pricing studies are mixed as to the sign and significance of this variable, although in most studies it is positive when significant. Almost 85% of the sample was foaled in Kentucky.
Other independent variables relate to pedigree quality of the weanling's sire and dam. Sire quality is measured by the sire's advertised sale-year stud fee (STUDFEE); the natural log transformation of this variable is used in the model (LNSTUDFEE). The minimum and maximum stud fees in the sample are $2,500 and $150,000, with an average of $23,377. Nearly all previous pricing studies in which stud fee is included find a positive and highly significant relationship between stud fee and sale prices (see, e.g., Buzby and Jessup, Reference Buzby and Jessup1994; Chezum and Wimmer, Reference Chezum and Wimmer1997; Parsons and Smith, Reference Parsons and Smith2008; Plant and Stowe, Reference Plant and Stowe2013; Robbins and Kennedy, Reference Robbins and Kennedy2001; Robert and Stowe, Reference Robert and Stowe2016; Vickner and Koch, Reference Vickner and Koch2001). In addition, we control for whether the weanling is part of its sire's first crop (FIRSTCROP), second crop (SECONDCROP), or third crop (THIRDCROP) of foals. Each of these indicator variables equals 1 if the weanling is from that foal crop and 0 otherwise. There is some evidence in both yearling and 2-year-old pricing studies that buyers are willing to pay a premium for progeny by first crop sires. Moreover, according to market participants, foals in a sire's second and third crops are less desirable as the market waits to see how a sire's first crop of foals perform on the racetrack. In this sample, 18.3% of the weanlings are by first crop sires, 13.4% by second crop sires, and 12.1% by third crop sires. The quality of the weanling's dam is measured by whether she earned black type during her racing career (DAMBT) and whether she has produced any progeny earning black type (DAMPBT). Twenty-seven percent of the weanlings’ dams in the sample have earned black type, and 27% have produced at least one foal that earned black type. These two subsets have some individuals in common; 8.0% of the dams in the sample have earned black type and produced at least one black-type foal.
We also include a variable indicating whether the hammer price met the seller's reserve price. When a horse does not meet its reserve price, “reserve not attained” is indicated in the sales results. The variable RNA equals 1 if a weanling's hammer price does not meet the reserve price and 0 otherwise. About 24% of the weanlings in the sale did not meet their reserve price. As in Plant and Stowe (Reference Plant and Stowe2013) and Neibergs (Reference Neibergs2001), we expect the coefficient on this variable to be negative, indicating that buyers undervalue the horse relative to the seller (or that the seller overvalues the horse relative to the market).
Finally, a set of indicator variables is included to control for the weanling's placement in the sale. Placement is categorized by the “book” in which the weanling appears. In this sale, there is a book for each day of the sale, which lasted 14 days. Therefore, indicator variables are included for BOOK2–BOOK14, with BOOK1 being omitted to avoid multicollinearity. Placement in the books is determined by the expected quality of the weanling as determined by the auction house; placement within a book is determined by the first letter of the dam's registered name. Consequently, we expect the coefficients on these sale placement variables to be negative and increasing in absolute value. The placement within a book should have no influence on price because it is determined by the name of the dam. Variables included in the final model are chosen based on statistical significance, overall fit of the model, tests for multicollinearity, and other model specification tests.
The first model to be estimated is the standard OLS model, with sire pedigree controlled for by LNSTUDFEE, FIRSTCROP, SECONDCROP, and THIRDCROP. The specific form of the model being estimated is as follows:
Model 1
LNPRICEi = α + β1COLTi + β2DPFi + β3BCi + β4KYi + β5LNSTUDFEEi + β6FIRSTCROPi + β7SECONDCROPi + β8THIRDCROPi + β9DAMBTi + β10DAMPBTi + β11RNAi + β12BOOK2i + β13BOOK3i + β14BOOK4i + β15BOOK5i + β16BOOK6i + β17BOOK7i + β18BOOK8i + β19BOOK9i + β20BOOK10i + β21BOOK11i + β22BOOK12i + β23BOOK13i + β24BOOK14i + εit
The second model to be estimated “absorbs” the effects of individual sires using Stata's areg procedure. With this approach, the sire-specific variables (LNSTUDFEE, FIRSTCROP, SECONDCROP, and THIRDCROP) disappear because they do not vary by sire, similar to a fixed-effects regression model. Thus, the specific form of the second model being estimated is as follows:
Model 2
LNPRICEi = α + β1COLTi + β2DPFi + β3BCi + β4KYi + β5DAMBTi + β6DAMPBTi + Β7RNAi + Β8BOOK2i + β9BOOK3i + β10BOOK4i + β11BOOK5i + β12BOOK6i + β13BOOK7i + β14BOOK8i + β15BOOK9i + β16BOOK10i + β17BOOK11i + β18BOOK12i + β19BOOK13i + β20BOOK14i + εit
5. Results and Discussion
Results from models 1 and 2 are presented in Table 4. The overall fit of the models, as measured by the adjusted R 2, is 0.56 and 0.63, respectively. These values lie within the range of measures of fit in other pricing models for yearlings and 2-year-olds (0.37–0.72) (see Plant and Stowe [Reference Plant and Stowe2013] for a summary of the yearling models and Roberts and Stowe [Reference Robert and Stowe2016] for the 2-year-old model). According to the adjusted R 2 values, model 2 fits the data somewhat better than model 1, although in general the signs, magnitudes, and significance of the explanatory variables are similar. This suggests that controlling for the identity of each individual sire is more explanatory than describing sires by their stud fee and stage of breeding career. However, a disadvantage of model 2 is that one loses the ability to isolate the effects of stud fees and young sires on sales prices. Because of the differences in coefficient estimates in the two models, the marginal values implied by the coefficient estimates also vary.
Table 4. Coefficients, Standard Error, and Marginal Values for Models 1 and 2
Notes: Asterisks (***, **, and *) indicate significance at the 1%, 5%, and 10% levels, respectively.
Results from models 1 and 2 will be discussed, with the relevant result from model 2 indicated in parentheses. In both models, the individual-specific explanatory variables are significant at 5% or better. On average, colts sell for more than fillies (P < 0.05); the estimated marginal value of this effect is about $4,500 ($6,000). Age is also positively correlated with hammer price (P < 0.01); each additional day of age is worth more than $156 ($163); this can represent a difference of more than $22,000 ($23,000) between the youngest and oldest weanlings in the sale, all else being equal. Kentucky-bred weanlings sell for less than those foaled elsewhere (P < 0.01). The sign and significance of this variable is inconsistent across previous studies (for a synopsis, see Plant and Stowe, Reference Plant and Stowe2013). This result may suggest that, on average, the lower-quality Kentucky-bred foals are culled at the November sale. The “discount” on Kentucky-bred weanlings averages about $6,600 ($6,800). Finally, weanlings that have been nominated for the Breeders’ Cup sell for higher prices on average (P < 0.01); buyers pay a premium of about $5,100 ($3,800) for this attribute. The magnitude of this effect is interesting. According to the Breeders’ Cup Limited (2015), the fee for nominating a foal in the year it is born ranges from $400 to $1,500.Footnote 7 The marginal value exceeds the nomination fee, which suggests that this variable may be capturing other expected quality signals unobservable to the econometrician.
As expected, the pedigree variables are highly significant. In model 1, the controls for sire pedigree are significant; however, these are omitted from the estimation of model 2 because they are captured in the sire fixed effects. In model 1, the stud fee of the weanling's sire is significant at the 1% level. A $1 increase in stud fee results in an $0.84 increase in average price; to put this figure into more representative terms, a $1,000 increase in stud fee is reflected in an $840 increase in sales price. Other studies have also found this “overinvestment” result, where a $1 investment in stud fee is rewarded by a less than $1 increase in hammer price (Buzby and Jessup, Reference Buzby and Jessup1994; Chezum and Wimmer, Reference Chezum and Wimmer1997; Parsons and Smith, Reference Parsons and Smith2008; Plant and Stowe, Reference Plant and Stowe2013; Robbins and Kennedy, Reference Robbins and Kennedy2001; Robert and Stowe, Reference Robert and Stowe2016; Vickner and Koch, Reference Vickner and Koch2001). Weanlings by first-crop sires receive a premium of more than $9,000 (P < 0.01), whereas weanlings by second-crop sires are discounted by an average of more than $5,600 (P < 0.01). There is no significant difference between prices of weanlings by third-crop sires and the more established sires, all else being equal. The result on first-crop sires supports anecdotal evidence that progeny by the newest sires may be fashionable because of their recent racing success; therefore, they are in higher demand by buyers. We suspect its influence may depend on market conditions (paying a premium for a foal by an unproven sire might signal a greater willingness to take risk, and the willingness to take risk depends on general economic conditions) and the quality of the sire crop. In addition, there appears to be value in correctly predicting that a new sire is going to be successful, if only in terms of increasing social capital among market participants. In model 2, the significance test on the sire fixed effects indicates that the null hypothesis of coefficients on the sire dummy variables being jointly zero is rejected. This result suggests that the identity of the sire is a determinant of sales price.
In model 1, there is a trend toward significance that weanlings by broodmares who had earned black type during their racing careers sell for about $3,700 more than those that are not (P < 0.1). This variable is significant at the 5% level in model 2 and carries greater economic significance, resulting in an average sales price about $5,600 greater, all else being equal. Weanlings by broodmares who have already produced black-type-earning progeny sell for more than $13,600 ($12,500) more (P < 0.01). Clearly, buyers expect that a history of producing winners on the racetrack improves the odds that a weanling might itself experience success on the racetrack.
Many of the variables representing the weanling's placement in the sale are also significant. According to the estimates on the book coefficients, there is a general declining trend in prices throughout the sale. The difference in prices on any particular day differs from Book 1 prices by an average of nearly $15,000 ($10,000) to nearly $35,000 ($33,000). The differences between average prices from Books 5 to 14 are all significantly less than Book 1 prices at the 5% level or better. The marginal values increase in absolute value (representing larger discounts) until Book 13, where it falls slightly. Interestingly, the marginal value of weanlings sold in Book 14 is closer to the marginal values of Book 6 than to books later in the sale. One possible explanation for this unexpected result is that there were significantly fewer weanlings sold in Book 14 relative to the others books; a few high prices would have the ability to reduce the discount. There are a few possible explanations for the overall declining trend in prices across books. The first is that higher-quality weanlings are placed near the front of the sale by the auction company. The second may be a budget-constraint effect; as the sale goes on, buyers may be nearing or have completely exhausted their allotted budget with which to purchase weanlings. However, the opposite may also hold (which could help explain the result on the Book 14 coefficient estimate); if buyers have not exhausted their budget or filled their orders by the final day of the sale, they may increase spending.
The results from both models suggest that information regarding the quality of a Thoroughbred weanling's pedigree is highly significant in determining the hammer price of a weanling, although controlling for the identity of the sire seems to provide a slightly more accurate estimate of prices rather than controlling for stud fee and stage in breeding career. In addition, some individual characteristics such as age, gender, and place of birth are important, as well as placement in the sale.
6. Conclusion and Implications
The value of a Thoroughbred weanling is difficult to assess based on its relative immaturity. However, buyers utilize information available on the expected quality of the weanling according to sire and dam pedigree variables.
The analysis conducted in this article provides important and new insight to the value of a segment of the Thoroughbred auction market that previously has not been studied. In doing so, this research fills a gap in the price analysis research for Thoroughbreds and can serve as a decision tool for both sellers, in establishing reasonable reserve prices, and buyers, in determining fair purchase prices.
In addition, the results provide insight into how the ability to sell prospective racehorses as weanlings may help diversify risk in the market between buyers and sellers. The time between conception to a Thoroughbred's first start on the racetrack is at least 3 years, meaning that the mare owner is spending significant amounts of money on board and daily care, stud fees, and later, in training fees, before the opportunity for a return on investment is realized. Therefore, the presence of more frequent sales allows breeders to sell some of their stock to smooth the stream of income. That the Kentucky-bred weanlings were discounted relative to others suggests that some breeders may cull their lower-quality weanlings to cut costs. Moreover, the “premium” for weanlings that did not reach their reserve price also suggests that owners of foals whose pedigrees have suddenly become desirable may use the sale as an opportunity to “strike while the iron is hot” and capitalize on their good fortune. The weanling market also attracts one type of market participant, the pinhooker. More than half of the weanlings at the sale (55%) were pinhooked and sold the following year as yearlings.
Future research includes examining profitability for the pinhook market and determining the extent to which purchase prices predict career racing performance.


 Open access