


Introduction
Determining species presence and distribution is not only useful to ecological research (Rosenzweig Reference Rosenzweig1995, Elith et al. Reference Elith, Graham, Anderson, Dudík and Ferrier2006, Graham et al. Reference Graham, Moritz and Williams2006), but can also be of great importance in environmental impact assessments (Pearson & Dawson Reference Pearson and Dawson2003) and conservation action plans (Margules & Pressey Reference Margules and Pressey2000, Ferrier Reference Ferrier2002, Funk & Richardson Reference Funk and Richardson2002). In this context, medium to large vertebrates in tropical forests are a priority because of their ecosystem role (e.g., seed predation and dispersal, predator of herbivore species) and because they are often threatened by habitat loss and fragmentation (Ceballos et al. Reference Ceballos, Ehrlich, Soberon, Salazar and Fay2005, Ahumada et al. Reference Ahumada, Silva, Gajapersad, Hallam and Hurtado2011, Visconti et al. Reference Visconti, Pressey, Giorgini, Maiorano and Bakkenes2011). Asian tropical forests in particular are among the most affected by illegal activities, particularly overhunting (Vié et al. Reference Vié, Hilton-Taylor and Stuart2009). Hunting of wildlife in Southeast Asia has occurred for thousands of years, mainly for nutritional and economic reasons (Fa et al. Reference Fa, Peres and Meeuwig2002, Corlett Reference Corlett2007), but wild meat is not just a source of food – it has also become an important income source due to the increasing regional demand for wildlife products backed by an illegal market such as traditional medicine, pets, trophies and decorations (Rao et al. Reference Rao, Myint, Zaw and Htun2005, Corlett Reference Corlett2007). Moreover, in Southeast Asia, forest logging, both in unprotected and – illegally – in protected areas, has resulted in growing human access to forests and increasing hunting pressures both for trade and for provision of food for loggers camping in the forest (Meijaard et al. Reference Meijaard, Sheil, Nasi, Augeri and Rosenbaum2005). Hunters, even if they sometimes have access to new technologies, such as guns and flashlights, often still use unselective snares and traps that require less effort and time than active hunting, which can cause shifts in the faunal species composition (Jerozolimski & Peres Reference Jerozolimski and Peres2003, Corlett Reference Corlett2007). This process affects even more vulnerable habitats such as islands, which are frequently affected by introduced species, overexploitation of resources and habitat destruction (Fordham & Brook Reference Fordham and Brook2010). Wildlife exploitation has reduced the range and abundance of many island species in Southeast Asia, directly causing severe biodiversity loss at a local scale (Brook et al. Reference Brook, Sodhi and Ng2003). In Myanmar, for example, hunting and habitat loss have been largely responsible for the depletion of large mammals from many protected areas (Milton & Estes Reference Milton and Estes1963, Aung et al. Reference Aung, Khaing Swe, Oo, Kyaw Moe and Leimgruber2004, Rao et al. Reference Rao, Myint, Zaw and Htun2005, Reference Rao, Htun, Zaw and Myint2010).
The establishment of protected areas does not prevent illegal activities and wildlife decline without an effective management plan, patrol activity and local community awareness (Rao et al. Reference Rao, Rabinowitz and Khaing2002, Jenks et al. Reference Jenks, Howard and Leimgruber2012, Laurance et al. Reference Laurance, Carolina Useche, Rendeiro, Kalka and Bradshaw2012, Di Marco et al. Reference Di Marco, Boitani, Mallon, Hoffmann and Iacucci2014). In Myanmar, Lampi Marine National Park (LMNP) was established in 1996, but the lack of effective management for a long time (a member of permanent park staff was allocated to LMNP only in 2013) has allowed illegal human activities and settlements to increase over time. LMNP is the only protected area in the Myeik Archipelago. It is an Important Bird Area (IBA), it has been an Association for Southeast Asian Nations (ASEAN) heritage site since 2003 and it was proposed by the Ministry of Environmental Conservation and Forestry (MOECAF) as an UNESCO World Heritage Site in 2014. LMNP includes a variety of pristine terrestrial habitats important for maintaining a high level of diversity of terrestrial wildlife. The Park area also provides food, water and wood (used as fuel as well as raw material for the construction of boats and houses) to the local population of c. 2600 people in five settlements. Fishing is the most important economic activity of the area, but hunting is an illegal business that seems to be very lucrative – although not always directly for local people, who most of the time hunt just for subsistence consumption, but especially for people coming from outside the island to hunt and sell mouse deer, pangolins, wild pigs and common water monitors to fishing boats or to local markets inland (Soe et al. Reference Soe, Swe Pyi and Zin2010). The first park management plan, officially approved in 2014 by MOECAF, highlights the importance of the area for biodiversity conservation, recreational activities, scientific research and education. Hence, the main aim of this study is to identify areas where illegal activities occur and where they can be more problematic for wildlife conservation.
Species distribution models (SDMs) are tools used to predict species distributions in relation to environmental covariates such as habitat or climate (Elith et al. Reference Elith, Graham, Anderson, Dudík and Ferrier2006, Linkie et al. Reference Linkie, Chapron, Martyr, Holden and leader-Williams2006, Phillips et al. Reference Phillips, Anderson and Schapire2006, Cayuela et al. Reference Cayuela, Golicher, Newton, Kolb and De Alburquerque2009, Guisan et al. Reference Guisan, Tingley, Baumgartner, Naujokaitis-Lewis and Sutcliffe2013, Gomes-Vale et al. Reference Gomes-Vale, Campos, Silva, Gonçalves and Sow2016). In the scientific literature, there are few bridges between SDM theory and real decision-making processes (Guisan et al. Reference Guisan, Tingley, Baumgartner, Naujokaitis-Lewis and Sutcliffe2013). In this study, we used park staff patrolling data for both scientific and management purposes, trying to close this gap in LMNP. In particular, we used maximum-entropy (MaxEnt) algorithms (Phillips et al. Reference Phillips, Anderson and Schapire2006) to estimate species distributions, since this technique has been widely used on presence-only data sets, allowing us to estimate habitat suitability for multiple species as a function of certain environmental variables (Wisz et al. Reference Wisz, Hijmans, Li, Peterson, Graham and Guisan2008, Aguirre-Gutiérrez et al. Reference Aguirre-Gutiérrez, Carvalheiro, Polce, van Loon and Raes2013). By assessing species presence in the Park using camera traps and sightings, we show how camera trap data and data collected during law enforcement patrol activities of park staff can be successfully used to map illegal activities in LMNP. We then discuss how model outputs can be applied for wildlife conservation, identifying priority areas for patrolling and determining species that seem to be most strongly affected by human activities in this remote region.
Material and Methods
Study Area
LMNP is in the Myeik Archipelago, Boke Pyin Township, Taninthayi Region, Myanmar (10° 50′ N, 98° 12′ E) and includes the major island of Lampi (205 km2) and 20 smaller islands (0.3–16.0 km2 in size). LMNP extends two miles from the outer islands, covering a total of 1230 km2, of which 235 km2 are of terrestrial habitats. The islands are covered by tropical lowland wet evergreen forest in the interior, mangrove forest along rivers and freshwater sources and white sandy beach and dune forest along the coasts; other important habitat types are coral reefs, sea-grass beds, freshwater streams and swamps (Giardino et al. Reference Giardino, Bresciani, Fava, Matta, Brando and Colombo2015). Lampi Island is the core of LMNP, orientated in a north–south direction, with a length of 48 km and a maximum width of c. 6 km. Evergreen forest is the dominant inland vegetation type, characterized by a high level of diversity of plant species, with tree species belonging to the genera Dipterocarpus, Shorea, Vatica and Hopea. Mature trees of species of these genera are scarce, due to illegal selective logging. LMNP is characterized by two community types of mangrove forests along rivers: the Rhizophora apiculata community and the Bruguiera cylindrica community.
Monitoring of Wildlife and Human Disturbance
The study was carried out using an integrated monitoring approach that involved camera traps to record mammal and reptile presence and both camera traps and patrolling to detect signs of human activity.
Camera traps were used between November 2015 and May 2017 during the dry season (November–May) and were deployed for different periods of time in 72 different locations (Fig. 1). Locations were selected opportunistically to maximize trapping rates of medium to large terrestrial wildlife in different habitat categories and to cover most of the island (Table S1, available online). We concentrated on mammals and reptiles because they were most targeted by poachers. We used Acorn LTL-5310 camera traps, and each camera trap was tied to trees at c. 50 cm above the ground. Each time the passive infrared (PIR) sensor was activated, camera traps were programmed to record 30-second videos (at a 1280 × 720 pixel resolution) with 1-minute intervals between consecutive videos, 24 hours a day. Camera trapping was used to make an inventory of the species occurring in the Park; thus, it lacked a robust and systematic sampling design, but it allowed us to monitor most of LMNP. Moreover, opportunistic sightings of mammal species (or their tracks) were recorded by operators along the trails used to access each camera. Unfortunately, most of these sightings lacked a georeferenced location and could not be used for species distribution analysis, but could give confirmatory information about species presence on the island (Table 1).
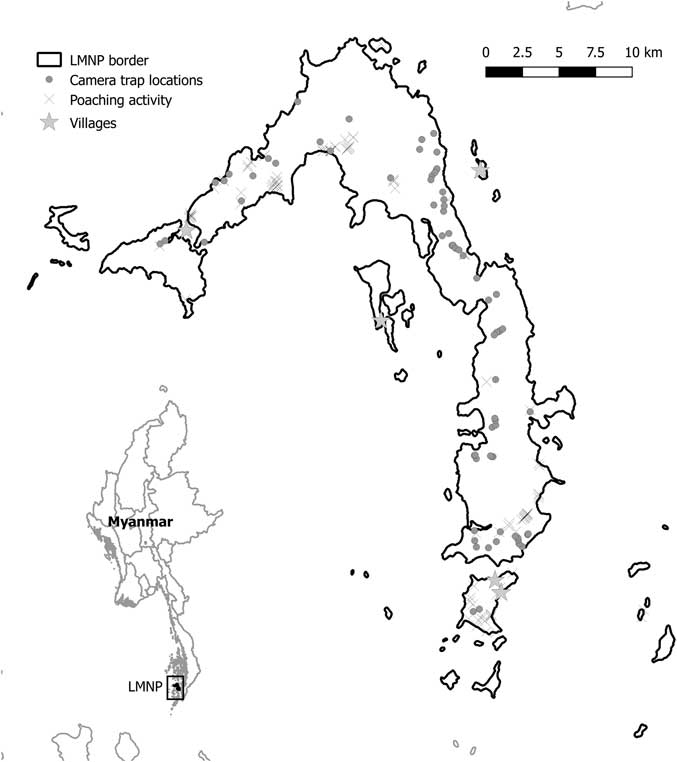
Fig. 1 Mergui and Lampi islands (Myanmar). Dots indicate camera trap locations and crosses show locations of know illegal human activity. LMNP=Lampi Marine National Park.
Table 1 Species detected in Lampi Marine National Park using camera traps and opportunistic sightings. For each species, the number of georeferenced points (n of localization), the distribution model area under the receiver operating characteristic curve (AUC) and the overlap in percentage between the species distribution model and human activity distribution model (% poaching activity overlap) are reported

a IUCN status refers to the species as T. kanchil
CE=Critically Endangered; IUCN=International Union for Conservation of Nature; LC=Least Concern; NT=Near Threatened; VU=Vulnerable
Human activity in the forest was recorded during patrolling carried out six times per month by the LMNP staff between October 2016 and May 2017. LMNP is divided into six patrol sectors, each covering a different part of the Park, and for each sector the staff covered a trail from 2 to 6 km long, starting from the beach and entering the forest. The patrolling activities were carried out after Spatial Monitoring and Reporting Tool (SMART) training implemented by the Wildlife Conservation Society (WCS). SMART is a software application that enables one to collect and store data from patrolling in order to enhance the effectiveness and efficiency of the law enforcement and monitoring system of the Park. During patrolling, the occurrence of all illegal activities (e.g., snare traps, forest camps, water extraction and logging) was recorded.
Geographic coordinates were recorded as latitude and longitude (WGS84 datum) for camera trap locations and signs of human activity using a portable GPS receiver (Garmin Dakota 10, Garmin Dakota 20), and then expressed in the Universal Transverse Mercator (UTM/UPS) Coordinate Reference System (fuse 47 North, WGS84 datum, EPSG code 32647). Data were collected using datasheets specifically developed for the purpose and analysed with the open-source software Quantum GIS (QGIS Development Team 2018).
Species Distribution Modelling
Species and human distribution were estimated with the MaxEnt algorithm (Phillips et al. Reference Phillips, Anderson and Schapire2006) using the R software (R Core Team 2017) and the package ‘dismo’ (Hijmans et al. Reference Hijmans, Phillips, Leathwick and Elith2017). Environmental variables used to predict species distribution were created using a LMNP land cover map produced by Landsat-8 OLI reflectance data (Giardino et al. Reference Giardino, Bresciani, Fava, Matta, Brando and Colombo2015), a digital elevation model (SRTM-30 dataset, section 56_10; Reuter et al. Reference Reuter, Nelson and Jarvis2007) and a distance from rivers raster map, calculated using river signatures detected from the above Landsat-8 data set (Giardino et al. Reference Giardino, Bresciani, Fava, Matta, Brando and Colombo2015). Starting from the land cover map, for each habitat category, a 30-m resolution map was produced, calculating the proportion of each habitat category in a circular area with a radius of 200 m. With this procedure, we obtained 11 putative land cover predictors with values ranging between 0 and 1. As a first step, we calculated variance inflation factors (VIFs) for the 13 putative predictors (11 land cover classes, plus elevation and distance from rivers), and found no collinearities (VIF <10 for all ecogeographical variables; Naimi et al. Reference Naimi, Hamm, Groen, Skidmore and Toxopeus2014; Table S2). As beaches are not a habitat commonly used by target species, we removed sandy beach and stone beach percentage maps from the set of predictor variables. Moreover, as the area covered by some of the remaining land cover categories was very small and assuming that they could be perceived as a continuum for our target species, we merged four original land-use classes into ‘water vegetation’ (i.e., ‘intertidal areas’ + ‘mangroves’; Table S2) and ‘coastal vegetation’ (i.e., ‘dune forest’ + ‘sand vegetation’). With this procedure, we obtained nine final predictors (Table 2) – VIFs for the new set of predictors show that variables did not have collinearity problems (Table S3).
Table 2 Permutation importance (percentage) of predictors and their effect on each species distribution: directly (bold) and inversely (underlined) proportional to predictor percentage.

a The three most important predictors for each species
MaxEnt was run using its default configuration, as is often done when calculating multi-species models, making model fine-tuning for each species impractical (Merow et al. Reference Merow, Smith and Silander2013).
MaxEnt ‘raw’ output provides a continuous raster (with values ranging from 0 to 1): we transformed these continuous maps into binary estimated distribution maps considering as ‘estimated presence’ for the cells containing values greater than or equal to a threshold maximizing the sum of sensitivity (i.e., the percentage of correctly predicted presence cells) and specificity (i.e., the percentage of correctly predicted absence cells; Fielding & Bell Reference Fielding and Bell1997). We chose this threshold among the several available since it is one of the most accurate (Liu et al. Reference Liu, Berry, Dawson and Pearson2005) and has been successfully used in other multi-species approaches (Algar et al. Reference Algar, Kharouba, Young and Kerr2009, Buisson et al. Reference Buisson, Thuiller, Casajus, Lek and Grenouillet2010, Dubuis et al. Reference Dubuis, Pottier, Rion, Pellissier, Theurillat and Guisan2011, Fitzpatrick et al. Reference Fitzpatrick, Sanders, Ferrier, Longino, Weiser and Dunn2011, Di Febbraro et al. Reference Di Febbraro, Martinoli, Russo, Preatoni and Bertolino2016). This allowed binary ‘estimated presence/absence’ maps to be drawn, obtaining a more perceivable representation that can be useful at the decision-making level (Slocum Reference Slocum1999).
For each species estimated distribution model, the proportion of contribution of each ecogeographical variable was taken into account, and the overall slope of the response curve was used to judge whether the effect of a single variable increased or decreased the estimated suitability value. Even if MaxEnt allows model fitting with a low number of presence points, we did not create estimated distribution models for species with fewer than nine presence points; moreover, species with area under the receiver operating characteristic curve (AUC) values (indicating probability that the model prediction is correct; Fielding & Bell Reference Fielding and Bell1997) under 0.7 were not considered for further analysis (e.g., Baldwin Reference Baldwin2009). Final binary estimated distribution raster maps were used to calculate the proportion of overlap between species and human distribution as a percentage ((surface area of intersection between target species and human distribution/human distribution surface area) × 100).
Results
Camera traps operated for 33.4 ± 14.4 days (mean ± SD) at each location. Combining camera trapping and sightings, we recorded 19 different terrestrial vertebrate species (18 mammals and 1 reptile) for a total of 1270 presence points. We recorded three small mammal species (two Muridae and one Tupaiidae), five species of squirrels, four species of primates (three Cercopithecidae and one Lorisidae), two Cetartiodactyla (one Suidae and one Tragulidae), three carnivores (one Mustelidae and two Viverridae) and the Sunda pangolin (Manidae, Manis javanica). The only reptile species observed was the common water monitor (Varanus salvator), included in models because it is subject to poaching. Five of these species are considered as Near Threatened or Vulnerable (International Union for Conservation of Nature (IUCN) Red List criteria: http://iucnredlist.org), while the Sunda pangolin is considered Critically Endangered (Table 1).
The Sunda pangolin, northern treeshrew and Indochinese ground squirrel models had AUC values of 0.55, 0.54 and 0.51, respectively. Since their estimated distributions would not be significantly different from a random distribution (Baldwin Reference Baldwin2009), these species were excluded from further analysis.
A total of 107 human presence signs were recorded (Fig. 2) and used to estimated human distribution: 37 snare traps, 28 abandoned camps, 20 signs of logging activities, 18 active camps and 4 signs of water extraction. There were overlaps between the human activities estimated distribution maps and each SDM (Table 1). The two species that had the greatest overlap with human activities estimated distribution were two least-concern species that are quite widespread in LMNP, namely the common palm civet and the lesser mouse deer (subspecies lampensis), but other more threatened species such as the black giant squirrel (Near Threatened) and the northern pig-tailed macaque (Vulnerable) also had overlaps with human activities.
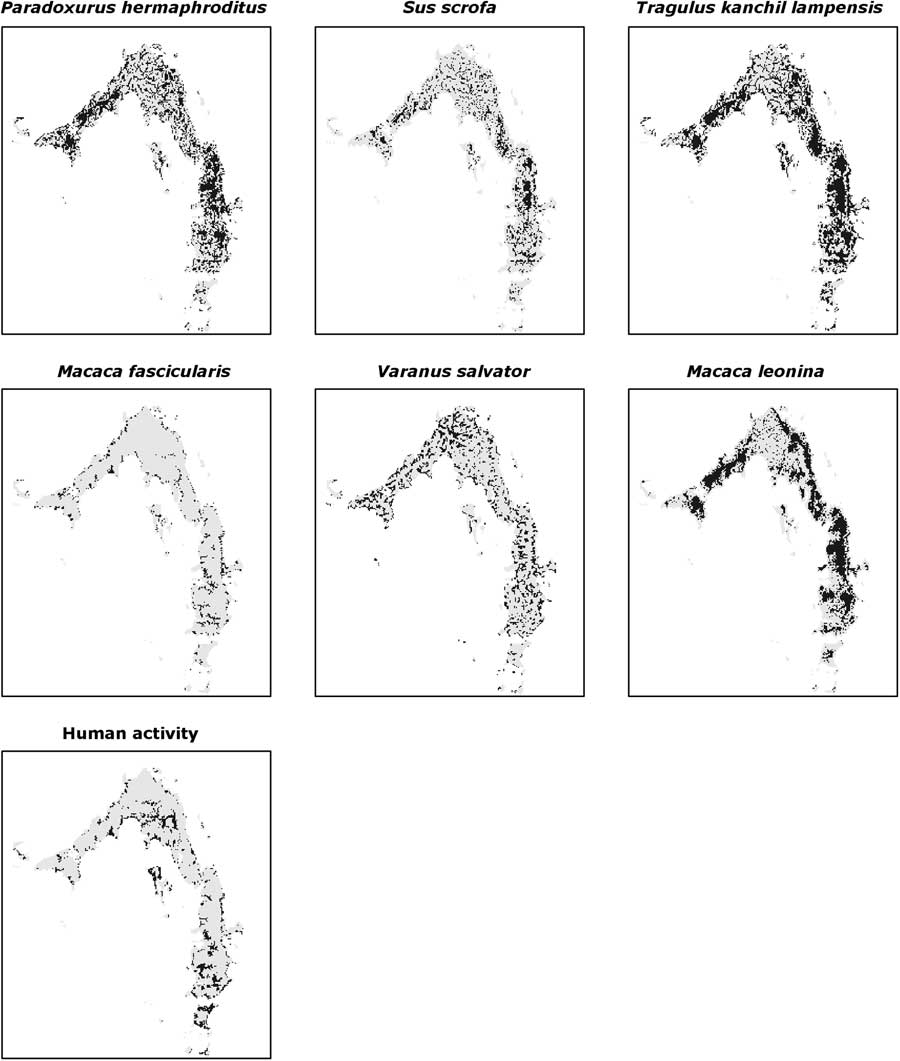
Fig. 2 Species estimated distributions (dark grey) obtained with maximum-entropy modelling.
The relative contributions of the environmental predictors used varied for each species; elevation, evergreen forest and distance from river were the most important for the majority of species (Table 2). The relationship with evergreen forest was positive for most species, while distance from river was always negative.
Discussion
The combined use of camera traps with occasional sightings made it possible to increase the number of species detected in LMNP, since cameras set just above ground level cannot reliably detect arboreal species (e.g., Pallas’s squirrel, Bengal slow loris). Silveira et al. (Reference Silveira, Jácomo and Diniz-Filho2003) showed how track surveying is the most time-efficient method for detecting species presence, followed by line transects and camera trapping. Since population surveys had never previously been attempted in LMNP, we included opportunistic sightings because an integrated monitoring approach was more cost effective in collecting species presence information.
Estimated distribution models improved the knowledge of the presence and distribution of some of the LMNP species and helped with evaluating the risk associated with human pressures. In this particular situation, due to non-systematic presence-only data collection and the small sample size, the models presented here could be biased, but MaxEnt is perhaps the most popular and repeatable approach to making such comparisons; it is widely used (e.g., Rödder & Lötters Reference Rödder and Lötters2009, Roscioni et al. Reference Roscioni, Russo, Di Febbraro, Frate, Carranza and Loy2013, Reference Roscioni, Rebelo, Russo, Carranza, Di Febbraro and Loy2014, Russo et al. Reference Russo, Di Febbraro, Rebelo, Mucedda and Cistrone2014, Reference Russo, Di Febbraro, Cistrone, Jones and Smeraldo2015, Mayol et al. Reference Mayol, Riba, González-Martínez, Bagnoli and Beaulieu2015) and tends to perform better than other similar techniques (Elith et al. Reference Elith, Graham, Anderson, Dudík and Ferrier2006, Thorn et al. Reference Thorn, Nijman, Smith and Nekaris2009, Jackson & Robertson Reference Jackson and Robertson2011, Bosso et al. Reference Bosso, Rebelo, Garonna and Russo2013, Ramirez-Villegas et al. Reference Ramirez-Villegas, Cuesta, Devenish, Peralvo, Jarvis and Arnillas2014, McCarthy et al. Reference McCarthy, Wibisono, McCarthy, Fuller and Andayani2015), and a fair spatial coverage of the most utilized areas useful for management and law enforcement was achieved.
We recorded the presence of globally threatened and rare species such as the northern pig-tailed macaque, populations of which in Myanmar are declining because of logging, habitat loss, hunting and trade (Boonratana et al. Reference Boonratana, Das, Yongcheng, Htun and Timmins2008), and the smooth-coated otter, which is threatened by loss of wetland habitats due to infrastructure construction and agriculture, reduction in prey biomass, poaching and contamination of waterways by pesticides (de Silva et al. Reference de Silva, Khan, Kanchanasaka, Reza Lubis, Feeroz and Al-Sheikhly2015). The presence of these species and proven illegal activities should put LMNP in the spotlight; the decline of Asian tropical forest mammal populations in general because of trade-backed poaching (Ceballos & Ehrlich Reference Ceballos and Ehrlich2002, Corlett Reference Corlett2007, Schipper et al. Reference Schipper, Chanson, Chiozza, Cox and Hoffmann2008) could be repeated in LMNP.
Similarly, the Bengal slow loris is also a vulnerable species that is mainly threatened by habitat loss and fragmentation, but also by hunting and illegal trade (for meat, traditional medicine and the pet trade) of this nocturnal primate’s populations (Nekaris & Nijman Reference Nekaris and Nijman2007, Streicher et al. Reference Streicher, Singh, Timmins and Brockelman2008).
An important record was the presence of the critically endangered Sunda pangolin, which is listed as a ‘Completely Protected Animal’ in Myanmar under the Protection and Conservation of Natural Areas law (1994). Sunda pangolin populations are estimated to have fallen rapidly in recent decades because of habitat loss and hunting to supply the international trade for live pangolins, skins, scales and meat (Challender & MacMillan Reference Challender and MacMillan2014, Zhang et al. Reference Zhang, Miller, Yang, Chan, Gaubert, Ades and Fischer2015). In particular, Myanmar plays a key role in supplying pangolin scales and live animals for international trade to China (Challender et al. Reference Challender, Nguyen Van, Shepherd, Krishnasamy and Wang2014, Nijman et al. Reference Nijman, Zhang and Shepherd2016). Regrettably, the Sunda pangolin and slow loris models did not perform well enough to be reliable: indeed, we obtained a low AUC for the former species and we recorded only two sightings of the latter, probably due to its arboreal and nocturnal habits.
Another potential issue for LMNP conservation could be that animals – or parts of them – are commercialized for traditional medicine, not only for the Chinese market but also inside Myanmar, particularly towards the neighbouring Mon region (Nijman & Sheperd 2017). Nijman and Shepherd (Reference Nijman and Shepherd2017) found that in Kyaiktiyo market 16 different species were sold for traditional medicine, some of which are also hunted in LMNP (Macaca spp., Trachypithecus spp., Manis spp.). Marine fauna could also be vulnerable: during our research in LMNP, fishing vessels encroached on no fishing areas, and species such as the Irrawaddy dolphin (Orcaella brevirostris) could be endangered due to exploitation for the local traditional medicine market. Our results confirm LMNP as an important protected area for marine species as well.
To model the distribution of human illegal activities inside the Park, we used pictures of people taken by camera traps and tracks and signs recorded during patrolling. The patrolling recorded illegal activities such as logging or hunting, which are forbidden within LMNP as per notification no. 40/696 that established the protected area, granting access to the main island exclusively to local residents. We suppose that a considerable amount of the illegal activities are carried out by people coming by sea from outside the Park: locals should not need to camp there for hunting or logging, yet we found several unauthorized forest camps. Being able to compare the human estimated distribution with that of wildlife offered an opportunity to identify areas susceptible to anthropogenic risks.
Illegal hunters in LMNP mostly target the lesser mouse deer and the Eurasian wild pig as meat sources for locals and markets, while the common water monitor is hunted not just for its meat, but especially for the value of its skin in the leather trade and its fat for traditional medicine (Bennet et al. Reference Bennet, Gaulke, Pianka, Somaweera and Sweet2010). Even if these species are classified as of Least Concern by the IUCN, hunters often use unselective traps to catch these animals, since snaring requires less effort and time than active hunting. Hence, even if hunting activities are not directly targeting the endangered species present in the area, trapping can have serious effects on their persistence, eventually causing shifts in the faunal species composition (Jerozolimski & Peres Reference Jerozolimski and Peres2003, Corlett Reference Corlett2007). In fact, most of the species models overlapped with the estimated human distribution and for some species overlap was high. In particular, the black giant squirrel (a Near Threatened species) overlapped for most of its distribution (73%), and the pig-tailed macaque (Vulnerable) overlapped for 20% of its range in the area. Despite the highly specific habitat requirements of both the smooth-coated otter and the dusky langur (coastal and deep forest, respectively), 10–17% of their distribution was also part of the human distribution. This is evidence of potential risk not just for hunted species, but also for those that may not be directly targeted for hunting purposes, but that overlap with human activity areas. Three-quarters of Khao National Park (Thailand) is considered to be natural, yet people continue to enter the Park and poachers spend weeks in the forest setting up semi-permanent field camps, as in LMNP (Jenks et al. Reference Jenks, Howard and Leimgruber2012). There the presence of more ranger stations would help to reduce poaching activities, but it would be better to increase patrol activities in inaccessible areas (Jenks et al. Reference Jenks, Howard and Leimgruber2012). Law enforcement is probably the main problem for nature conservation in protected areas. We planned routine patrolling activities with LMNP staff; the next step will be to test whether this approach is efficient at reducing illegal human activities in future.
Questionnaires and interviews have been widely used to learn about the exploitation of forest resources, but may underestimate real poaching and logging rates (Weladji & Tchamba Reference Weladji and Tchamba2003, Rao et al. Reference Rao, Myint, Zaw and Htun2005, Knapp et al. Reference Knapp, Rentsch, Schmitt, Lewis and Polasky2010, Steinmetz et al. Reference Steinmetz, Srirattanaporn, Mor-Tip and Seuaturien2014). Signs recorded by patrols and cameras showed that human activities are widely distributed in the Park, and areas more selected by people are those at lower elevations and mainly in evergreen or semi-evergreen forests. Villages occur at lower elevations close to the shore, making lower-elevation forests more accessible to people; the two forest habitats selected are those where most of the species occur.
Although distance from rivers was not among the most important environmental variables, especially in the human presence model, it was often negatively correlated with species suitability (i.e., greater distances corresponded with lower probability of human activities, whereas distance from a river often has a negative effect on suitability for wildlife). Tropical forests are sometimes difficult to access, and walking into the forest requires time and energy, especially when trails are not available as in LMNP. Hence, rivers represent a faster and easier way not just to cross the forest and reach its heart, but also to transport logs and prey back to the villages, especially during the rainy season, when stream levels rise. This information is of great importance in identifying areas potentially threatened by human impacts and could allow special attention to be directed to the river while patrolling, as well as in planning conservation actions.
Conclusions
Georeferenced human presence signs recorded by patrolling and camera traps can be a viable approach to identifying the real risk associated with illegal activities in natural areas. Our results indicate that LMNP is valuable in terms of habitat types, species richness and composition. Its conservation effectiveness may be improved in the future thanks to better targeting of management activities such as enforcement and direct compensation payments to local communities; patrol activities alone will not be effective, and engagement of local communities will be of fundamental importance in the coming years. The outcomes of modelling the estimated presence of both wildlife and humans proved useful here to identifying ‘areas of conflict’; such an approach could also help to identify zones where the development of alternative income sources for local people might be focused, such as tourism regulated in order to minimize impacts on pristine areas, limiting stresses on biodiversity, but also offering local people a real alternative to poaching (Jenks et al. Reference Jenks, Howard and Leimgruber2012).
Supplementary Material
For supplementary material accompanying this paper, visit www.cambridge.org/core/journals/environmental-conservation
Acknowledgements
We are grateful to Peter Brakels (Istituto Oikos) and Anna Giovannini (University of Insubria), who contributed to data collection in 2016 and 2017. We also appreciate the technical cooperation of the LMNP personnel rangers, foresters and forest guards involved in the monitoring and patrolling activities. The research in the LMNP has been realized with the help of Lara Beffasti and Elisa Facchini (Istituto Oikos).
Financial Support
This work was part of the project ‘COAST: Rafforzare le capacità locali per la COnservazione Ambientale e lo Sviluppo del Turismo nell’arcipelago di Myeik’ – AID 0101178/OIKOS/BUR, financed by the Italian Ministry of Foreign Affairs.
Conflict of Interest
None.
Ethical Standards
None.


