


Introduction
The conversion of tropical forest land to other land uses contributes to nearly 20% of the world’s greenhouse gas emissions (Achard et al. Reference Achard, Defries, Eva, Hansen, Mayaux and Stibig2007), which includes activities such as gross deforestation, forest replacement by agriculture and pastureland and the establishment of monoculture forest plantations, among other activities (Gibbs et al. Reference Gibbs, Ruesch, Achard, Clayton, Holmgren, Ramankutty and Foley2010, Hosonuma et al. Reference Hosonuma, Herold, De Sy, De Fries, Brockhaus and Verchot2012, Austin Reference Austin2017). Several international initiatives were developed to assist developing countries with financial incentives to avoid deforestation and improve forest management, including the REDD+ (Reducing Emissions from Deforestation and Forest Degradation) mechanism, established by the Conference of Parties to the United Nations Framework Convention on Climate Change (UNFCCC) (Corbera & Schroeder Reference Corbera and Schroeder2011), as well as international funding initiatives, including the Carbon Fund of the Forest Carbon Partnership Facility (FCPF) and the Green Climate Fund developed by the UNFCCC. More local initiatives include the National Forest Conservation Program for the Mitigation of Climate Change (Programa Bosques) of the Ministry of the Environment of Peru (MINAM), developed in 2010 within the framework of the free trade agreement between the USA and Peru. As countries increase their capacity to monitor and manage their forests, many systems focus on estimating periodic deforestation from satellite imagery (Potapov et al. Reference Potapov, Turubanova, Hansen, Adusei, Broich and Altstatt2012, Romijn Reference Romijn2012, Petersen Reference Petersen2018), and a few current systems contain satellite-based near-real-time early alerts of forest loss (Hansen et al. Reference Hansen, Krylov, Tyukavina, Potapov, Turubanova and Zutta2016, Musinsky et al. Reference Musinsky, Tabor, Cano, Ledezma, Mendoza, Rasolohery and Sajudin2018). Techniques such as kernel density mapping (West et al. Reference West, Börner and Fearnside2019) and hotspot analysis (Sanchez-Cuervo & Aide Reference Sanchez-Cuervo and Aide2013, Kalamandeen et al. Reference Kalamandeen, Gloor, Mitchard, Quincey, Ziv and Spracklen2018) are used to track the density of deforestation over time. However, these systems monitor past deforestation events, even if they are considered near-real-time, as satellite images may be available for days to weeks after image capture (Hansen et al. Reference Hansen, Krylov, Tyukavina, Potapov, Turubanova and Zutta2016).
The Peruvian Amazon contains the second largest portion of Amazon forest following Brazil, with a complex heterogeneous landscape and a variety of anthropogenic pressures that have increased deforestation in the last decade. These pressures include cacao plantations, which are a historic deforestation driver, particularly in forests at higher altitudes (Bax & Francesconi Reference Bax and Francesconi2018), where cacao and coffee plantations are favoured at altitudes from 1000 to 2500 m, but they can also be found sporadically in the lowlands. Oil palm plantations represent a more recent driver of deforestation, with significant large-scale impact beginning c. 2007 in key lowland rainforest regions of San Martin and Ucayali (Vijay et al. Reference Vijay, Reid, Finer, Jenkins and Pimm2018). Illicit artisanal-scale gold mining has had a devastating impact in the last decade, albeit often restricted to the rainforests of Madre de Dios (Asner & Tupayachi Reference Asner and Tupayachi2017, Espejo et al. Reference Espejo, Messinger, Román-Dañobeytia, Ascorra, Fernandez and Silman2018), where cattle ranching is also prevalent in the eastern area, which has similar landscape characteristics to the nearby Brazilian state of Acre (Chávez Michaelsen et al. Reference Chávez Michaelsen, Huamani Briceño, Fernandez Menis, Bejar Chura, Valera Tito and Perz2013, Recanati et al. Reference Recanati, Allievi, Scaccabarozzi, Espinosa, Dotelli and Saini2015).
Recent approaches in spatial modelling utilize the historic occurrence of local deforestation, along with sets of environmental and socioeconomic conditions, to identify areas at higher risk of deforestation (Aguilar-Amuchastegui et al. Reference Aguilar-Amuchastegui, Riveros and Forrest2014, de Souza & De Marco Reference de Souza and De Marco2014, Reference de Souza and De Marco2018, Bonilla-Bedoya et al, Reference Bonilla-Bedoya, Estrella-Bastidas, Molina and Herrera2018). These approaches utilize the species distribution modelling (SDM) framework, where the correlation of occurrence or presence points and environmental, bioclimatic or socioeconomic layers are processed through a machine learning-based algorithm that ultimately correlates location and multivariate space to produce a suitability map (de Souza & De Marco Reference de Souza and De Marco2018). Machine learning algorithms have been applied in order to predict the risk of landslides (Chen Reference Chen2017) and wildfires (Fonseca et al. Reference Fonseca, Aragão, Lima, Shimabukuro, Arai and Anderson2016), as well as habitat alterations from fire disturbance (Franklin et al. Reference Franklin, Regan and Syphard2014). Among the most popular machine learning approaches in SDM is the use of maximum entropy through the recently open-sourced program Maxent (Phillips Reference Phillips2017).
The current study aims to significantly increase the spatial resolution and modelling scale and leverage 19 years of deforestation data to present a robust deforestation risk model of the entire Peruvian Amazon at a 100m spatial resolution. To our knowledge, no other study has used this range of annual data for deforestation risk modelling and at this geographical scale combined with high spatial resolution. Previous studies on deforestation prediction and risk have either been limited to a 1km spatial resolution of predictor variables (Bax et al. Reference Bax, Francesconi and Quintero2016, Bonilla-Bedoya et al. Reference Bonilla-Bedoya, Estrella-Bastidas, Molina and Herrera2018, de Souza & De Marco Reference de Souza and De Marco2018) or 10 or fewer years of deforestation data (Aguilar-Amuchastegui et al. Reference Aguilar-Amuchastegui, Riveros and Forrest2014, Bax & Francesconi Reference Bax and Francesconi2018), and none combine higher-spatial-resolution data and variables (i.e., ≤100 m) with high-temporal-cadence deforestation data (i.e., >10 years of annual data).
We had three specific objectives. The first was to develop the risk deforestation model for the entire Peruvian Amazon at 100m spatial resolution using Maxent as the SDM framework and using 19 years of official annual deforestation data. Second, we tested the temporal transferability of the model by partitioning data in time in order to test whether a model trained with early data is able to predict later deforestation events. Lastly, we tested the spatial transferability of the model by evaluating whether a model trained with data in one area could predict deforestation in another. We hypothesized that the combined use of high-temporal-cadence deforestation data, along with high-spatial-resolution predictor variables, would produce a robust deforestation risk model that would anticipate deforestation events signalled by an independent early alert (near-real-time) system.
Material and methods
The Peruvian Amazon
The deforestation risk modelling and analysis encompassed the entire Peruvian Amazon biome delineated by the MINAM (2015a) and used in its national and international reporting of deforestation and greenhouse gas emissions. The biome is distributed within 15 departments, with most of the remaining intact forests being humid tropical forests in Loreto, Ucayali and Madre de Dios. The biome extends from the eastern slopes of the Andes from c. 3200 m altitude to the lowlands of the Amazon Basin and contains c. 690 000 km2 of forest cover (MINAM 2015b). More than 2.3 million people live in the region, with clear trends in population concentrations and net migration rates, both positive and negative, dependent on the region (Menton & Cronkleton Reference Menton and Cronkleton2019). Deforestation in the Peruvian Amazon has steadily risen over the past 19 years, with spikes occurring in 2005 and 2010 being El Niño-related (Potapov et al. Reference Potapov2014). There have been several national and international initiatives to reduce deforestation (e.g., the Joint Declaration between Norway, Germany and Peru), but there has been no notable reduction in the rate of deforestation for the entire biome thus far.
Deforestation data
Forest cover loss was used as a proxy for deforestation data, with a minimum mapping unit of 30 m and an overall accuracy of 99.4% (Potapov et al. Reference Potapov2014). These date were obtained from the GeoBosques platform (http://geobosques.minam.gob.pe) of the National Forest Conservation Program for Climate Change Mitigation (PNCBMCC) of MINAM, which provides annual forest cover loss data from 2001 to 2019, from a year 2000 forest cover baseline, which is the basis for estimating remaining forest cover. The underlying algorithm and measurement system are based on the tropical forest cover loss system developed by the University of Maryland’s Global Land Analysis and Discovery (Potapov et al. Reference Potapov2014). The extent of the Peruvian Amazon biome was delimited by MINAM for emissions reduction reporting, and it excludes forest cover loss due to river meandering (MINAM 2015b). Due to the volume of pixels and computational resource limits, deforestation data were resampled to the 100m pixel spatial resolution using ArcGIS 10.5 (Esri).
Predictor variables
The predictor variables selected for this study were based on potentially direct and indirect drivers of deforestation and units of conservation (Supplementary Annex A1, available online). Continuous land cover variables for the year 2000 include distance from agricultural land, distance from pastureland, distance from mining and distance from non-forest land. These land cover variables are available from the land cover maps of GeoBosques, which are derived from 30m spatial resolution Landsat image mosaics for the year 2000 and are designed to be a complementary dataset to the annual deforestation data. Distance from roads was calculated using the road database from the Ministry of Transportation and Communication (MTC). Roads included major paved, minor paved and unpaved road categories, which were combined into a single road category for this study. Distance from rivers was derived from the land cover map for the year 2000 available from GeoBosques. All distances are Euclidean distances calculated using ArcGIS 10.5 (Esri).
Categorical predictor variables included natural protected areas obtained from the National Service of Natural Areas Protected by the State (https://geo.sernanp.gob.pe) and native community boundaries obtained from the Ministry of Culture (https://geoportal.cultura.gob.pe). Both of these datasets were from the year 2019. Elevation above sea level and slope – both continuous predictor variables – were derived from the void-filled seamless Shuttle Radar Topography Mission (SRTM) digital elevation model (http://srtm.csi.cgiar.org) available at 30 m spatial resolution. All predictor variables were projected to Universal Transverse Mercator (UTM) Zone 18 South and resampled to 100-m pixels.
Maxent
We used Maxent (version 3.4.1) running on the R Studio for PC platform (1.2.5033) for the estimation of deforestation risk. Maxent uses presence-only point occurrences together with predictor variables to model distribution over the study area (Phillips et al. Reference Phillips, Anderson and Schapire2006). This approach identifies the correlation between multiple presence points and the combination of continuous or categorical layer values in multivariate space (Phillips et al. Reference Phillips, Anderson and Schapire2006, Phillips & Dudík Reference Phillips and Dudík2008). Here, the ‘species’ is the location of the forest cover loss as a proxy for a deforestation event, as used by the Peruvian government. The location of a deforestation event in any given year is a result of the various interactions between the predictor variables at the given location. Following Aguilar-Amuchastegui et al. (Reference Aguilar-Amuchastegui, Riveros and Forrest2014), we assume that future deforestation will occur under the same set of conditions, although understanding that several factors can influence the future deforestation rate, including changes in government priorities and climate change. Although true absence data are not included in the Maxent algorithm, we also follow Aguilar-Amuchastegui et al. (Reference Aguilar-Amuchastegui, Riveros and Forrest2014) in that the true absence of deforestation may be misidentified due to factors that include near-persistent cloud cover in some areas and low-quality pixels in a given year.
Deforestation risk
We used Maxent default settings for regularization and selecting feature classes for all model runs, which include linear, quadratic, threshold and hinge features (Phillips & Dudík Reference Phillips and Dudík2008), as well as the jack-knife option, which estimates the importance of individual predictor variables. The default settings allow Maxent to select an amount of regularization that is appropriate for the number of point localities and types of features used (Phillips & Dudík Reference Phillips and Dudík2008). The total amount of deforestation from 2001 to 2019 was more than 21 728 km2 or more than 23 million point localities in a 30-m resolution grid of the Peruvian Amazon. Therefore, deforestation data were resampled to the 100m pixel spatial resolution, and 10 000 point localities of deforestation were chosen at random from the full dataset. Environmental factors and interactions between predictor variables define the set of features that constrain the geographical distribution of the ‘species’ being modelled (Phillips et al. 2006). Among several options, Maxent models produce a logistic output format that can be used as a raster file in GIS, with pixel values from 0 to 1 that represent an estimate of relative probability of presence (Phillips & Dudík Reference Phillips and Dudík2008). Pixels with a logistic value close to 1 are the sites most suitable for a ‘species’ (Phillips & Dudík Reference Phillips and Dudík2008), or, in this study, those that most closely resemble the conditions for deforestation.
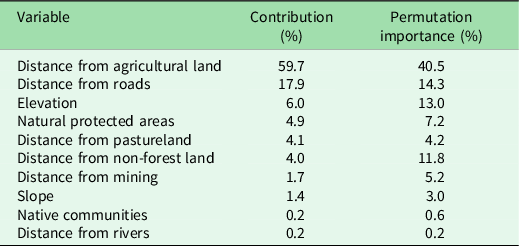
Test localities were generated by making 10 random partitions of the deforestation point localities for the execution of 10 model runs. Each partition was a random selection of 10 000 georeferenced points of the total deforestation from 2001 to 2019. For each of these model runs, 70% of the points were randomly selected for model training and 30% were selected for model testing for analysis of the spatial accuracy of each model prediction (Phillips et al. 2006, Zutta & Rundel Reference Zutta and Rundel2017). The relative contribution (%) and permutation importance (%) of each predictive variable to the final predictive model were recorded (Table 1). These two measures indicate the importance of the predictive variable by indicating the amount of information each variable contributes to the final model (contribution %) and which variables contain information not present in the other variables for the model development (permutation importance %) (Bonilla-Bedoya et al. Reference Bonilla-Bedoya, Estrella-Bastidas, Molina and Herrera2018).
Table 1. Contribution (%) and permutation importance (%) of the variables to the model.
In order to facilitate the interpretation of the final logistic output format, a qualitative classification of deforestation risk is presented. The natural breaks classification method (Wang & Yang Reference Wang and Yang2000, Smith Reference Smith2015, Bonilla-Bedoya et al. Reference Bonilla-Bedoya, Estrella-Bastidas, Molina and Herrera2018) of the final output values was used to divide the output into five categories: very low (<9.9%), low (10.0–20.9%), medium (21.0–33.8%), high (33.9–48.2%) and very high (48.3–100%).
Model performance
Our study assessed model performance using the threshold-independent test of area under the receiver operating characteristic (ROC) curve (AUC) of the test localities. The ROC curve measures the model’s ability to correctly predict the presence and absence of the deforestation event by plotting the model sensitivity (omission rate) against 1 – specificity (commission rate). Pseudo-absences are generated by randomly selecting a set number of background pixels as a substitute for ‘true’ absence, which the algorithm does not use as an input variable (Phillips et al. Reference Phillips, Anderson and Schapire2006). For our study, the default of 10 000 background pixels was randomly chosen as the pseudo-absence for each model run. Consequently, the AUC statistic can be understood as the probability that a presence site of deforestation (i.e., pixel) is ranked above a random background pixel (Phillips et al. Reference Phillips, Anderson and Schapire2006). An AUC value for a model will range from 0 to 1.0, with values below 0.5 considered random, up to 1.0 as perfect discrimination. AUC data are presented as means ± SE (n = 10 models) following Phillips et al. (Reference Phillips, Anderson and Schapire2006) and Zutta and Rundel (Reference Zutta and Rundel2017).
Prior to the general model of deforestation risk with 19 years of information, the spatial and temporal transferability of the models were tested. Following the recommendations of Aguilar-Amuchastegui et al. (Reference Aguilar-Amuchastegui, Riveros and Forrest2014), deforestation data from 2001 to 2010 were partitioned as training information and then validated with deforestation from 2011 to 2019. Another pertinent aspect was to test spatial transferability; this tested whether a risk model of deforestation from one specific area could predict deforestation in another distant area. For this purpose, the training samples were divided into north and south regions of the Peruvian Amazon.
Model performance was also evaluated by overlaying the January to December 2020 early alerts for forest loss from GeoBosques (Vargas et al. Reference Vargas, Montalban and Leon2019) on the final risk model in order to ascertain the percentage of early alert pixels that were predicted in each deforestation risk category. The 2020 early alert data were not used in the development of the overall predictive model since it is developed through a different methodology.
Results
Historical deforestation
The Peruvian Amazon lost c. 24 334 km2 of forest from 2001 to 2019; this was c. 3.4% of the forest cover available in the year 2000, when there was more than 707 000 km2 of forest. The annual historical average during 2015–2019 was 1560 km2, compared to the years 2001–2014, which was 1181 km2. Recent forest loss has been centred on the San Martin and Loreto border (Fig. 1b) and the Madre de Dios regions (Fig. 1c). This can be compared with another hotspot of deforestation between the limits of Huanuco, Pasco and Ucayali, which collectively lost 8721 km2 of forest from 2001 to 2019. A total of 682 742 km2 of forest remained in the Peruvian Amazon at the end of 2019.

Fig. 1. Peruvian Amazon deforestation. (a) Accumulated deforestation from 2001 to 2019 and remaining forest cover. (b) Deforestation in the department of Loreto San Martin where most large-scale forest loss is due to recent agricultural expansion of oil palm. (c) Deforestation in southern Madre de Dios from a mix of artisanal gold mining and small-scale agriculture.
Deforestation risk
The average test AUC value for predictive models was 0.749 ± 0.003 and the average training AUC value was 0.747 ± 0.001, indicating reasonable success in discriminating forest loss from non-forest loss areas. Prediction values ranged from 0 to 0.722 and were divided into the five categories established by the natural breaks (Fig. 2). Buffer zones were more vulnerable to deforestation than protected areas (Tables 2 & 3).
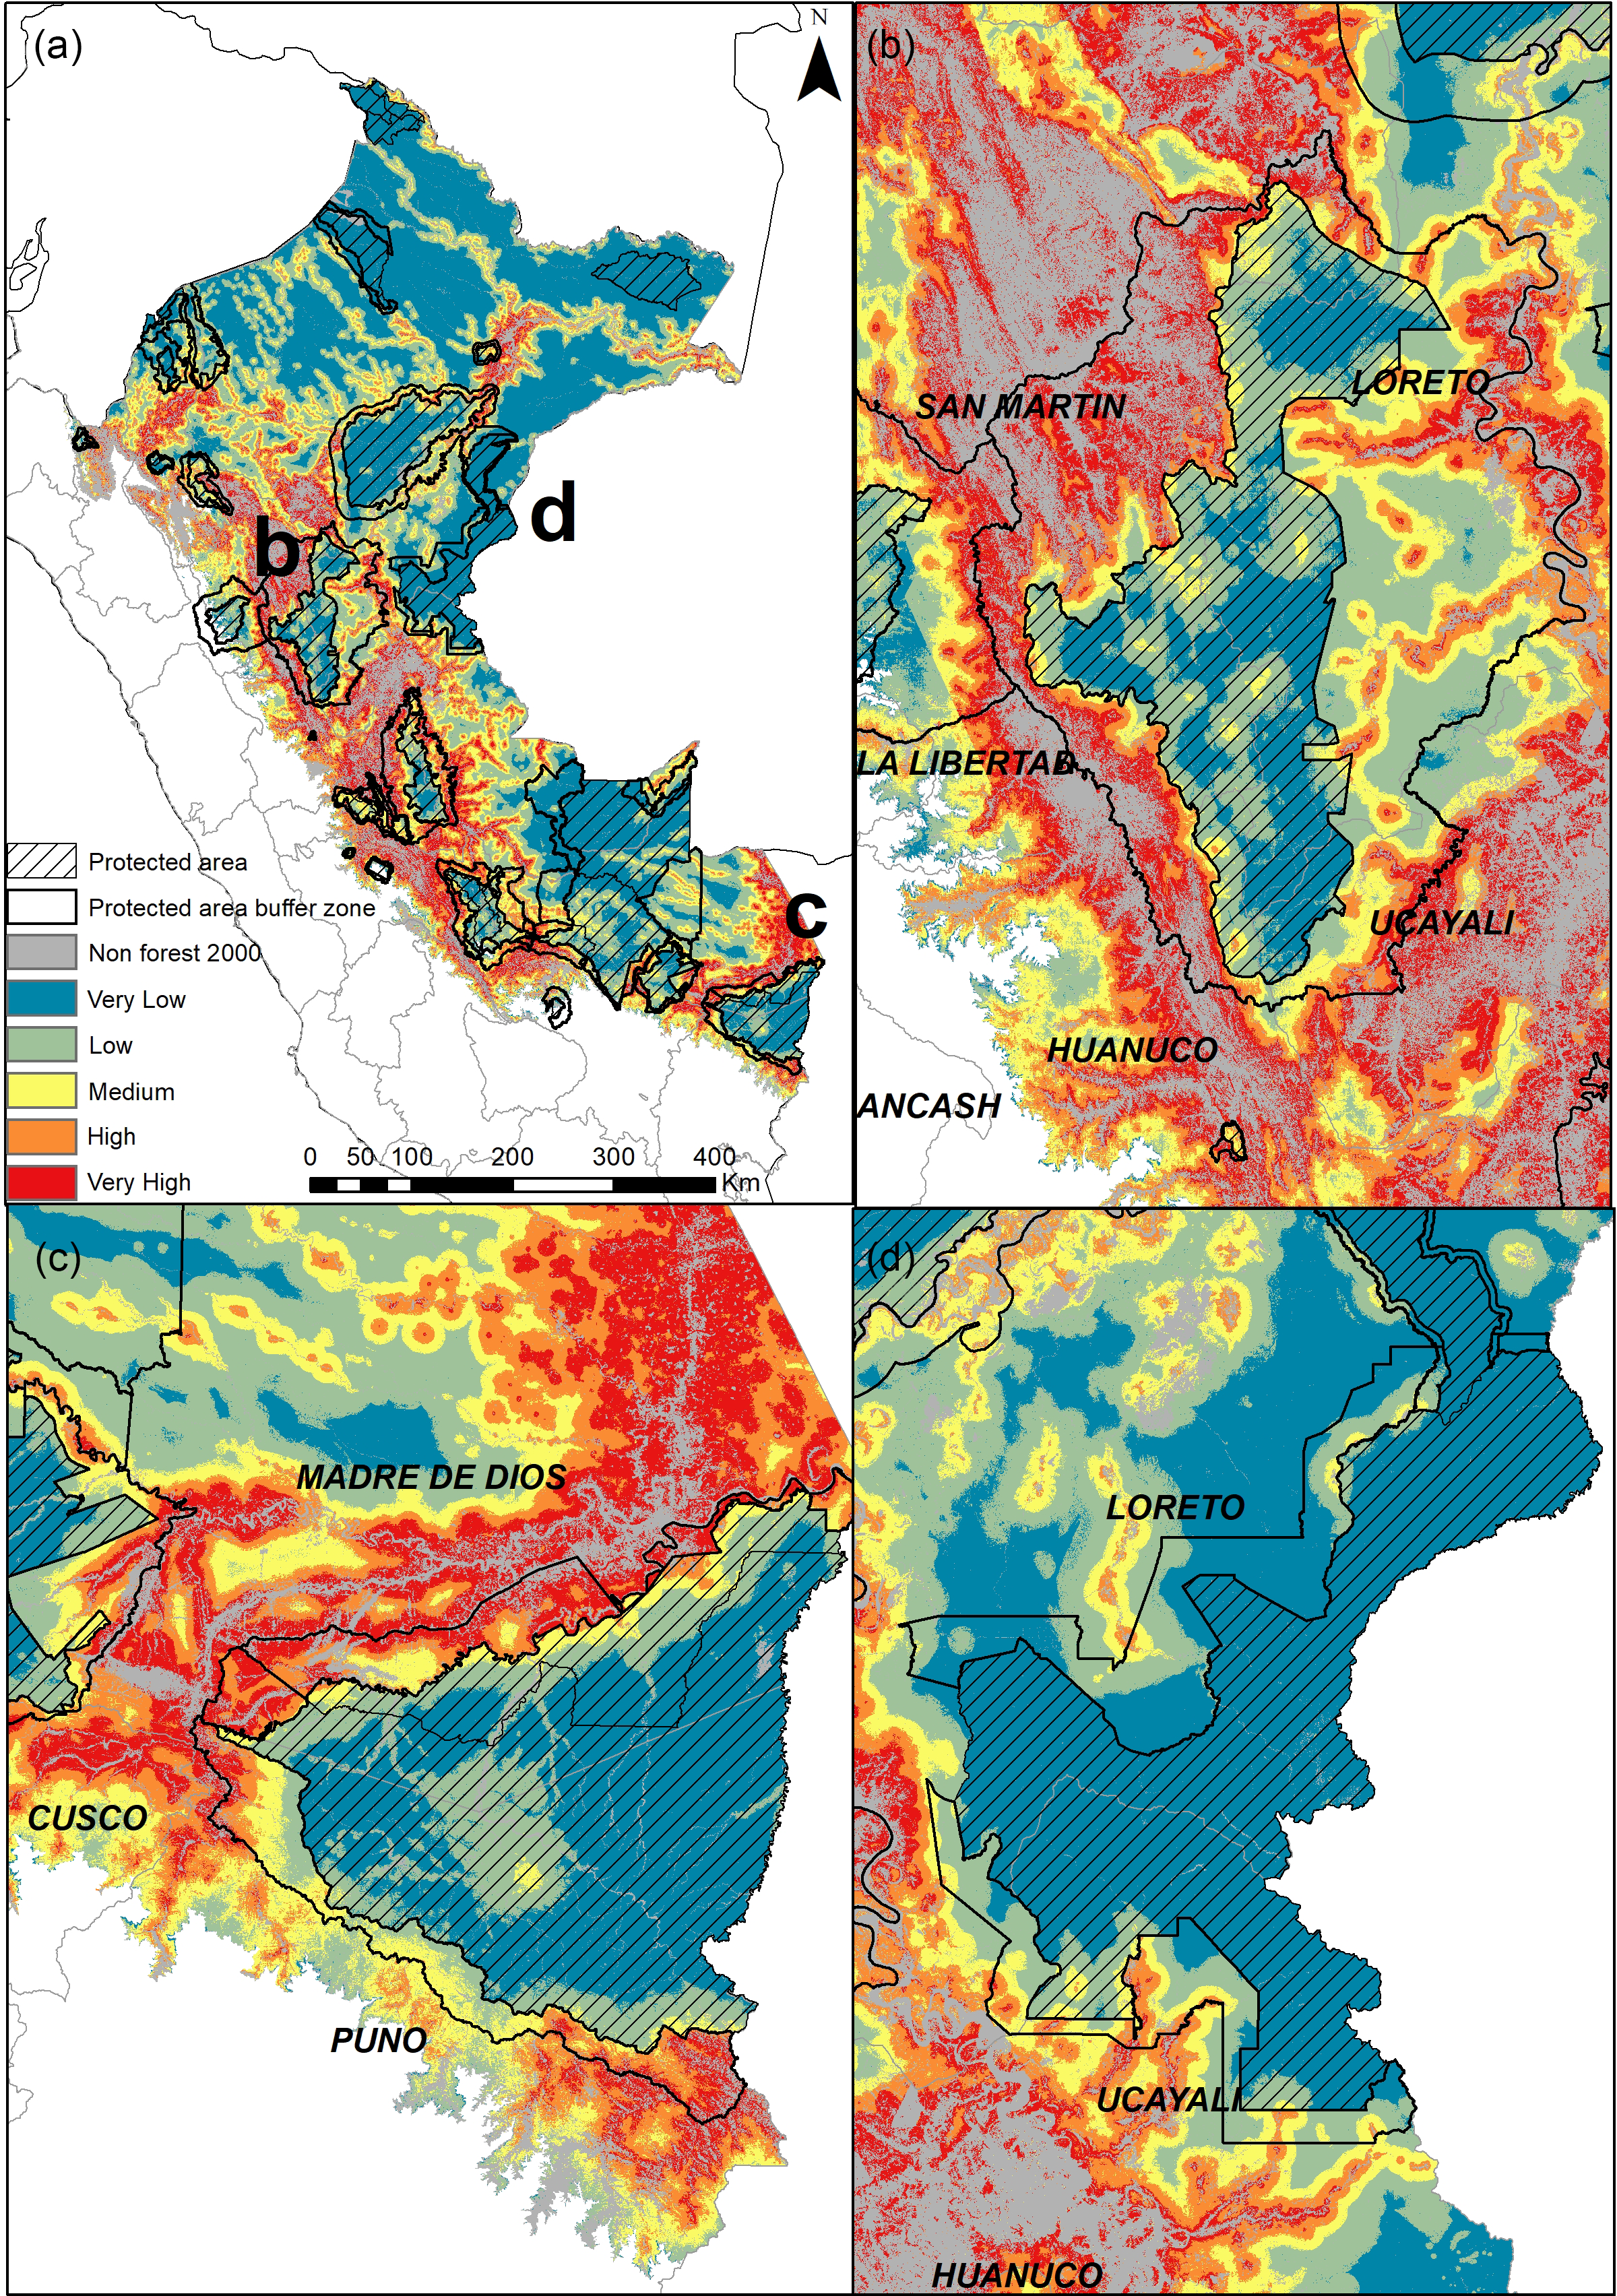
Fig. 2. Peruvian Amazon and five categories of deforestation risk. (a) Categories are based on the natural breaks classification of the final Maxent model for the entire Peruvian Amazon. Natural protected areas containing any amount of Amazon forest are filled with hatch marks and surrounded by their respective buffer zones. (b) Deforestation risk for the Cordillera Azul National Park. (c) The main artisanal gold mining region and interoceanic highway of southern Madre de Dios. (d) The Sierra del Divisor National Park.
Table 2. Forest cover in 2019, total forest loss from 2001 to 2019 and deforestation risk in natural protected areas in the Peruvian Amazon.
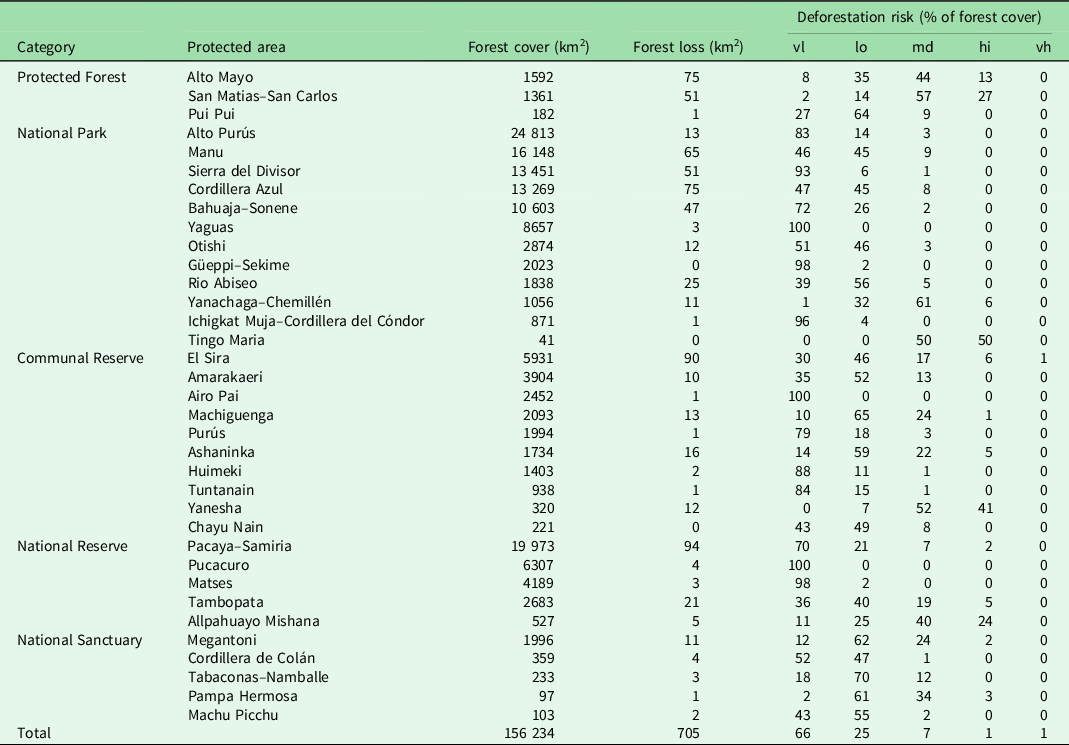
vl = very low; lo = low; md = medium; hi = high; vh = very high.
Table 3. Buffer zone forest cover in 2019, total forest loss from 2001 to 2019 and deforestation risk in natural protected areas in the Peruvian Amazon.
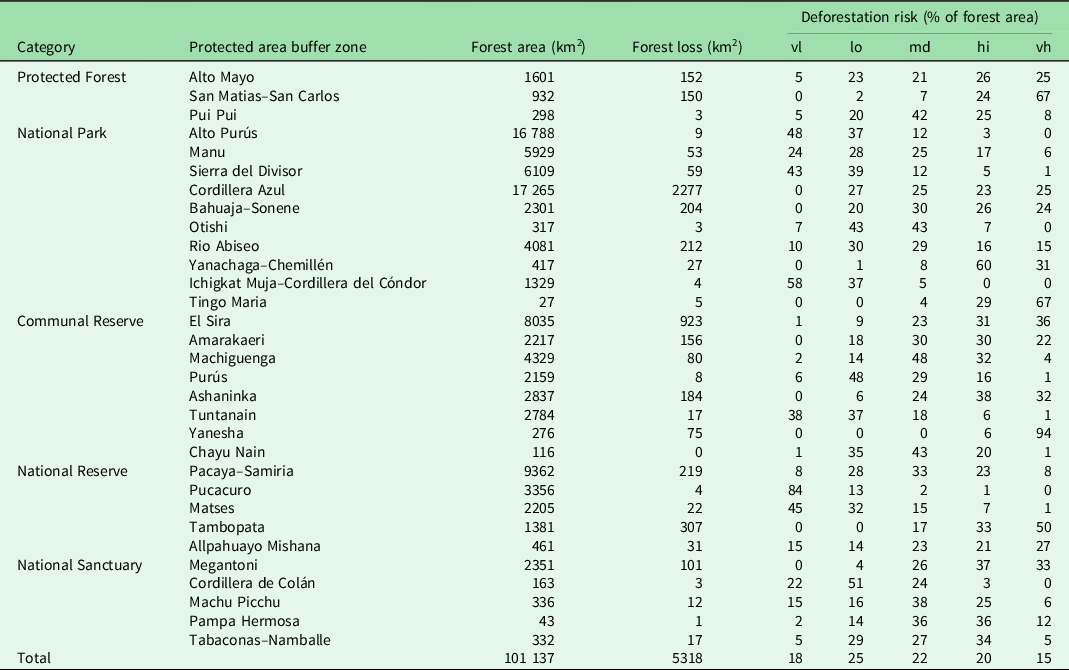
vl = very low; lo = low; md = medium; hi = high; vh = very high.
Generally, deforestation risk was highest near previously deforested areas (Fig. 2b–d). Forested areas, which are often fragmented forests surrounded by other land uses, within the higher-elevational zones of the eastern Andes contain the most area with high and very high deforestation risks (Fig. 2). The area next to the Interoceanic Highway and the area within the artisanal-scale gold mining region of Madre de Dios demonstrated a particularly consolidated area of elevated risk (Fig. 2c). Most very-low-risk areas were in Loreto, which has the largest expanse of forest cover (Fig. 2), the Southern Ucayali and western Madre de Dios region, which contains the Manu and Alto Purus national parks, and smaller pockets in the Loreto, San Martin and Ucayali intersection, which contains the Cordillera Azul National Park (Fig. 2b). In addition, an extensive very-low-risk area was in the southern Madre de Dios and northern Puno region, which contains the Tambopata National Reserve and Bahuaja–Sonene National Park (Fig. 2c).
Protected areas and buffer zones
The total forest cover in natural protected areas at the end of 2019 was 156 234 km2, with a total loss from 2001 to 2019 of 705 km2 (Table 2). Protected areas designated as national parks contained 61.2% of the total Amazonian forest cover within protected areas and registered 42.97% of the forest loss during this time. Protected areas within each category with the highest total forest loss from 2001 to 2019 (Table 2) included Alto Mayo (Protected Forest), Cordillera Azul (National Park), El Sira (Communal Reserve), Pacaya–Samiria (National Reserve) and Megantoni (National Sanctuary). The percentage of protected forests remaining in 2019 within the category of very low risk was 66%, low risk was 25%, medium risk was 7%, high risk was 1% and very high was 1%. A few protected areas had much larger areas with high risk of deforestation, notably San Matias–San Carlos (13%), Yanachaga–Chemillén (7%), Tingo Maria (50%), Yanesha (41%) and Allpahuayo Mishana (24%), which all have less than 1600 km2 of forest remaining.
This pattern is in contrast to the 31 buffer zones that contain Amazonian forests. The total forest cover at the end of 2019 was 101 137 km2, with a forest loss of 5318 km2, which is 7.6 times greater than within the protected areas (Table 3). The greatest total forest losses in 2001–2019 were in the buffer zones of the Cordillera Azul (2277 km2), El Sira (923 km2) and Tambopata (307 km2). Buffer zone forest remaining in 2019 had a higher predicted risk of deforestation within the categories of high risk (20 397 km2 or 20%) and very high risk (15 297 km2 or 15%).
Contribution of predictive variables
Distance from agricultural land and distance from roads contributed nearly 77.6% of the information necessary to predict deforestation (Table 1). Distance from pastureland and elevation contributed 10.1%, and the categorical variables of natural protected areas and native communities contributed 4.9% and 0.2%, respectively, to the final model. The remaining land covers, often directly associated with forest loss, distance from non-forest and distance from mining, contributed 4.0% and 1.7%, respectively, while slope and distance from rivers together contributed 1.6% to the final model.
The ranking of permutation importance followed a similar pattern to the contribution of each predictor variable to the final model (Table 1). Distance from agricultural land had the highest percentage contribution (40.5%), followed by distance from non-forest land, distance from roads and elevation, which combined had a permutation importance of 39.1%. The remaining continuous predictive variables – distance from mining, distance from pastureland, distance from rivers and slope – accounted for 12.4%. Natural protected areas and native communities had permutation importance values of 7.2% and 0.2%, respectively.
Temporal and spatial transferability
Regarding temporal transferability, the deforestation risk model using data from the years 2001–2010 registered 86.4% of the remaining forest in the high-risk and very-high-risk categories for 2011, followed by 82.7% and 80.3% in the same categories for 2012 and 2013, respectively. For 2018 and 2019, the model registered 72.5% and 63.1% of the remaining forest for the same categories (Fig. 3b). Logically, the models predicted a greater percentage of deforestation for the years closest to the last observation.

Fig. 3. Monthly early alert count in 2020. (a) The percentage of monthly early alerts that was registered under each deforestation risk category (very low, low, medium, high and very high). (b) Annual deforestation from 2011 to 2019 (%) recorded under each category of deforestation risk (very low, low, medium, high and very high).
The mean percentage (± SD) of monthly early alerts from January to December 2020 that were registered under the very high deforestation risk category was 44.7% (± 7.5%). More than 35% of monthly early alerts, except for in February, occurred in very-high-risk areas (Fig. 3a). Indeed, the mean percentage of monthly alerts that were registered as either high risk or very high risk was nearly 80%. The other risk categories were also fairly consistent throughout the year, with 15.4% ± 2.8% for medium risk, 8.7% ± 2.9% for low risk and 2.7% ± 1.1% for very low risk. The mean fractions of early alerts that registered as very high risk were also similar throughout the lows and peak of the deforestation season, with 41.1% ± 7.3% from January to June, when the number of alert counts were at their lowest, 44.3% ± 8.2% from July to September, the peak forest loss season, and 47.5% ± 8.0% from October to December, when the number of alerts returned to pre-peak levels.
There was far less predictive ability when deforestation localities were divided into north and south regions. Northern deforestation could only predict less than 10% for the mean, high-risk and very-high-risk categories for the southern half of the Peruvian Amazon. Similarly, southern deforestation models could only predict less than 5% of these categories in the northern half of the Peruvian Amazon.
Discussion
Here, we leveraged 19 years of annual, high-spatial-resolution deforestation data, with high-spatial-resolution predictor variables, representing drivers of deforestation, within an open-source, machine learning SDM framework to produce a robust deforestation risk model for the Peruvian Amazon. In addition, we were able to test the temporal transferability of the methodology, similar to testing and training forest loss data from different periods in Aguilar-Amuchastegui et al. (Reference Aguilar-Amuchastegui, Riveros and Forrest2014), and we tested spatial transferability by using test and training datasets from different Peruvian Amazon regions, which has not been explored in other studies. We were also able to test the risk model accuracy using data from an independent, high-temporal-cadence monitoring system (i.e., early alerts).
The approach provided a clear, geospatially explicit correlation between deforestation and distance from agricultural land and roads. Other studies that have applied Maxent to the Ecuadorian (Bonilla-Bedoya et al. Reference Bonilla-Bedoya, Estrella-Bastidas, Molina and Herrera2018) and the Brazilian Amazon (de Souza & De Marco Reference de Souza and De Marco2018), at different spatial and temporal resolutions from our study, could identify similar sets of variables that describe most of the deforestation modelled in their region. Maxent, as a predictive modelling tool option, provides several advantages over other predictive modelling tools, including the availability of graphical user interface (GUI) and open-source versions (Phillips Reference Phillips2017), its relative ease of implementation (Aguilar-Amuchastegui et al. Reference Aguilar-Amuchastegui, Riveros and Forrest2014), its lack of requirement for presence and absence data where true absence can be difficult to confirm (Philips Reference Phillips2006), its provision of accurate predictions with relatively few presence data and high computing efficiency and its ability to enable the use of large-scale high-resolution data layers (Buermann et al. Reference Buermann, Saatchi, Smith, Zutta, Chaves, Milá and Graham2008).
Distance from agricultural land and distance from roads were the key predictors of deforestation in the Peruvian Amazon. Agricultural expansion in the past 19 years has been driven by a complex interaction of periodic immigration from Andean and inter-Amazonian regions, changes in commodity and gold prices, the expansion of industrial agriculture (most often from oil palm production) and a variety of other factors (Menton & Cronkleton Reference Menton and Cronkleton2019). Artisanal-scale gold mining in Madre de Dios has a particularly devastating impact at the local scale and has increased dramatically since 2011, but it has not had the overall impact of small- to medium-scale agriculture. Conversion of forest to pastureland is a major factor in deforestation in the eastern portion of Madre de Dios in the area that is closest to the Brazilian state of Acre, and it shares similar conditions for cattle ranching; this driver is particular to this region and is not as prevalent in other Amazonian regions of Peru. Rivers are an important form of transportation and are thought to be as important a driver of deforestation as roads, as they represent important transportation hubs in many of these regions where roads and connectivity to towns are limited (Bax et al. Reference Bax, Francesconi and Quintero2016). However, the model’s outputs reflect that previous deforestation contributed most to predicting future deforestation as these deforested areas will be nearer to the next expansion of forest removal.
The distance from native communities, although important for conservation priorities, was not a significant contributor to the deforestation risk model. This is probably due to the encroachment on forest that is currently occurring within native communities, most often due to illegal selective logging and other deforestation activities. According to national statistics, native communities contained the second highest amount of forest loss in 2019 below untitled lands, accounting for almost 300 km2 or 19% of the total deforestation in that year (MINAM 2020). Therefore, the native community boundaries do not represent as concrete a deterrent to deforestation as national park boundaries. Peruvian naturally protected areas were among the least deforested of all the land tenure categories monitored by the Peruvian government from 2001 to 2019, with over 30 km2 or 2.1% of the total Amazonian deforestation in 2019 (MINAM 2020). The deforestation patterns currently seen are in response to the location and ability of national and local authorities to limit deforestation in many of these protected areas.
In order to fully apply Maxent as an approach for predicting risk, we need to address key factors that may limit the overall accuracy of the models. First, the accuracy of the predictive model will be dependent on the quality of the point locality data, or in this case the forest loss locations, which are derived from satellite data. Frequent cloud cover, rough topography and availability of Landsat images may affect the number of pixels available for the final annual deforestation estimation (Potapov et al. Reference Potapov2014). It is therefore possible that deforestation that is not identified in a given year is counted in a subsequent year, when quality pixels become available. In addition, the quality of the predictor variables, including the accuracy of road maps and the correct identification of land cover, may play a role in increasing the accuracy of the predictive model.
Conclusion
Using open-source machine learning algorithms to identify areas of moderate to high risk for deforestation can ultimately help to reduce deforestation in tropical forests. The approach is simple and easy to use and interpret for a wide range of end users, from technical experts who wish for a relatively quick risk assessment of large areas to less technical users wanting to explore deforestation risk using a reliable and robust approach. To the best of our knowledge, this is the first study of deforestation risk using 19 years of historical annual data for the entire Peruvian Amazon. Indeed, the large dataset and high spatial resolution require higher-end computational power, which points to developing a more interactive platform to reach an even wider audience interested in exploring deforestation risk due to the alarming recent increase in forest loss in rainforests across the tropics. The potential of this approach is highlighted by a static version of this risk model hosted by the National Forest Conservation Program for Climate Change Mitigation (PNCBMCC-MINAM) of the Peruvian Ministry of the Environment (http://geobosques.minam.gob.pe/geobosque/visor).
Supplementary material
To view supplementary material for this article, please visit https://doi.org/10.1017/S0376892921000291.
Acknowledgements
We would like to thank Craig Wayson from SilvaCarbon, Monica Romo from USAID and Daniel Castillo from PNCBMCC-MINAM.
Financial support
The project was supported by USAID and the US Government inter-agency program SilvaCarbon.
Conflict of interest
None.
Ethical standards
None.


 Open access