


Flavonoids represent a structurally diverse group of polyphenolic compounds which are synthesised during plant metabolism( Reference Robards, Prenzler and Tucker 1 ) and are present in many commonly consumed foods( Reference Beecher 2 ). Particular fruits and vegetables, such as blueberries, apples, spinach and onions are considered rich sources of flavonoids. So too are beverages, such as tea and red wine( Reference Bhagwat, Haytowitz and Holden 3 ).
Meta-analyses have shown that consumption of flavonoid-rich foods are associated with reduced risk of cause-specific mortalities such as those attributable to cancer, diabetes and CVD( Reference Sun, Yuan and Koh 4 – Reference Wang, Zhou and Wang 7 ). Much of the beneficial effects of these foods have been attributed to their high content of biologically active flavonoids, which have been shown to improve nitric oxide homoeostasis and endothelial function, and reduce platelet aggregation and oxidative stress( Reference Ishige, Schubert and Sagara 8 – Reference Hodgson, Burke and Puddey 13 ). Flavonoids are also thought to play roles in inactivating carcinogens, inducing antiproliferation, cell cycle arrest and apoptosis, and inhibiting angiogenesis( Reference Chahar, Sharma and Dobhal 14 ).
Despite this growing evidence for reduced risk of specific cancer and CVD mortalities associated with consumption of flavonoid-rich foods, the relationship of flavonoid-rich food and flavonoid-compound intake with risk of all-cause mortality is less clear. Following the advent of the comprehensive US Department of Agriculture flavonoid-class food content database in 2007( 15 ), the few studies exploring the relation of flavonoid intake with all-cause mortality have yielded inconsistent patterns of association, likely due to insufficient sample size, limited variation in intake or incomplete food composition table( Reference Ivey, Hodgson and Croft 16 – Reference Zamora-Ros, Jiménez and Cleries 18 ).
The varying levels of flavonoid-class intake and different patterns of flavonoid-class intake across countries( Reference Zamora-Ros, Knaze and Luján-Barroso 19 ) have also likely contributed to the lack of clarity regarding the relationship between flavonoid-compound intake and risk of all-cause mortality in the population. Furthermore, the role that the whole food, as distinct from the isolated food constituent, plays in the relationship with all-cause mortality is yet to be elucidated. We have recently shown that a higher intake of total flavonoids, as well as individual flavonoid classes, was associated with lower risk of CVD, cancer and all-cause mortality in elderly, postmenopausal women( Reference Ivey, Hodgson and Croft 16 ). Therefore, this study sought to explore the relationship between the consumption of flavonoid-rich foods, and flavonoid compounds, and the risk of all-cause mortality in a cohort of young and middle-aged US women.
Methods
Participants
In 1989, 116 430 women aged between 25 and 42 years, were enrolled into the Nurses’ Health Study II. Baseline for this analysis was 1991, where 93 145 participants had complete dietary intake data and were free of previous myocardial infarction, angina, stroke and cancer. The institutional review board at Brigham and Women’s Hospital reviewed and approved this study, and participants provided implied consent by virtue of questionnaire return.
Mortality ascertainment
Mortality incidence were identified through reports from family members and postal authorities, allowing ascertainment of an estimated 98 % or more of all deaths( Reference Rich-Edwards, Corsano and Stampfer 20 ). Further mortality cases were identified through the National Death Index. Using data from death certificates and medical records, a physician blinded to exposure intake classified causes of mortality according to the eighth and ninth revisions of the International Classification of Diseases (ICD)( Reference Slee 21 , Reference Moriyama 22 ).
Deaths attributable to CVD were defined using the ICD8 codes 390-458 (ICD9 390-459) and cancer mortalities were those with ICD8 codes ranging from 140 to 207 (ICD9 140-208). The other-cause mortality variable refers to all mortalities not attributable to CVD or cancer based on ICD8 codes.
Dietary intake assessment
At baseline (1991) and every subsequent 4 years until 2007, participants completed a semi-quantitative FFQ. From this, habitual daily intake, in mg/d, of total-flavonoids and flavonoid classes was estimated using previously described methods( Reference Willett, Sampson and Stampfer 23 ). Flavonoid classes in this analysis include: (i) flavonols; (ii) flavan-3-ols (including catechins and epicatechins, and excluding proanthocyanidins); (iii) proanthocyanidins; (iv) flavones; (v) flavanones; and (vi) anthocyanins. Frequency of consumption of flavonoid-rich foods were recorded as number of servings per day, week or month( Reference Cassidy, O’Reilly and Kay 24 ).
As an indicator of adherence to a healthy dietary pattern, the Alternative Healthy Eating Index score was calculated using methods previously described( Reference McCullough and Willett 25 ).
In order to reflect long-term dietary intake, and to minimise effects of within-person variation, flavonoid exposure was considered the cumulative average of flavonoid intake, updated with every 4-year FFQ return. To account for potential alterations in dietary patterns following a major illness diagnosis, the primary flavonoid exposure was computed by suspending dietary intake updates following reported diagnoses of stroke, heart disease, angina, or cancer, although follow-up continued until death or the end of the study period at 2009.
Risk factor assessment
At baseline, and every 2 years thereafter, participants completed questionnaires on lifestyle, medical conditions, medications and family medical history.
Statistical analysis
Analyses for habitual consumption of flavonoid-rich foods based on categories of consumption from the FFQ; ranging from non-consumers to frequent consumers, as defined as consuming the food more than once per week. Exposure of total-flavonoid or flavonoid-class consumption was divided into quintiles. Hazard ratios and 95 % CI for risk of all-cause, and cause-specific, mortalities were estimated using age-adjusted and multivariable-adjusted Cox proportional-hazards models. P values for trend were calculated with the use of the Wald test of a score variable based on the median consumption level for each quintile of flavonoid consumption.
The multivariable-adjusted model included age, BMI, smoking status, menopausal status, family history of diabetes/cancer/myocardial infarction, multivitamin supplement use, aspirin use, race, type 2 diabetes, hypercholesterolaemia, hypertension, physical activity, alcohol consumption and energy intake. The multivariable plus diet-adjusted model incorporated the multivariable-adjusted model plus the Alternative Healthy Eating Index (minus alcohol) score( Reference Chiuve, Fung and Rimm 26 ).
For sensitivity analyses, baseline flavonoid intake and unrestricted cumulative average flavonoid intake, where updates continued until death or end of study irrespective of chronic disease diagnosis, were also computed. To address the concern that occult chronic diseases in the years that preceded diagnosis may have influenced dietary intake, we excluded the first 2 years of follow-up data and added a 2-year lag period between flavonoid-intake assessment and each follow-up period.
We conducted several additional sensitivity analyses to assess the robustness of the results. To minimise the influence of smoking or an extremely low or high BMI on the results, we excluded participants who had ever smoked or who had a BMI of <18·5 or >40 kg/m2. We also excluded participants who had diabetes at baseline, and we suspended updating of dietary variables after a diagnosis of diabetes during study follow-up.
Analyses were performed with the SAS statistical package (version 9·3; SAS Institute Inc.). Statistical tests were two-sided, and P values of <0·05 were considered to indicate statistical significance.
Results
Cohort characteristics
At baseline, the mean age of participants was 36·1 (sd 4·7) years, with a mean BMI of 24·6 (sd 5·3) kg/m2. Over the 18-year (1 838 904 person-year) follow-up, there were 1894 deaths. Cancer was the leading cause of mortality in this cohort, accounting for 47 % (n 887) of all deaths. CVD contributed 10 % (n 189) to all follow-up mortalities, and the remaining 818 (43 %) mortalities comprised the other-cause mortality group. The majority of other-cause mortalities were due to infections (n 182, ICD8 000-136), diseases of other endocrine glands (n 192, ICD8 250-258) and diseases of the nervous system (n 315, ICD8 320-358).
Mean daily total-flavonoid consumption was 379 (sd 374) mg. proanthocyanidins contribute 57 %, and flavan-3-ols 28 %, to total-flavonoid intake (Table 1).
Table 1 Baseline total-flavonoid and flavonoid-class consumption, and frequency of consumption of major whole food contributorsFootnote * (Mean values and standard deviations; n 93 145)
* Results are energy adjusted.
† Includes both fresh fruit and juice products.
Participants were similar in terms of baseline risk factors across all levels of total-flavonoid consumption. However, high flavonoid consumers were more physically active and were less likely to be current smokers at baseline (Table 2).
Table 2 Baseline characteristics of the cohort stratified by quintiles of total-flavonoid consumptionFootnote * (Mean values and standard deviations; percentages)
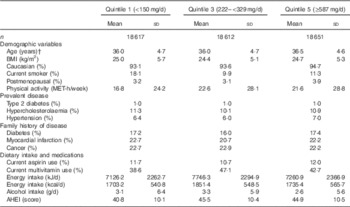
MET, metabolic equivalent; AHEI, Alternative Healthy Eating Index (excluding alcohol) score.
* Values standardized to the age distribution of the study population. Flavonoid consumption is standardised to total energy intake. n 93 145.
† Value is not age adjusted.
Flavonoid-rich foods and risk of all-cause and cause-specific mortality
We explored potential whole-food contributors by analysing foods rich in the flavonoid classes (Fig. 1). Frequent consumption of blueberries, strawberries, apples, peppers, red wine and tea were all significantly inversely associated with risk of all-cause mortality in age-adjusted, multivariable-adjusted and multivariable-plus-diet-adjusted models. When compared with non-consumers, frequent tea and red wine consumption showed the greatest magnitude of reduction in risk. Conversely, when compared with infrequent consumers, risk of all-cause mortality was greater in participants with frequent grapefruit consumption. Continuing to update of intake irrespective of chronic disease diagnosis did not substantially impact results, and results were similar in all sensitivity analyses.
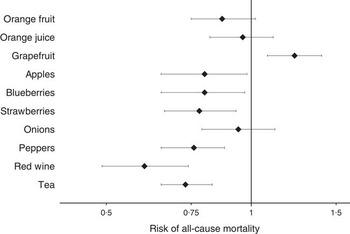
Fig. 1 Multivariable-adjusted risk of all-cause mortality by flavonoid-rich foods, comparing non-consumers (referent group) with frequent consumers (more than once per week). Values are hazards ratios and 95 % CI. Multivariable-adjusted model includes: age, BMI, smoking status, menopausal status, family history of diabetes, cancer and myocardial infarction, multivitamin supplement use, Aspirin use, race, type 2 diabetes, hypercholesterolaemia, hypertension, physical activity, energy intake, alcohol consumption and the Alternative Healthy Eating Index (minus alcohol) score. The person-years (non-consumers, frequent consumers) for each of the food items are as follows: orange fruit (310 336, 452 010); orange juice (231 916, 916 036); grapefruit (725 397, 329 583); apples (100 840, 974 249); blueberries (868 779, 110 744); strawberries (221 774, 350 689); onions (168 378, 499 571); peppers (320 691, 501 045); tea (353 257, 1 067 188); red wine (1 181 732, 150 932). Total number of all-cause mortalities is 1894.
In cause-specific age and multivariable-adjusted analyses (Table 3), when compared with non-consumers, the benefit of frequent blueberry and strawberry consumption was restricted to cancer mortality, and the benefit of peppers restricted to mortalities from other causes.
Table 3 Multivariable-adjusted risk of mortality subtypes by flavonoid-rich foods, comparing non-consumers (referent group) with frequent consumers (more than once per week) (Hazard ratios (HR) and 95 % confidence intervals; n 93 145)
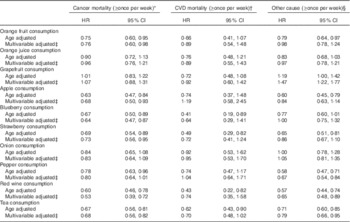
* Total number of cancer mortalities is 887.
† Total number of CVD mortalities is 189.
‡ Multivariable adjusted model includes: age, BMI, smoking status, menopausal status, family history of diabetes, cancer and myocardial infarction, multivitamin supplement use, Aspirin use, race, type 2 diabetes, hypercholesterolaemia, hypertension, physical activity, energy intake, alcohol consumption and the Alternative Health Eating Index (minus alcohol) score.
§ Total number of mortalities from other causes is 818.
Although not associated with all-cause mortality, frequent orange fruit consumers were at reduced risk of cancer and other-cause mortalities, respectively. Congruent with the all-cause mortality results, we observed that frequent grapefruit consumers were at increased risk of mortalities from other causes.
Both red wine and tea showed the greatest magnitude of benefit in the all-cause mortality analyses. Specifically, in the multivariable-adjusted model, when compared with the non-consumers, the relative risk of all-cause mortality for frequent consumers of red wine and tea (more than once per week) was 0·60 (95 % CI 0·49, 0·74) and 0·73 (95 % CI 0·65, 0·83), respectively. When looking at cause-specific mortalities, frequent consumption of red wine and tea was associated with reduced risk of both cancer and other-cause mortalities, in both age-adjusted and multivariable-adjusted models. Results were not significantly altered in sensitivity analyses.
Flavonoid compounds and risk of all-cause and cause-specific mortality
In age-adjusted models, participants in the highest quintile of total-flavonoid consumption were 19 % (7–29 %) less likely to have died in the 18-year follow-up period, when compared with those in the lowest quintile (Table 4). Similar beneficial associations were observed with increased consumption of flavan-3-ols, flavonols, flavones, proanthocyanidins and anthocyanins, however, relationships were attenuated and no longer statistically significant following multivariable adjustment. Despite multivariable adjustment substantially attenuating the relationships for proanthocyanidins and anthocyanidins, no one factor in the multivariable-adjusted model was responsible for attenuation of the findings. Results were not significantly altered in sensitivity analyses.
Table 4 Association of quintiles of total-flavonoid and flavonoid-class consumption with risk of all-cause mortality (Hazard ratios (HR) and 95 % confidence intervals; n 93 145)
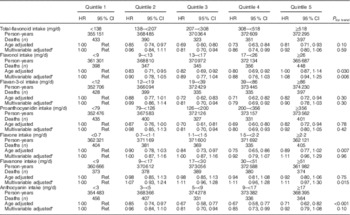
Ref., referent values.
* Multivariable adjusted model includes: age, BMI, smoking status, menopausal status, family history of diabetes, cancer and myocardial infarction, multivitamin supplement use, Aspirin use, race, type 2 diabetes, hypercholesterolaemia, hypertension, physical activity, energy intake, alcohol consumption and the Alternative Health Eating Index (minus alcohol) score.
We then examined the relation of individual flavonoid classes with cause-specific mortality. In age-adjusted models, when compared with the lowest quintile, participants in the highest quintile of anthocyanin intake were at lower risk of mortality from cancer, CVD and other causes. This beneficial association remained for cancer mortalities following multivariable adjustment (Table 5). Flavan-3-ols and proanthocyanidins followed a similar inverse pattern, whereas flavonols, flavanones and flavones showed no association in either the unadjusted or multivariable-adjusted models, with any of the mortality types.
Table 5 Multivariable-adjusted risk of mortality subtypes by total flavonoid and flavonoid class, comparing participants in the lowest quintile of flavonoid intake (referent group) with those in the highest quintile (Hazard ratios (HR) and 95 % confidence intervals; n 93 145)
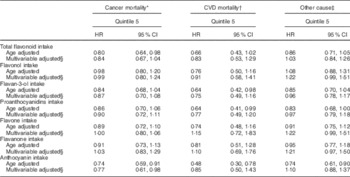
* Total number of cancer mortalities is 887.
† Total number of CVD mortalities is 189.
‡ Total number of mortalities from other causes is 818.
§ Multivariable adjusted model includes: age, BMI, smoking status, menopausal status, family history of diabetes, cancer and myocardial infarction, multivitamin supplement use, Aspirin use, race, type 2 diabetes, hypercholesterolaemia, hypertension, physical activity, energy intake, alcohol consumption and the Alternative Health Eating Index (minus alcohol) score.
Discussion
This prospective cohort study of middle-aged US women found that participants with higher intakes of specific flavonoid-rich foods, namely blueberries, strawberries, peppers, red wine and tea, were associated with reduced risk of all-cause mortality. When exploring contributors to these relationships, the association with all-cause mortality appeared to be largely driven by mortalities from cancer, as well as other causes. These beneficial relations did not extend to the other flavonoid-rich foods, or intakes of flavonoid compounds.
Despite null associations at a compound level, numerous significant associations with all-cause mortality were observed for many flavonoid-rich foods. Our finding of a null association of total-flavonoid intake with risk of all-cause mortality in US women is congruent with the Iowa Womens’ Health Study( Reference Mink, Scrafford and Barraj 17 ). However, in our previous analysis in Australian women( Reference Ivey, Hodgson and Croft 16 ) we observed a strong relation between increased total-flavonoid intake and reduced risk of all-cause mortality. This incongruence in findings between studies, and the differences we observed in associations with compounds and whole foods, is likely explained by the complexity of flavonoid-intake assessment and regional differences in the compositional variation in the whole food sources of dietary flavonoids( Reference Zamora-Ros, Knaze and Luján-Barroso 19 ), which in turn shapes the pattern of over 4000 different flavonoid compounds consumed on a daily basis( Reference Cook and Samman 27 ).
When looking at whole-food associations, we observed that increased consumption of blueberries, strawberries, peppers, red wine and tea was associated with reduced risk of all-cause mortality. These associations remained after adjusting for dietary pattern, suggesting that the relations are not explained by their contribution to a healthy dietary pattern. Furthermore, our results are supported by clinical trial data showing effects of these foods in improving endothelial function, nitric oxide status, blood pressure and platelet function, and by reducing oxidative stress and inflammation( Reference Riso, Klimis-Zacas and Del Bo 28 – Reference Spiller, Alves and Vieira 32 ). The strongest beneficial relation with all-cause mortality was observed with the frequency of red wine consumption, which remained even after adjusting for total alcohol consumption, which has been shown to be a strong predictor of all-cause mortality( Reference Di Castelnuovo, Costanzo and Bagnardi 33 ). When looking at cause-specific mortalities, the strongest associations for with red wine were observed with reduced risk of cancer and other-cause mortalities, in both unadjusted and multivariate-adjusted models. The lack of beneficial association with CVD may be due to the cohort characteristics itself, namely the low CVD mortality rate in this middle-aged female population.
In contrast to the beneficial whole foods listed above, which are rich sources of flavan-3-ols, proanthocyanidins and anthocyanins, the foods rich in flavanones showed markedly different results. Oranges showed no association with all-cause mortality, and grapefruit had a small positive association with all-cause mortality. This inverse association may be due to the contribution of sugar-rich juices to total grapefruit intake. Furthermore, this detrimental association may also be explained by be due to the findings that grapefruit components have clinically significant interactions with drugs, which appear to be independent of their flavonoid content( Reference Huang, Hall and Watkins 34 ). However, this hypotheses were unable to be explored in this cohort.
We observed that flavonoid-rich whole foods, and not flavonoid subclasses, showed the strongest associations with risk of all-cause mortality. Although not reaching statistical significance, many of the flavonoid subclasses followed similar trends to that of their predominant whole food constituents. For example, the positive and null associations of flavanone-rich grapefruit and oranges, respectively, were reflected in a non-significant trend in the multivariate-adjusted model whereby high flavanone consumers tended to have higher mortality rates. Conversely, the beneficial associations of anthocyanin-rich blueberries and strawberries was reflected in a no-significant observed trend high anthocyanin consumers tended to have lower mortality rates. The role of the whole-food in influencing relationships has not yet been fully elucidated, and results from the literature are conflicting. In understanding the strength of association differences at a whole food level as opposed to a compound level, it is important to note that flavonoid-intake estimates are derived from intake data for many different individual food items, the majority of which were not included in our study, which only looked at foods which contribute substantially to flavonoid-class intake. The importance of whole foods, as opposed to isolated nutrients, are becoming increasingly recognised for public health guidelines and dietary recommendations( Reference Mozaffarian and Ludwig 35 ).
Although results were not substantially altered by conducting sensitivity analyses, such as the lag analyses, it is important to note that causality of observed relationships cannot be established due to the observational nature of the study. Also, despite the inclusion of dietary and lifestyle factors into statistical models, residual or unmeasured confounders cannot be ruled out. Identification of causality is further limited by the complexity associated with assessing food composition and dietary intake including for flavonoids( Reference Ivey, Croft and Prince 36 ), which further highlights the importance of conducting both nutrient-based and whole-food-based analyses.
In summary, in this prospective cohort study of female US nurses, we found a beneficial relationship between the dietary intake of select whole-food sources of flavonoids and risk of mortality. Specifically, frequent consumption of blueberries, strawberries, peppers, red wine and was associated with reduced risk of all-cause mortality. These beneficial associations did not extend to total-flavonoids or flavonoid subclasses, and when considering the literature as a whole, future prospective association studies are warranted.
Acknowledgements
The authors would like to thank the participants and staff of the Nurses’ Health Study II for their valuable contributions as well as the following state cancer registries for their help: AL, AZ, AR, CA, CO, CT, DE, FL, GA, ID, IL, IN, IA, KY, LA, ME, MD, MA, MI, NE, NH, NJ, NY, NC, ND, OH, OK, OR, PA, RI, SC, TN, TX, VA, WA, WY. The authors assume full responsibility for analyses and interpretation of these data.
Components of the Nurses’ Health Study 2 were supported by the following National Institute of Health Grants: UM1 CA176726 and R01 CA67262. The Salary of K. L. I. was supported by a National Health and Medical Research Council Early Career Fellowship. E. B. R., K. L. I. and A. C. received funds from the US Highbush Blueberry Research Council, for activities unrelated to this research paper.
All authors were responsible for either drafting of the work or revising it critically for important intellectual content, and provided final approval of the version to be published. K. L. I., A. H. E. and E. B. R. made substantial contributions to conception or design of the work, or the acquisition, analysis or interpretation of data for the work.
None of the authors has any conflicts of interest to declare.


