


Introduction
The Qinghai-Tibetan (QT) Plateau, China, with an average altitude of over 4500m, is a region suggested to be potentially sensitive to the anticipated global warming of the next century (Reference Hansen and Lebedeff.Hansen and others, 1988). Reference ThompsonThompson and others (1989) and Reference Thompson, Bradley and JonesThompson (1992) reported that δ 18O values from the Dunde Ice Cap have been much less negative during the last 60 years. The decades with the lightest values are the 1940s. 1950s and 1980s, and the most recent 50year average is nearly unprecedented in the Holocene. The only comparable δ 18O values are for the Holocene maximum, 6000 8000 BP. According to these data, it appears that atmospheric climatic warming is occurring here. This paper reports new cryospheric observations, based on recent studies on the QT Plateau, which indicate dramatic warming here.
Evidence from Ice Cores
The best temperature proxies from ice cores are δ 18O and δD, but here only δ 18O is discussed. Since 1991, there has been a concerted effort to determine whether there is a positive correlation between the δ 18O of precipitation (snow and rain) and contemporaneous air temperatures. To investigate this, samples were collected spatially and temporally. The longest record for these collections and analyses is near the Dunde Ice Cap (Fig. 1), at the Delingha Meteorological Station. Here samples were collected from each snow- or rainfall event, and air temperatures recorded at the beginning and end of each precipitation event. Figure 2 shows the seasonal fluctuations of δ 18O and air temperature from 1991 to 1993 at the Delingha Meteorological Station. The monthly values are averages of all the samples collected for that month. δ 18O was measured with a Finnegan Mat-252 with an accuracy of 0.05‰, and air temperatures are for the beginning of each precipitation event.

Fig. 1. Locations of ice core and δ 18O sampling on the Qinghai-Tibelan Plateau.

Fig. 2. Seasonal fluctuations of the δ 18O of precipitation collected and of concomitant air temperatures at the Delingha Meteorological Station.
Roughly 80% of the annual precipitation on the QT Plateau falls in summer, and thus fewer samples were collected during winter and many more during summer. Occasionally, there was an entire winter month during which no precipitation fell. Obviously, for this month there are no data (Fig. 2). The results (Fig. 2) indicate very good correspondence between the seasonal fluctuations of δ 18O and of air temperature.
Figure 3 illustrates the relationship between δ 18O and air temperature for all the samples collected from 1991 to 1993. In 1992, based upon a limited number of samples, Reference Yao and Thompson.Yao and Thompson (1992) suggested that a linear relationship existed between δ 18O and air temperature. The additional data presented here confirm this earlier conclusion. Using a slope of 0.66 (Fig. 3) allows an estimation that an increase (or decrease) of 1‰ in δ 18O corresponds to an increase (or decrease) of 1.5°C in air temperature. In other words, an increase (or decrease) of 1°C corresponds to an increase (or decrease) of 0.66‰ in δ 18O. Efforts are continuing to establish the nature of the relationship between annually averaged air temperature and δ 18O. Hopefully, several more years of sampling will make this possible.

Fig. 3. The relationship between δ 18O and air temperatures for all the samples collected over 3 years at the Delingha Meteorological Slation.
Ice cores were recovered from several places on the QT Plateau (see Fig. 1) to study climatic change in the last few decades. The Dunde ice cores were recovered from the northern edge of the plateau, and a comprehensive study of the δ 18O records revealed a temperature increase in this region (Reference ThompsonThompson and others, 1989; Reference Yao, Xie., Wu and Thompson.Yao and others, 1990). Ice-core studies have been conducted at two new sites: Guliya Ice Cap in the western Kunlun Mountains (Reference Yao and Thompson.Yao and Thompson, 1992) and Tanggula Glacier in the Tanggula Mountains. On Tanggula Glacier a 14 m core was recovered and δ 18O was measured to provide a record extending back to the 1930s. A shallow core drilled on Guliya Ice Cap was also analyzed for δ 18O; the discussion of the time series from that core has been limited to that for the Tanggula core. Dating of these two cores was accomplished using a combination of counting the distinct annual dust and the seasonal variations in δ 18O (Reference Yao, Xie., Wu and Thompson.Yao and others, 1990). The uncertainty in dating these cores is estimated to be less than 5%.
The annual averages of δ 18O since 1940 from Tanggula Glacier (Fig. 4a) and Guliya Ice Cap (Fig. 4b) show quite similar trends even though they are 1000 km apart. Two important features of these records are the warmer periods in the early 1960s and the warming since the late 1970s. These warmer intervals are accentuated using a 5 year moving average (Fig. 4a and b; dashed line). The most impressive feature in both records is the recent warming, which appears to have begun 2 years earlier (1969 vs 1971) on Guliya. The warming (inferred from 18O enrichment) since the late 1960s on Tanggula is nearly equivalent for both sites.
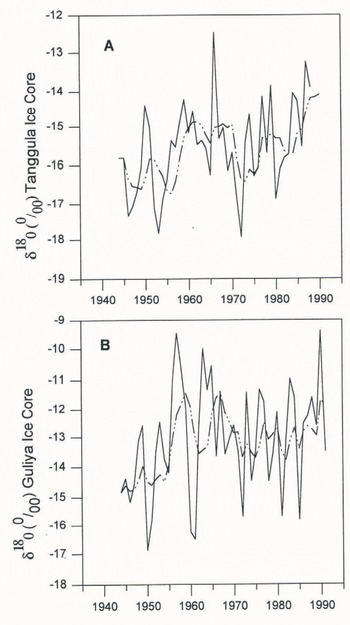
Fig. 4. Annual averages and the 5 year running mean (dashed lines) of δ 18O measured in the Tanggula. (a) and Guliya (b) ice cores.
Evidence from Glacier Fluctuations and Permafrost
Glaciers cover about 60 000 km2 on the QT Plateau. There are a number of glacier parameters which may relied changes in the glacier’s environment: changes in glacier extent, thickness, volume and mass balance. Here we explore the changes in glacial extent as a proxy indicator of changes in the climate. If the amount of precipitation is assumed constant, the retreat of a glacier should imply warmer conditions while an advance should imply climatic cooling. The assumption of constant accumulation is rarely a reality, and temperature and precipitation are intimately linked, but we make this assumption to simplify the following discussion. Most of the glaciers studied in this area are temperate and show signs of retreating. Temperate glaciers, compared to cold or “polar” glaciers, are more sensitive to temperature fluctuations (Reference YaoYao, 1987). Thus, many of the temperate glaciers in southeastern Tibet are retreating quite rapidly. One typical temperate glacier, Zepu Glacier, has been studied in detail. In 1973 the terminus of the glacier surface was covered with a very thin layer of debris and there was no vegetation on the surface of the debris (personal communication from Li Jijun). When revisited in 1989, the glacier was found to be covered with a very thick laver of debris with vegetation growing on the debris. This is clear evidence of a strong glacial retreat.
Ogives (or Forbes’ bands) are also considered useful for reconstructing the past fluctuations of glacier velocity (Reference Lliboutry and Reynaud.Lliboutry and Reynaud, 1981). In 1989, two sets of ogives were measured to reconstruct glacier velocity fluctuations since the 1970s on a small glacier (Small Zepu Glacier) near Zepu Glacier. Figure 5 shows the annual fluctuations of velocity reconstructed from these two sets of ogives. Although year-to-year fluctuations are evident, the glacier’s velocity has slowed over the last 10-15 years with a major decrease in the early 1980s, which is direct evidence of glacier retreat.

Fig. 5. The glacial velocities reconstructed from two sets of ogives (a,b) on Small zepu Glacier.
A sub-polar glacier, Tanggula Glacier, has been studied since 1989. Based on our 5 years of observations, this glacier is slowly retreating at a rate of 4 m year−1. In addition to the measurement of retreat distance, other evidence of retreat is worth noting here. Many push moraines, indicators of glacial advance, are now separated from the ice margin of Tanggula Glacier. The push moraines indicate that Tanggula advanced at some time in the past; however, their separation from the margin indicates that the glacier is retreating now. Push moraines that are separating from the ice margin are now more common for glaciers on the QT Plateau. Ten years earlier many of these glaciers were advancing in response to the short cold period in the late 1960s and early 1970s (Reference Binhui.Ren Binhui. 1988). The Tanggula push moraines were probably formed during this advance. The separation of the push moraines from the ice margin reflects the warming which has dominated since the late 1970s.
Permafrost is also an indicator of climatic change (Reference HaeberliHaeberli, 1990). In the 1970s, a number of boreholes were drilled in the permafrost along the road which crosses the QT Plaleau, making it possible to monitor the change in thickness of the permafrost and ground-temperature changes in the permafrost. The boreholes have been monitored since. A recent study (Reference WangWang, 1993) demonstrated a clear decrease in the thickness of the permafrost (Table 1) and an obvious increase in ground temperatures at 15 m since the 1970s (Table 2). Temperature increase was 0.2-0.3°C from the 1960s to the 1990s. Temperature increases were also found in permafrost in northeast China from which (in Reference Zhongwei, Zhou Youwu and Liang Fengxian.Zhongwei and others (1993) inferred an atmospheric warming in the region.
Table 1. Thinning of permafrost on the Qinghai–Tibetan Plateau

Table 2. Ground-temperature increase at 15 m in the permafrost on the Qinghai-Tibetan Plateau

Conclusions
The data presented in the paper are from different sources, but all indicate a recent warming of the atmosphere over the QT Plateau. Most of the glaciers in this region advanced as a result of the cooling in the late 1960s and early 1970s, but appear to be retreating contemporaneously with the rapid warming since the late 1970s.
The δ 18O records suggest an average enrichment From the 1970s to the 1990s of 1.2‰ in the Tanggula ice core and 2.2‰ in the Guliya ice core. These enrichments in δ 18O are indicative of an increase in atmospheric temperatures. The magnitude of this temperature rise can he estimated from δ 18O measurements of precipitation and simultaneous measurements of air temperature. Since 1991, these measurements have been performed at the Delingha Meteorological Station (see above). This results in too few annual averages of δ 18O and temperature to interpret annual averages of δ 18O in the ice cores. Nevertheless, a preliminary interpretation was made, based on the relationship between monthly averages of δ 18O and temperature (a 1% increase in δ 18O corresponds to a temperature increase of 1.5°C). In that case, temperature rises from the 1970s to the 1990s of 1.8° and 3.3°C are inferred from the Tanggula and the Guliya ice core, respectively.
The magnitude of the increase in ground temperatures in both perennially and seasonally Frozen ground indicates that ground-temperature increase at the level of zero annual amplitude (10-15 m below surface) is 0.2-0.3°C From 1962 to 1989.
Acknowledgements
This work has been supported by the National Natural Science Foundation of China, the U.S. National Science Foundation’s Office of Climate Dynamics and Division of Polar Programs (ATM-8519794, ATM-89116635, DPP-901493), the National Geographical Society (3323-86, 4309-90 and 4522-91) and The Ohio State University. We extend our appreciation to Dr W. Greuell, Dr. J. Jouzel, Dr W. Haeberli, and Ms M. Davis for their suggestions for revision of the paper. This is contribution No. 934 of the Byrd Polar Research Center.


