


Introduction
Bicycle helmets provide proven protection against head injuries.Reference Thompson, Rivara and Thompson 1 - Reference Thompson and Thompson 4 A 2009 Cochrane Review reported a 63% to 88% reduction in the risk of head, brain, and severe brain injury for all ages from bicycle helmet use.Reference Thompson, Rivara and Thompson 1
In 2012, the Office of the Chief Coroner for Ontario published a review of all cycling deaths in Ontario from 2006 to 2010, and noted that bicyclists whose cause of death included a head injury were three times less likely to be wearing a helmet than those who died of other types of injuries. 5 , Reference Persaud, Coleman and Zwolakowski 6 A study of Ontario Coroner reports from 1986 to 1991 found that 75% of deaths in cycling were associated with head injury, and only 4% of these cyclists were wearing a helmet.Reference Rowe, Rowe and Bota 7
Public bike-share programs (PBSPs) are broadly used around the world, with 49 countries hosting advanced programs in more than 500 cities, for a combined fleet of over 500,000 bicycles.Reference Shaheen, Guzman and Zhang 8 , Reference Larsen 9 These programs increase bicycling accessibility for commuters in the downtown core of cities.Reference Fuller, Gauvin and Kestens 10 By facilitating one-way travel, public bike-sharing facilitates greater bicycle usage and has been found to reduce the use of personal automobiles and taxis.Reference Martin and Shaheen 11 In Canada, PBSPs have been established in Montreal, Toronto, and Ottawa. The Toronto PBSP was established in 2011 by Bixi and involves 1,000 bicycles at 80 solar-powered docking stations. Management of the Toronto bike-share program was transferred to the Toronto Parking Authority in December 2014. Cyclists who are eighteen years of age or older can subscribe through a daily, 72-hour, monthly, or yearly fee, and obtain bicycles using their credit card or an electronic key fob at a docking station. The system has been used for over one million bike trips since its inception.
Helmet use among bike-share riders remains low. An observational study of helmet use in Toronto found that the proportion of PBSP bike riders using helmets was significantly lower than the proportion of helmet users on personal bikes (20.9% vs 51.7%).Reference Bonyun, Camden and Macarthur 12 A similar study conducted in Washington, DC and Boston, MA found that bike-share users were less likely to wear a helmet compared to personal bike users (54.5% vs 80.8%).Reference Fischer, Sanchez and Pittman 13 In Montreal, the prevalence of helmet use among bike-share users is only 12%.Reference Grenier, Deckelbaum and Boulva 14 There is increasing evidence suggesting that low prevalence of helmet use amongst PBSP users arises from the often spontaneous nature of public bicycle use, and the fact that few bike-share systems have readily available helmet rental options.Reference Attewell, Glase and McFadden 2 , Reference Rivara, Thompson and Thompson 3 , Reference Grenier, Deckelbaum and Boulva 14 - Reference Basch, Zagnit and Rajan 19
An analysis of trauma centre data for bicycle-related injuries for five cities with PBSPs and five comparison cities reported an increase in the proportion of head injuries among bicycle-related injuries in the twelve months following implementation of PBSP. However, aggregate annual injuries were found to decline in bike-share cities, even as they remained approximately the same in non-share cities.Reference Graves, Pless and Moore 20 , Reference Jaffe 21 Proposed reasons included a relative decrease in the incidence of injuries as cycling ridership increased in cities (the “safety in numbers effect”), and the fact that bike-share cities tended to build better cycling infrastructure.Reference Jaffe 21 In a modeling study of the London bike-sharing scheme, Woodcock and colleagues found that injury risks were lower among bike-share users compared with the average for cyclists in the same area.Reference Woodcock, Tainio and Cheshire 22
To better understand helmet use by PBSP users, we sought to characterize helmet-use patterns, barriers to helmet use, and cycling safety practices among bike-share users in Toronto. We used a case-control methodology to characterize and contrast PBSP users who wear helmets and those who do not. Secondary objectives included characterizing impressions regarding means to increase helmet usage, including helmet rental or sharing at PBSP, and legislation to enforce helmet use.
Methods
Study design
This was a case-control study of Toronto PBSP users (aged 18 or older). Study subjects were PBSP bike users wearing helmets at pre-chosen high-use PBSP stations. The control subjects were the next two non-helmeted PBSP station users. This strategy matched for location, time of day, day of week, and road and weather conditions.
Data were collected with an intercept survey at specified Toronto PBSP stations. Stations were selected in a structured manner, targeting higher-use PBSP sites, with a goal toward coverage of at least half of the 80 Toronto PBSP sites over the course of the study. We numbered each PBSP station and randomly selected sequential sites for data collection. If there was a low volume of cyclists or PBSP docks at a given site, then that site would not be used for subsequent data-collection periods.
A trained observer stood at each PBSP bike station, approximately three metres away from the rental podium. The surveyor approached a patron returning or accessing a bike at the PBSP station, identified himself or herself as a researcher associated with University of Toronto and University Health Network, and solicited participation in a five-minute research survey. If the respondent agreed, they were asked to read a consent form, and then were administered a standardized survey. Candidates were excluded from the study if they declined to participate, were unable to provide informed consent due to language barrier, or were younger than age eighteen.
Piloting
A pilot study of the survey and methodology, consisting of three, three-hour sessions of data collection, was completed, and questions were subsequently refined for clarity, prior to finalization and launch of the study. The survey included sections on cyclist demographics, helmet use, and cycling practices, and impressions regarding proposed interventions to improve helmet use on bike-share. (See Appendix A).
Outcome measures
The primary outcome was a characterization and comparison of helmet wearing (HW) and non-helmet wearing (NHW) bike-share users by usual helmet use, cycling practices, and socioeconomic factors. Secondary outcomes included PBSP user impressions of proposed interventions to improve helmet use, including legislation and loaner helmets.
Statistical analysis
Analyses employed independent samples t-tests, χ2-tests, and Fischer’s exact tests, as appropriate, and were performed using SAS and STATA. In cases where the question response was ordinal Wilcoxon two-sample tests (excluding the n/a respondents) were performed.
A sample size calculation indicated that an n of 300 participants (1:2 case:control ratio) would provide >90% power to detect a 20% difference in HW practices and daily versus annual use subscription patterns at an alpha level of 0.05.
Ethics
This study was approved by the University Health Network Research Ethics Board.
Results
Surveys were completed for 545 unique users (433 males [79%] and 112 females [21%]) at 48 locations, from November 2012 to August 2013. We surveyed on 82 weekdays, one weekend day, and no holidays. Control matching (1 HW to 2 NHW) was maintained as per protocol (180 HW and 365 NHW).
Gender and socioeconomic status
A higher proportion of females wore helmets (F: 41.1%, M: 30.9%, p=0.042). NHWs tended to be slightly younger than HWs (NHW mean and median age: 34.4, 32.0 years vs HW 37.3, 34.5, p=0.002). Groups did not differ by employment status, education, or income. (Table 1).
Table 1 Demographics of participant bicyclists at Toronto PBSP stations (n=545).

* Note: data was reclassified for analysis as<undergraduate degree versus undergraduate degree versus > undergraduate degree.
** Note: data was reclassified for analysis as full-time employed versus student versus all other options.
Total household income was greater than $75,000 for 80% of participants, and 91% had an undergraduate degree or graduate degree (masters or doctorate). A slightly higher proportion of HWs spoke English at home (92.2%) versus NHWs (86.3%) p=0.044.
Bicycle and helmet ownership
Personal bicycle ownership and helmet ownership were lower among NHWs, though the majority of NHWs owned helmets (Table 2).
Table 2 Bicycle helmet ownership and use.
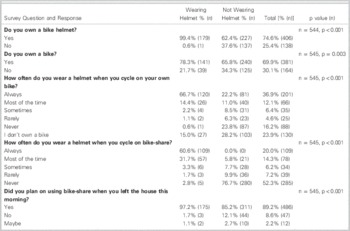
Helmet use on personal and bike share bicycles
NHWs were less likely to always wear a helmet when on their own bicycle than HWs (NHW: 22.2% vs HW: 66.7%, p<0.001), and less likely to wear a helmet always or most of the time when on PBSP (NHW: 5.8% vs HW: 92.3%, p<0.001).
Planned versus unplanned bike-share use and helmet practice
Both groups, but more HWs, had planned to use PBSP when leaving their houses. The main trip purpose in both groups was to get to work (HW: 88.3% vs NHW: 84.1%, p=0.19). Both groups were primarily one-year subscribers (NHW: 85.2% vs HW: 95.6%).
Sporadic users (i.e., 24-hour plan)
Sporadic users were a small minority of those surveyed. NHWs were more likely to use the 24-hour plan than HWs (NHW: 12.1% vs HW: 2.2%, p=0.0003). NHWs were more likely to be biking for social or entertainment purposes than HWs (6.0% NHW vs 0.0% HW, p<0.001).
Barriers to helmet use
NHWs were more likely than HWs to cite helmets as inconvenient (64.7% vs 21.7%), unnecessary (11.2% vs 1.2%), or lack of ownership (19.7% vs 0.6%) as their primary barriers to helmet use (all p<0.001).
Safety practice and injury experience
HWs and NHWs did not differ in their view of the safety of cycling in Toronto. (χ2=8.21, df=4, p=0.084, Wilcoxon test: p=0.128). (See Table 3.)
Table 3 How safe do you think cycling is in Toronto?
* For the safety question responses: χ2=8.21, df=4, p=0.084, Wilcoxon test: p=0.128.
The proportion of subjects who had been in an accident on their personal bicycle did not differ across study groups (p=0.663). Reported accidents on bike-share were uncommon. However, HWs were almost twice as likely to report having been in a cycling accident on PBSP in the past 12 months (8.9% vs 4.9%, p=0.072).
Impact of proposed remedies to improve helmet use
NHWs were more likely to report that they would wear a helmet more (61.4% NHW vs 13.9%HW, p<0.001), and/or cycle less (22.5% NHW vs 4.4% HW, p<0.001) if helmet use was mandatory. HWs were more likely to report that their cycling and helmet use behavior would not change (82.8% HW vs 19.7% NHW, p<0.001) (Table 4).
Table 4 Responses to question: “How would a law that made helmet use mandatory impact your cycling?”
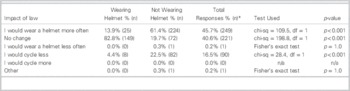
* Multiple responses allowed.
Approximately half of NHWs indicated they would use loaner helmets if these were available at PBSP stations (28.8% very likely, 24.7% likely).
Discussion
Deliberate decisions versus forgetfulness
We used a case-control methodology to characterize Toronto bike-share users based on their use or non-use of helmets. Our results suggest that cyclists make very deliberate decisions regarding helmet use. Individuals who did not wear helmets on bike share also reported that they generally chose not to wear helmets on their own bicycles, despite the fact that 62% of them owned a helmet. The great majority of participants were regular PBSP subscribers using bike-share as part of their commute to work, and had planned to use bike-share prior to leaving their homes. This suggests that not wearing a helmet is related to intentional choice, rather than forgetfulness.
Demographics
Study participants were predominantly male, educated, and affluent. The gender distribution we found is similar to that reported in other cities and in a previous study of Toronto bike-share users.Reference Bonyun, Camden and Macarthur 12 In 2011–2012, Shaheen and colleagues undertook a public bike sharing study in four North American cities: Montréal, Minneapolis-St. Paul, Toronto, and Washington DC. Bike sharing members had slightly higher incomes, were younger than the general population (though with a significant proportion middle-aged or older), were predominantly male, and were more educated, than the general population.Reference Shaheen, Martin and Cohen 23 , Reference Shaheen, Martin and Cohen 24
We found males and younger riders were significantly associated with lower helmet use and that HW practices did not differ by employment status, education, or income. Several Canadian studies have reported that cyclists who do not wear helmets tend to be younger, less affluent, and less educated than those who do wear helmets.Reference Teschke, Brubacher and Friedman 25 - Reference Li, Baker and Smialek 27 Recreational cyclists have been reported to be less likely to wear a helmet than commuter cyclists.Reference Irvine, Rowe and Sahai 26 In our study, cyclists not wearing helmets were only marginally more likely to be biking for social or entertainment purposes than HWs, though these purposes were uncommon in both groups surveyed.
We found reported cycling injuries were few in number, but the proportion of those reporting injuries in HWs was almost twice that in NHWs. A cross-sectional study involving university students found that prior bicycling injury is associated with increase in bicycle helmet use, especially if hospitalization occurred.Reference Teschke, Brubacher and Friedman 25
Barriers to bicycle helmet use
Approximately two-thirds of NHWs reported owning a personal bicycle or a helmet. The primary barriers to bicycle helmet use cited by NHWs in our study were inconvenience, perceived lack of necessity, and lack of ownership. Similar barriers to helmet use have been reported elsewhere.Reference Rodriguez and Quintero 28 - Reference Villamor, Hammer and Martinez-Olaizola 35
Approaches to increasing helmet use
Approaches to improving helmet use include consumer incentives, education surrounding helmet safety, and legislation. Consumer incentives can include helmet rentals, coupons, mailings at point of sale, discounts and promotion, and loaner helmets. For example, the Melbourne, Australia PBSP instituted courtesy helmets as a permanent feature of their service, with loaner helmets available free of charge with each bicycle, and the Boston PBSP employs high-capacity, solar-powered helmet rental vending machines (HelmetHub) that dispense sanitized loaner helmets that can be returned at point of origin or destination.
Educational campaigns have been shown to be effective in increasing helmet use, and can be significantly influenced by peer helmet use among children, adolescents, and adults.Reference Finnoff, Laskowski and Altman 33 , Reference DiGuiseppi, Rivara and Koepsell 34 Public health campaigns could target the young male demographic, and stress the comfort, lightweight design, styling, and low cost of contemporary helmets. Vulcan and colleagues reported 10 years of helmet-use promotion in Australia from 1980 through to institution of compulsory helmet use in 1990, with initiatives that included bicycle education in schools, mass media publicity, professional organization support, community group support, bulk purchase schemes, and government rebates. During this period, voluntary helmet use increased from 2% to 20% in secondary students, and from 27% to 40% in adults.Reference Vulcan, Cameron and Watson 36
Legislation
In our study, cyclists on bike-share who did not wear helmets anticipated they would have greater helmet use if helmet legislation were enacted. Approximately one-fifth indicated that they would cycle less if helmet legislation was enacted.
In North American jurisdictions, the typical proportions of adults wearing helmets is in the range of 30% to 50% where there is no requirement, and over 70% where legislation requires use by adults.Reference Rodriguez and Quintero 28 , Reference Dennis, Potter and Ramsay 37
Legislation has been found to effectively increase helmet use and decrease head injury rates.Reference Macpherson and Spinks 38 , Reference Karkhaneh, Kalenga and Hagel 39 After introduction of helmet laws in Victoria, Australia, helmet use increased from 31% to 75%, and cycling fatalities decreased by 48%.Reference Vulcan, Cameron and Watson 36 , Reference Cameron, Vulcan and Finch 40 A 2010 Canadian study found that youth and adults were significantly more likely to wear helmets as the comprehensiveness of helmet legislation increased, and that helmet legislation was not associated with changes in ridership.Reference Dennis, Potter and Ramsay 37 However, these studies did not expressly investigate PBSP ridership.
Legislation mandating helmet use for all cyclists (or cyclists under a certain age) has been enacted in six of ten Canadian provinces, parts of the United States, and many other countries including Australia, New Zealand, Europe (including Czech Republic, Slovenia, Spain, Malta, Finland, Sweden, Iceland) and Japan. The Canadian Association of Emergency Physicians recently published a position statement on bicycle safety that made a number of evidence-based suggestions, and called for Canada-wide legislation requiring bicycle helmets for all ages, along with an educational campaign regarding cyclist visibility, and governmental prioritization of a ‘‘complete streets’’ approach to the environment for cyclists.Reference Letovsky, Rowe and Friedman 41
Opponents to helmet legislation typically express concerns such as invasion of personal freedoms. Moreover, they stress the relatively low morbidity and mortality associated with cyclingReference Wardlaw 42 and argue that mandatory helmet legislation unfairly shifts the burden of responsibility for serious cycling collisions from motorists to cyclists. Mandatory helmet legislation may be the most easily enacted policies aimed at improving cycling safety; however, opponents often tout the low incidence of head injuries in European countries where helmets are generally not worn but where cycling infrastructure is a core component of better-designed and more extensive urban planning. Mandatory helmet opponents often express concerns about the impact on ridership, citing the reported negative impact on public bike-share use in Victoria, Australia in the two years following the introduction of PBSP.Reference Vulcan, Cameron and Watson 36 , Reference Cameron, Vulcan and Finch 40 Of note, Mexico City repealed its mandatory helmet law in 2010, the same year that the city launched its first public bike system.Reference Peñalosa 43
Limitations
Since the Toronto PBSP’s main use is facilitating transportation over short distances and the majority of bicycling traffic is during peak commuter traffic hours, we chose to survey during these peak periods (0700–1000 and 1500–1800) to maximize the availability of eligible participants. By interviewing primarily on weekdays during commuting hours, our approach may have failed to capture those who use bike-share primarily for pleasure or unplanned trips. However, in a prior study of four North American cities, the most common trip purpose was work or school-related.Reference Shaheen, Martin and Cohen 23 , Reference Shaheen, Martin and Cohen 24 Structured sampling of PBSP stations may have further led to a non-representative population of Toronto bike-share users. When soliciting for participation in the study, if someone refused, we continued to recruit to maintain the 2:1 ratio during that survey period. However, we did not track refusal rates or reasons for refusal during the study. Reponses to hypothetical questions (such as those regarding proposed legislation or loaner helmets) might not necessarily translate into actual practice. Questions regarding cycling accidents only queried the most recent twelve months, and it is possible that respondents might have been influenced by injuries or near misses that had occurred in the more remote past. While the demography of PBSP users in our study is similar to that reported in other North American studies, our results are not necessarily generalizable to other regions.
Conclusions
PBSP users surveyed appear to make deliberate decisions regarding helmet use. NHWs tended to be male, slightly younger, and less likely to use helmets on their personal bicycles. As Toronto cyclists who do not wear helmets on PBSP generally do not wear helmets on their personal bicycles, interventions to increase helmet use should target both personal and bike-share users. Legislating helmet use and provision of rental helmets could improve helmet use among bike-share users, but our results suggest some risk of reduced cycling with legislation.
Competing Interests: None declared.
Supplementary Material
To view Supplementary Material for this article, please visit http://dx.doi.org/10.1017/cem.2015.22


