Introduction
What is interesting for customers for avalanche warnings? Of course, they want to know whether avalanches may cause damage to life, health, property and business. To answer this question an avalanche forecaster should answer at least three additional questions: (a) How stable is the snow cover? (b) What dynamical parameters will the possible avalanche have? (c) How will it interact with the object? In spite of the existence of models to answer these questions, for many reasons none of them can do so precisely at present. In general, the reasons can be divided into two groups. The first is uncertainty or lack of knowledge concerning specific factors, parameters or models (measurement errors, uncertainty due to necessary simplification of real-world processes, mis-specification of the model structure, model misuse, etc.). The second relates to the variability of the parameters that control avalanching (temporal and spatial variability of weather and snow parameters, etc.). In addition, it is very difficult to combine the results obtained with models addressing questions a-c above, since, when they were derived they were not considered as links in a common chain. A minimum requirement in this situation is knowledge of the risk (probabilities or chances), P(Y1), of the possible losses, Yi. There are mathematical methods for rationalizing the customers’ behaviour in conditions of uncertainty (Reference SchlaiferSchlatter, 1969), but they have to be supplied with information on avalanching itself. Avalanche science should provide methods of determining avalanche parameter probabilities. It is suggested that statistical simulation or the Monte Carlo method may be used for this. A common scheme for avalanche-risk estimation with statistical simulation is presented in Figure 1. Of course, this scheme could be started from calculation of the parameters that control snow deposition and transformation and snow-cover evolution, as with the SAFRAN/Crocus/MEPRA integrated model (Reference Brun, Martin, Simon, Gendre and ColéouBrun and others, 1989; Reference Durand, Brun, Mérindol, Guyomarc’h, Lesaffre and MartinDurand and others, 1993; Reference Giraud and ArmstrongGiraud, 1993). But due to computational difficulties with its stochastic realization, this variant is not considered here.

Fig. 1. A common schema for avalanche-risk estimation with statistical simulation. Ntot, total number of realizations generated by the Monte Carlo method; Na, number of avalanche situations; Na(Yi) number of avalanche situations with losses Yi, ’’One-dimensional spatial distributions of the snow-cover parameters were simulated in this study.
Simulation of Snow Instability
There are several models for the snow-cover instability simulation using the Monte Carlo method (Reference Bozhinskiy and ChernoussBozhinskiy and Chernouss, 1986; Reference Chernouss and V FedorenkoChernouss and Fedorenko, 1998). They differ in their methods for simulating the spatial distribution of the snow cover and determining snow-cover instability. For one-dimensional cases these distributions are usually simulated as multivariate random vectors, but for two-dimensional cases as random fields on the basis of their spectral representations. In this study the former was chosen for simulation. Snow-thickness (h), density (ρ) and shear strength (c) distributions along the slope profile, or, more correctly, their values at k equidistant points of the profile, were simulated as k-dimensional normal vectors ξh, ξρ, ξc. Previous studies (Reference Chernouss and KhristoyevChernouss and Khristoev, 1986; Reference Chernouss and SivardiereChernouss, 1995) showed that these distributions are very close to normal. Vectors of mathematical expectation m and covariance matrix R determine such distributions entirely. The vectors ξ are obtained by linear transformation of a normal vector η whose components are random normal values with mathematical expectation equal to zero and variance equal to one:
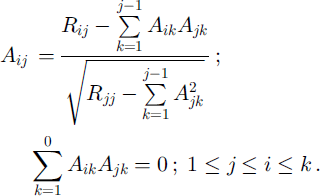
The coefficients of the triangular transformation matrix AtJ are determined on the basis of the covariance coefficients Rij using a recurrent formula (Reference Yermakov and MikhailovYermakov and Mikhailov, 1982).

For the case with a constant mathematical expectation m and variance a\ the distances between points of the simulation i and j, lij, and a spatial autocorrelation function r(l) determine the covariance coefficients entirely:
Thus, it is enough to have mathematical expectations, variances and autocorrelation functions of the parameters mentioned above to produce their realizations along the profile by the Monte Carlo method. The variances and autocorrelation functions obtained for snowstorm snow in the Khibiny mountains (Reference Chernouss and KhristoyevChernouss and Khristoev, 1986; Reference Chernouss and SivardiereChernouss, 1995) were used for the simulation. Mean values of the snow thickness obtained by remote snow surveying in avalanche starting zones, and shear strength and density obtained by measurements close to these zones, are used now as estimations of mathematical expectations m.
A simple deterministic method suggested by Reference Bozhinskiy and LosevBozhinskiy and Losev (1987) is used to determine the snow-cover instability where the snow cover on the mountain slope is considered as a thin elastic shell which can slip on the underlying surface. The condition of tensile stress exceeding tensile strength is an avalanche formation criterion. According to the model, this stress appears after slipping of the snow cover on the underlying surface. For calculations, the profile of the slope is divided into k equal segments. Slab thickness, density and shear strength are randomly generated by Equation (1) for each segment k. For each segment k, critical snow thickness h*k is calculated with an approximate formula:
where ak is the inclination of segment k, / is the dry-friction coefficient and ck is the shear strength in segment k. For each segment, snow thickness hk is compared to hk*. Zones in the profile where snow thickness is greater than critical and where the slipping on the underlying surface takes place are selected. The snow mass, M, in the selected zones is calculated and compared to a critical mass, M*, for each zone. The snow is considered to be in unstable condition in the zones where snow masses are greater than critical. In this simplification M is considered as an analog of tensile stress, and M* as an analog of tensile strength. In accordance with Reference BozhinskiyBozhinskiy (1980), the friction coefficient / and the critical mass M* are effective constants which are determined by back calculations from data (in the starting zone) on avalanche releases.
Having arrived at a substantial number of realizations by the Monte Carlo method, evaluations of two kinds of probabilities P1 and Pk can be calculated as the ratios of a definite kind of outcome to the total number of realizations. P1 is probability of avalanche release or that at least one unstable zone (M ≥ M*) is formed in the slope of the given profile. Pk is the probability that the snow cover in the segment k is in a zone of the initial displacement (zone where M ≥ M*). The probability Pk is calculated for separate profiles in the avalanche starting zone and interpolated between them for visualization of avalanche release zones of different probability on the map. Errors of the interpolation were not considered.
Simulation of Avalanche Dynamics
For the simulation of avalanche dynamics a simple deterministic method was chosen where the avalanche is considered as a material point moving with dry friction. This method was approved by the Russian government for use by the construction industry (Reference Zalikhanov, Isaenko, Voitkovskiy, Shakhunyants, Rak and BobrovZalikhanov and others, 1980). It permits calculation of avalanche speeds and run-out distances. Avalanche speed (VB) at some point B on its path is determined as:
where lB = OD and hB = DB, The symbols used are explained in Figure 2, where O is the highest avalanche starting point and A is the end-point of avalanche depositions. Thus, avalanche speeds and run-out distances for a chosen profile are determined by the starting-point position and the angle φ (tan φ is a friction coefficient). For the avalanche-risk simulation the point O is determined as the highest point of the M zone for each realization which results in an “unstable” snow-cover condition, and tan φ is simulated using its probabilistic distribution, obtained from the data on avalanche run-out distances. The empirical probability density function calculated from data of 159 avalanche releases in 10 Khibinian avalanche sites is shown in Figure 3. Since the probability density for tan φ is far from normal, it was transformed into ln(tan φ), which has a distribution close to normal. There is no reason to reject the hypothesis of normality at the significance level a = 0.05. According to the Monte Carlo procedure, the values of ln(tan φ) are randomly extracted from the curve of Figure 3 and then transformed into tan p. Avalanche speeds Vk and impact pressures Fk are calculated for each segment k of the profile for each realization. Probabilities Pk(V*) = P(Vk ≥ V*) are calculated as the ratio of outcomes where Vk ≥ V* to the total number of realizations, and Pk(F*) = P(Fk ≥ F*) as the ratio of outcomes where Fk ≥ F* to the total number of realizations. The probability of the avalanche run-out distance X exceeding a given co-ordinate X* is calculated as the ratio of outcomes where X > X* to the total number of realizations. X is the coordinate of the end-point of avalanche depositions. Note that the dry-friction coefficients used in the model of snow-cover stability (f) and in the model of avalanche dynamics (tan φ are different.

Fig. 2. Schema for determining avalanche speed and runout distance.

Fig. 3. Frequency distribution and probability density for ln(tan φ).
Interaction of the Avalanche with an Obstacle
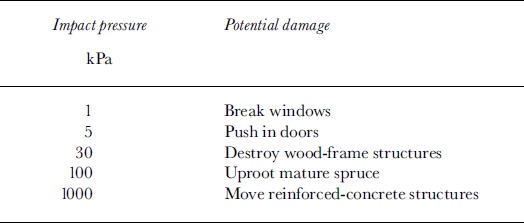
When the avalanche risk is calculated there are two other parameters that should generally be taken into account in a probabilistic manner. They are exposure and vulnerability. Usually, their simulation is a simpler problem than the simulation of snow stability. Exposure depends on the object’s coordinates, which can be a function of time. Vulnerability depends on the object’s properties, which sometimes can change in time, too. For example, correlations between impact pressure and potential damage (Table 1), or relationships between number of avalanche victims found alive and dead, and burial depth (Fig. 4) could be used for these purposes.
Table 1. Correlation between impact pressure and potential damage (Reference McClung and SchaererMcClung and Schaerer, 1993)


Fig. 4. Number of avalanche victims found alive and dead by burial depth (Reference Auger and JamiesonAuger and Jamieson, 1997).
Lavina: An Integrated Model for Avalanche-Risk Evaluation
The scheme described above was partly realized in LAVINA, a computer tool for assisting avalanche forecasters (Reference Chernouss, Perlikov and MokrovChernouss and others, 1998). LAVINA is software that runs on IBM-compatible computers. Besides statistical simulation for snow slab stability assessment at 25 avalanche sites, it allows evaluation of avalanche dynamics for these sites. In general, interaction of an avalanche with an object and the associated risk are evaluated numerically on the basis of impact pressure calculations and information on the vulnerability of the object (besides LAVINA software) or subjectively. But in some cases the risk can be evaluated numerically, as, for example, when a customer is interested only in whether a fixed object will be struck by a possible avalanche (exposure = 1, vulnerability = 1). In addition, it is possible to update the meteorological database (every 3 hours), regional avalanche diagnostics and forecasting with a Bayesian approach (Reference ZuzinZuzin, 1989), with linear and square discriminant analysis and with a method of potential functions (a version of pattern recognition methods; Reference Chernouss, Perlikov and MokrovChernouss and others, 1998). Information for interpretation is standard meteorological data and data on snow-cover parameters. LAVINA has a convenient user interface and is simple for practical work. Some examples of input and output information are given in Figures 5 and 6.

Fig. 5. An example of input data/or snow-stability simulation.

Fig. 6. An example of output information on snow-cover stability and dynamic characteristics of the expected avalanche. Lines of equal probability Pk (probability that the snow cover in the segment k is in a zone of the initial displacement (zone where M ≥ M*) are shown in the top part of the avalanche catchment.
Application of statistical simulation to diagnose avalanche occurrence was verified, but was not reliable enough. Accurate data on snow-cover parameters obtained by snow-thickness surveying and snow-pit measurements for separate starting zones were used. For avalanche situations the measurements of snow density and shear strength were carried out at the crown surface after avalanche release. Discrimination of 20 situations (8 avalanche and 12 non-avalanche) on the basis of highest probability resulted in one error, i.e. a non-avalanche situation was recognized as an avalanche one.
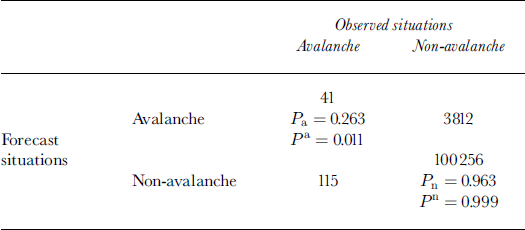
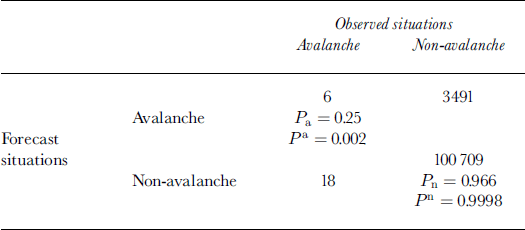
Since an avalanche forecaster at the Centre of Avalanche Safety is also a customer for the avalanche forecasts, or in other words, works out avalanche warnings in a categorical form, it is possible to estimate the validity of these warnings. The avalanche forecaster at the Centre has no opportunity to observe avalanche sites, and all warnings are made on the basis of information on meteorological and snow measurements obtained from field stations. At the same time he can play out different forecast scenarios with all models included in LAVINA. It is difficult to quantify the usefulness of LAVINA itself (separately from the subjective intuition of the forecaster) for avalanche-risk forecasting, but Tables 2 and 3 give some idea.
Table 2. Contingency table for subjective 3h avalanche occurrence forecasts for each of eight separate avalanche sites

Table 3. Contingency table for subjective 3 h avalanche danger forecasts for each of eight separate avalanche sites, showing whether an avalanche reaches objects in the run-out zone (railroads, automobile roads, open pits)

Symbols used in the tables are:
P × 100% is the percentage of correct forecasts, when forecasts coincide with observations.
“Post-agreement”: Pa × 100% is the percentage of correctly forecast avalanche situations; Pn × 100% is the percentage of correctly forecast non-avalanche situations (Pa and Pn are ratios of the number of situations when forecasts coincide with observations to the total number of “avalanche” and “non-avalanche” situations, respectively).
“Prefigurance”: Pa x100% is the percentage of correct “avalanche” forecasts; Pn × 100% is the percentage of correct “non-avalanche” forecasts (Pa and Pn are ratios of the number of situations when forecasts coincide with observations to the total number of “avalanche” and “non-avalanche” forecasts, respectively).
Q = Pa + Pn – 1 is Reference ObukhovObukhov’s (1955) criterion for alternative forecasts. Q varies from 0 for random, climatological, inertial or other “blind” forecast models to 1 for an ideal model and makes sense of the correlation coefficient between forecasts and observations. The higher the value of Q, the better the model.
The x2 criterion is applied to evaluate differences between the results obtained with the tested forecast model and some “blind” model.
As can be seen from Table 2, the quality of such forecasts is very low. Only 1 in 100 “avalanche” forecasts is accurate. Only 26% of avalanche situations are forecast correctly. Q = 0.23 is low. But the X2 test shows that with 0.9999 probability there is a significant difference between these forecasts and random ones. And above all, such forecasts are real forecasts with a very high resolution in time and space (separate avalanche sites and 3 h time intervals). The forecasts where, besides avalanche occurrence, the run-out distance is evaluated are more valuable for customers. In Table 3 the results of verification of such forecasts are presented. The Q value of the forecasts is almost the same as for avalanche occurrence prediction alone, but Pa is about five times worse. The large difference between the validity of diagnostics for special numerical experiments, when snow stability was determined post factum (by back calculation with data obtained in fracture line), and regular forecasts occurs for two reasons. In the former case, one does not take into account temporal factors and it is evident that regularly used information is much poorer than the information in these experiments. Part of the errors in categorical forecast formulation (high misclassification of avalanche situations) can be explained by incorrect selection of the threshold probabilities. At present there are no guidelines on how to fix them, and the forecasters proceed subjectively
Concluding Remarks
The presently implemented model is very simple. There are better deterministic models for snow stability and avalanche dynamics as well as methods for statistical simulation of snow-cover parameters. The main goal of this work is to demonstrate the potential of such an approach for avalanche-risk estimation. The use of two- or three-dimensional models of snow-cover stability causes major computational difficulties, and some studies should be carried out to determine their adequacy. Development of the work is planned with more advanced one- or two-dimensional dynamical avalanche models of different types. Presently, a model of hydrological type (Reference Bozhinsky, Nazarov and ChernoussBozhinsky and others, 2001) is being implemented in LAVINA, where the initial volume of snow entrained into the motion and the coefficients of dry and turbulent friction for the avalanche body are considered as random variables. It is possible to integrate a special unit into the simulation process to evaluate residual risk after the installation of protective measures. One of the advantages of this approach is that it reflects uncertainty connected with the uncertainty and variability of avalanche processes by using a probabilistic formulation of the results. The main obstacle for widespread application of this model is lack of information on the spatial and temporal variability of the snow-cover parameters for different types of snow in different geographical conditions.
Acknowledgements
This study was supported by the Russian Fund of Basic Researches, grant No. 99–05–65166, and by a travel grant from the Nordic Council, 1999.


