


Introduction
In cereal crops, tine harrowing has long served as the go-to method for mechanical weed control. However, within the last decade, the adoption of interrow hoeing has increased among organic cereal growers in Europe. The rise in popularity of the hoed cereal system is not unwarranted; there are numerous drawbacks associated with postemergence harrowing (see Kurstjens and Pedok Reference Kurstjens and Perdok2000; Rasmussen et al. Reference Rasmussen, Mathiasen and Bibby2010). In addition, significant technological advances in GPS- and camera-guidance systems have made precise interrow hoeing possible at satisfactory speeds up to 10 km h−1 (Gerhards et al. Reference Gerhards, Kollenda, Macheb, Moller, Butz, Reiser and Griegentrog2020; Melander Reference Melander2006; Tillet and Hague Reference Tillet and Hauge1999). Advantages associated with interrow hoeing include greater and less variable efficacy (Gallandt et al. Reference Gallandt, Brainard, Brown and Zimdahl2018) across a wider range of field conditions and weed species compared with harrowing (Melander et al. Reference Melander, Cirujeda and Jørgensen2003). In addition, hoeing cultivates only the interrow zone, while postemergence harrowing disturbs both the inter- and intrarow zones uniformly, inflicting crop damage. Conventional cereal growers also seek out mechanical weed management solutions; the relevance of interrow hoeing is likely to increase as herbicide use becomes more restricted, occurrence of herbicide resistance increases, and prospects remain poor for the commercialization of herbicides with new sites of action (Kudsk and Mathiassen Reference Kudsk and Mathiassen2020).
The hoed cereal system provides improved weed control at field scale compared with harrowing but may not provide sufficient weed control in the intrarow zone (Melander et al. Reference Melander, Jabran, Notaris, Znova, Green and Olesen2018). Depending on the competitive abilities of weed species present, remaining intrarow weeds can compete intensely with the crop due to their close proximity. In hoed spring barley (Hordeum vulgare L.), Melander and McCollough (Reference Melander and McCollough2020) reported that an intrarow surrogate weed, white mustard (Sinapis alba L.), reduced crop yields by 4% to 7 %, 14% to 26%, and 21% to 40% when densities of 5, 25, and 50 plants m−2 were recorded, respectively. Therefore, it is necessary to investigate further how intrarow weed management can be improved to optimize the hoed cereal system. The present study evaluates preemergence tine harrowing and the alteration of crop density and row spacing as strategies for controlling intrarow weeds within hoed spring barley.
The modification of crop density and spatial arrangement are common cultural weed management strategies in competitive cereal crops (Kolb and Gallandt Reference Kolb and Gallandt2012; Weiner et al. Reference Weiner, Greipentrog and Kristensen2001). If crop density is fixed, sowing in narrower rows will increase the equidistance between crop plants, also known as rectangularity of the crop spatial pattern, and reduce crop density in the intrarow zone (Regnier and Bakelana Reference Regnier and Bakelana1995). A decrease in row spacing and rectangularity of the crop’s spatial arrangement will simultaneously reduce intraspecific competition between crop plants and increase interspecific competition between crop plants and weeds (Fischer and Miles Reference Fischer and Miles1973), enhancing weed suppression and improving crop yields (Kolb et al. Reference Kolb, Gallandt and Molloy2010). If row spacing is fixed, increasing crop density can both improve crop yield, due to an elevation in population (Weiner et al. Reference Weiner, Andersen, Wille, Griepentrog and Olsen2010), and reduce weed biomass, due to increased competition (Mason and Spaner Reference Mason and Spaner2006; Weiner et al. Reference Weiner, Greipentrog and Kristensen2001).
In northern Europe, the standard interrow spacings for growing small-grain cereals is 12.5 cm. The practice of widening interrow spacings to distances ranging from 15 to 30 cm to accommodate interrow hoeing while maintaining seeding rate constitutes a recent topic of research (Gerhards et al. Reference Gerhards, Kollenda, Macheb, Moller, Butz, Reiser and Griegentrog2020; Kolb et al. Reference Kolb, Gallandt and Molloy2010, Reference Kolb, Gallandt and Mallory2012; Machleb et al. Reference Machleb, Kollenda, Peteinatos and Gerhards2018; McCollough et al. Reference McCollough, Gallandt, Darby and Molloy2020a; Melander and McCollough Reference Melander and McCollough2020; Melander et al. Reference Melander, Cirujeda and Jørgensen2003, Reference Melander, Jabran, Notaris, Znova, Green and Olesen2018). Wide row sowing and hoeing effectively reduce weed biomass compared with standard cropping practices (Melander et al. Reference Melander, Jabran, Notaris, Znova, Green and Olesen2018) and may improve yields, depending upon the severity of weed pressure (Kolb et al. Reference Kolb, Gallandt and Molloy2010; Rasmussen Reference Rasmussen2004). However, a disadvantage associated with wide row sowing is the potential for yield loss resulting from elevated intraspecific competition and the non-optimal utilization of nutrients, light, and water (Melander et al. Reference Melander, Cirujeda and Jørgensen2003; Rasmussen Reference Rasmussen2004). To avoid yield and crop quality losses, sowing at narrower row spacings is preferred. However, the ability to hoe efficiently between narrowly spaced rows is limited by a lack of automated steering systems capable of cultivating at row spacings below 20 cm (Gerhards et al. Reference Gerhards, Kollenda, Macheb, Moller, Butz, Reiser and Griegentrog2020; Machleb et al. Reference Machleb, Kollenda, Peteinatos and Gerhards2018). While the development of technologies able to accurately guide hoes between 15-cm rows is underway, this equipment is not yet widely available (Gerhards et al. Reference Gerhards, Kollenda, Macheb, Moller, Butz, Reiser and Griegentrog2020). Therefore, in the present study, row spacings of 15 and 20 cm were selected for evaluation, representing distances suited to interrow hoeing now and in the near future. In addition, yield penalties may not be present among row spacings less than 25 cm (Blair et al. Reference Blair, Jones, Orson, Caseley and Davies1997) and differing by 5 cm only.
The effect of adjusting seeding rate and row spacing has been well described when standard cropping practices are employed, namely, when weeds are uniformly managed across the inter- and intrarow zones using full-width tine harrowing or chemical control (Olsen et al. Reference Olsen, Kristensen, Weiner and Greipentrog2004). However, within the hoed cereal system, it is necessary to describe the effects of row spacing and crop density on intrarow weeds, crop yield and biomass, and grain quality parameters.
Materials and Methods
Site Characteristics and Field Preparation
Two field experiments were conducted at the Flakkebjerg Research Center, Denmark (55.33°N, 11.39°E), one in 2019 (EXP2019) and one in 2020 (EXP2020). In both years, trials were carried out in a field possessing a sandy loam soil texture. Soil fertility was amended with 550 kg ha−1 of YaraMila 21-4-10 (DLG, Axelborg, Vesterbrogade 4A, DK-1620, Copenhagen V, Denmark) to achieve a nitrogen rate of 115.5 kg ha−1; this fertility rate was selected to ensure that nitrogen would not limit crop growth among the row spacings tested.
Experimental Design and Treatment Specifications
Experiments possessed a full factorial, randomized complete block design with four replications. Experimental factors included (1) interrow spacing at two levels: 15 (RS15) and 20 cm (RS20); (2) crop density at four levels: 200 (CD200), 300 (CD300), 400 (CD400), and 500 plants m−2 (CD500); and (3) weed management treatment at three levels: plots receiving postemergence herbicide treatment (WMTherbicide), plots receiving no herbicide treatment (WMTweedy), and plots receiving preemergence tine harrowing (WMTtineharrow). In total, 96 plots were present in the experiment for each year (2 interrow spacings × 4 crop densities × 3 weed management treatments × 4 blocks). Plot dimensions were 2.5 by 20 m, and a two-row spring malting barley (‘KWS Irina’) served as the test crop.
Postemergence interrow hoeing was implemented in all plots using a Schmotzer hoe (Maschinenfabrik Schmotzer GmbH, Bad Windsheim, Germany) possessing flat rigid shares, designed to limit sideward soil movement. Share width varied to accommodate differences in row spacing among treatments; 8-cm-wide shares for RS15, and 13 cm for RS20, resulting in a 7-cm uncultivated zone surrounding the row at both row spacings. Sinapis alba ‘Lotus’ was sown as a surrogate weed, perpendicular to crop rows, in a 2.5-m horizontal strip through the center of each plot. Surrogate weeds were sown on the same date as barley, at a target density of 40 plants m−2. A summary of the dates on which key field operations and assessments were performed as well as crop, surrogate weed, and ambient weed growth stages at the time of implementation is provided in Table 1.
Table 1. Summary of dates, and crop (barley), surrogate weed (Sinapis alba), and ambient weed growth stages at the implementation times of critical field operations and data-collection events performed in 2019 (EXP2019) and 2020 (EXP2020).

a Barley growth stages are reported according to Lancashire et al. (Reference Lancashire, Bleiholder, Langeluddecke, Stauss, Van Den Boom, Webber and Witzen-Berger1991) BBCH decimal codes.
b Surrogate weed (Sinapis alba) growth stages are reported according to Lancashire et al. (Reference Lancashire, Bleiholder, Langeluddecke, Stauss, Van Den Boom, Webber and Witzen-Berger1991) BBCH decimal codes.
c Ambient weed (assorted species) growth stages are reported according to Hess et al. (Reference Hess, Barralis, Bleiholder, Buhr, Eggers, Hack and Stauss1997) BBCH decimal code.
Postemergence herbicide applications consisted of Starane XL at 0.5 L ha−1 (florasulam 1.25 g ai ha−1 and fluroxypyr 50 g ai ha−1, Dow AgroSciences Danmark A/S, Abedvej 39, 4920 Søllested, Denmark), Express at 10 g ha−1 (tribenuron-methyl at 5 g ai ha−1 and tribenuron at 4.82 g ai ha−1, Du Pont Danmark ApS, Edwin Rahrs Vej 38, DK-8220 Brabrand, Denmark), and Agropol at 0.15 L ha−1 (spreading adhesive at 150 g ha−1, UPL Europe, Engine Rooms, Birchwood Park, Warrington, Cheshire, WA3 YN, UK). Herbicides were applied with a custom-built unit, designed specifically for use in plot experiments. The sprayer was equipped with shields and HARDI ISO LD-110 LowDrift nozzles (RAJ & Associates, Crystal River, FL, USA); carrier volume was 150 L ha−1, boom height was approximately 0.5 m, and pressure was 360 kPa.
Data Collection
Data collected throughout these experiments included crop density, ambient weed density, surrogate weed density, crop biomass, intrarow surrogate weed biomass, intrarow ambient weed biomass, crop yield, grain protein content, grain bulk density, and 1,000-kernel weight (TKW; g). To avoid edge effects, samples were not collected from the outermost rows on either side of each plot or the first 50 cm at the top and bottom of each plot. Achieved in-field densities of the spring barley crop, surrogate weeds, and ambient weeds were recorded before implementing herbicide or interrow hoeing treatments. All crop and weed density (plants m−2) measures were carried out in 7 by 100 cm quadrats, centered on random sections of crop rows. For all treatments, interrow hoeing was implemented 3.5 cm from either side of the crop row, resulting in an uncultivated 7-cm-wide zone defining the intrarow zone for all data-collection purposes. In each plot, crop densities were recorded within four quadrats, intrarow surrogate weed densities were recorded within two quadrats in the surrogate weed strips, and intrarow ambient weed densities were recorded by species within four quadrats. Weed density counts were not performed in the interrow zone, because the focus of this study is to evaluate intrarow weed effects only.
Intrarow crop, surrogate weed, and ambient weed biomass samples were cut from six (7 by 100 cm) quadrats per plot. In WMTherbicide plots, six cuts were made randomly throughout the plot and combined into a single sample. In WMTweedy and WMTtineharrow plots, four biomass cuts were made outside the surrogate weed strip, and two cuts were made inside the surrogate weed strip; samples from these two zones were kept separate. All plant biomass samples were divided into three categories: (1) crop, (2) surrogate weeds, and (3) ambient weeds. Samples were dried for at least 24 h at a temperature of 80 C and then weighed to obtain plant biomass dry matter measures.
Before barley was harvested, 50 cm from the ends of each plot was cut away, as was the surrogate weed strip in each plot’s center. Because the plot width was wider than the combine head, the outermost rows on either side of each plot were not harvested. Final plot length and number of rows were recorded, and crop yields (kg ha−1) were calculated based on harvested area. Harvested grain was cleaned, and final yield weights were standardized to 15% moisture content. Barley grain quality measures were obtained following harvest. Protein content (%) and bulk density (kg hl−1) were measured for a subsample of whole barley grains using a near-infrared spectroscopy analyzer (InfratecTM 1241 Grain Analyzer, Foss A/S, Nils Foss Allé 1, 3400 Hilleroed, Denmark; Buchmann et al. Reference Buchmann, Josefsson and Cowe2001), and TKWs (g) were extrapolated from an average of four 200-kernel weight measures taken per plot. Temperature and precipitation data were retrieved from the Danish Meteorological Institute’s weather station located in Flakkebjerg, Denmark (DMI 2022).
Analysis
Experiments possessed an additive design, meaning that for every combination of weed management strategy and row spacing tested, all four levels of the continuous variable, crop density, were represented, thus permitting analysis via linear and nonlinear regression. Notably, data were analyzed separately for each year (EXP2019 and EXP2020). In both years, low crop and surrogate weed densities were observed among five plots possessing the same experimental footprint; plant density measures from each of these plots qualified as outliers, and data were excluded from analyses. Inadequate seedbeds resulting from an outcropping of stones within the field are the likely culprit for poor establishment.
Mixed model variables for the analysis of crop- and weed-response data included the random term, block, as well as fixed terms, crop density, row spacing, weed management treatment, crop density by row spacing, crop density by weed management treatment, row spacing by weed management treatment, and crop density by row spacing by weed management treatment. In all cases, achieved in-field crop density (plants m−2) per plot served as the continuous explanatory variable during analysis.
Crop-related effects were analyzed using a linear function, and weed-related effects were analyzed using exponential functions. The fit of all regression models was confirmed via the visual assessment of plotted data points and residuals by predicted plots. In addition, comparisons of regression and ANOVA models were made via lack of fit tests, properly classifying crop density as a continuous or categorical explanatory variable (Ritz et al. Reference Ritz, Kniss and Streibig2015).
First, full models were fit, initially consisting of 6 lines (2 interrow spacings × 3 weed management treatments) with 12 corresponding parameter estimates for the analyses of crop-related effects, and 4 curves (2 interrow spacings × 2 weed management treatments) with 8 corresponding parameter estimates for analyses of weed-related effects. Second, each model was reduced stepwise, omitting all factors that had no significant effect on parameter estimates (P ≥ 0.05; stepwise reduction procedures are detailed below). Thus, for each figure and table presented, treatments described by the same regression line and parameter estimates are not statistically different, and treatments described by differing regression lines and parameter estimates are statistically different.
Across all data sets, the assumption of normally distributed residuals was evaluated using the Shapiro-Wilk test (Shapiro and Wilk Reference Shapiro and Wilk1965). In the presence of a linear or curvilinear relationship, homoscedasticity was assessed via the visual inspection of residuals by predicted plots. In the absence of a linear or curvilinear relationship, homoscedasticity was assessed using the Levene test (Levene Reference Levene, Olkin, Ghurye, Hoeffdning, Madow and Mann1960). To resolve issues of nonnormality or heteroscedasticity, log and log(x + 1) transformations were implemented using the transform-both-sides method.
Linear regressions correctly described the relationship between crop density and all crop-related effects, except for spring barley yield in EXP2019 and EXP2020, in which cases three-way ANOVAs were carried out, wherein crop density was treated as a categorical variable, and subsequent means comparisons via Tukey’s HSD were made (α = 0.05). In all other instances, the relationship between crop density and crop-related effects, f 1 (x), including spring barley biomass, grain protein, grain bulk density, and TKW, were described using the linear model: ${f_1}{\rm{\;}}\left( x \right) = {a_{\left( {rw} \right)}} + {b_{\left( {rw} \right)}}{\rm{*}}c{\rm{\;\;\;\;\;\;\;\;\;\;}}r = 1,2;{\rm{\;}}w = 1,2,3$
where a represents the level of the dependent crop measure when crop density equals zero, b is the change in crop measure as crop density increases, and c is crop density; r1 and r2 represent RS15 and RS20, and w1, w2, and w3 represent WMTweedy, WMTtineharrow, and WMTherbicide, respectively. Crop response data sets were analyzed with the restricted maximum-likelihood approach in JMP® (version Pro 15.0.0, SAS Institute, Cary, NC, USA). Stepwise model reduction was warranted by nonsignificant effect tests (P ≥ 0.05) and reductions in the model Akaike information criterion (AIC).
Curvilinear relationships between crop density and weed-related effects were also confirmed via the visual assessment of plotted data points and residuals by predicted plots for the fitted regression model. In all cases, the relationship between crop density and weed biomass measures, f 2 (x), including surrogate and ambient weed biomass, was described using the exponential function: ${f_2}{\rm{\;}}\left( x \right) = {d_{\left( {rw} \right)}}{\rm{*}}exp{\rm{\;}}\left( { - {e_{\left( {rw} \right)}}{\rm{*}}c} \right){\rm{\;\;\;\;\;\;\;\;\;}}r = 1,2;{\rm{\;}}w = 1,2$
where d represents the amount of weed biomass when crop density equals zero, and e is the rate of weed biomass reduction as crop density increases.
Percent reduction in weed biomass as crop density increases, f 3 (x), can then be calculated using the function: ${f_3}{\rm{\;}}\left( x \right) = 100{\rm{\;}}\left[ {1 - exp\left( { - {e_{\left( {rw} \right)}}{\rm{*}}c} \right)} \right]{\rm{\;\;\;\;\;\;\;\;\;}}r = 1,2;{\rm{\;}}w = 1,2$
Weed biomass data were analyzed using the nonlinear mixed model PROC NLMIXED in SAS® (v. 9.4, SAS Institute, Cary, NC, USA). Contrasts among parameter estimates, changes in model AIC, and nonsignificant likelihood-ratio tests (P ≥ 0.05) guided stepwise model reduction.
Results and Discussion
An adequate range of spring barley densities (plants m−2) were achieved in both years (Table 2). While populations were lower than expected in EXP2020, crop densities ranging from 109 to 493 plants m−2 were observed, sufficient for conducting the intended analyses. Achieved surrogate weed densities were 51 (±6) plants m−2 in EXP2019 and 49 (±2) plants m−2 in EXP2020 (data not shown), comparable to the target of 40 plants m−2. In EXP2019, the average within-field ambient weed density was 531 (±14) plants m−2, with the three most abundant ambient weed species being common lambsquarters (Chenopodium album L.), speedwell (Veronica sp.), and common chickweed [Stellaria media (L.) Vill.], comprising 55%, 11%, and 10% of weed seedlings, respectively. In EXP2020, average ambient weed density was 353 (±6) plants m−2, 61% C. album, 11% prostrate knotweed (Polygonum aviculare L.), and 7% mustard (Brassica sp.) were present.
Table 2. Mean spring barley crop densities achieved in 2019 (EXP2019) and 2020 (EXP2020) across treatment plots with target densities of 200 (CD200), 300 (CD300), 400 (CD400), and 500 (CD500) plants m−2.

a SEs are presented in parentheses.
Average monthly temperatures from April to August, when experiments were implemented, were comparable with one another and with the 10-year average (Supplementary Table 1). Differences in monthly precipitation totals for EXP2019 and EXP2020 are not presumed to have impacted experimental outcomes, with the exception of there being 70% less rainfall in May 2020 compared with May 2019 (Supplementary Table 2), which likely affected preemergence tine-harrowing efficacy; this is addressed in the following section.
Intrarow Weed Biomass
Outcomes from the present study support our central hypothesis; increasing crop density reliably reduced intrarow surrogate (Figure 1; Table 3) and ambient weed biomass (Figure 2; Table 4) within the hoed cereal system. Our findings complement effects summarized by Mohler (Reference Mohler, Liebman, Mohler and Staver2001), who found that increasing crop density consistently decreased weed biomass across the inter- and intrarow zones among 12 experiments in barley. Notably, the rate of intrarow weed biomass reduction (parameter e in Equations 2 and 3) was very similar across years, irrespective of weed management treatment and row spacing (Figure 3). The only instance where e deviated considerably was for EXP2019 ambient weed biomass in WMTtineharrow RS15 plots, when the parameter was 2.26 to 2.64 times greater compared with other estimates (Table 4). Excluding EXP2019 WMTtineharrow RS15 ambient weed biomass results, within the range of crop densities tested (CD200 to CD500), intrarow surrogate and ambient weed biomass were reduced by 49% to 82% and 53 to 86%, respectively (Figure 3). The effect that increasing seeding rate has on suppressing intrarow weeds is an important result, one that improves our understanding of how to limit potential yield and crop quality losses resulting from remaining competitive intrarow weeds in hoed cereals (Melander and McCollough Reference Melander and McCollough2020).
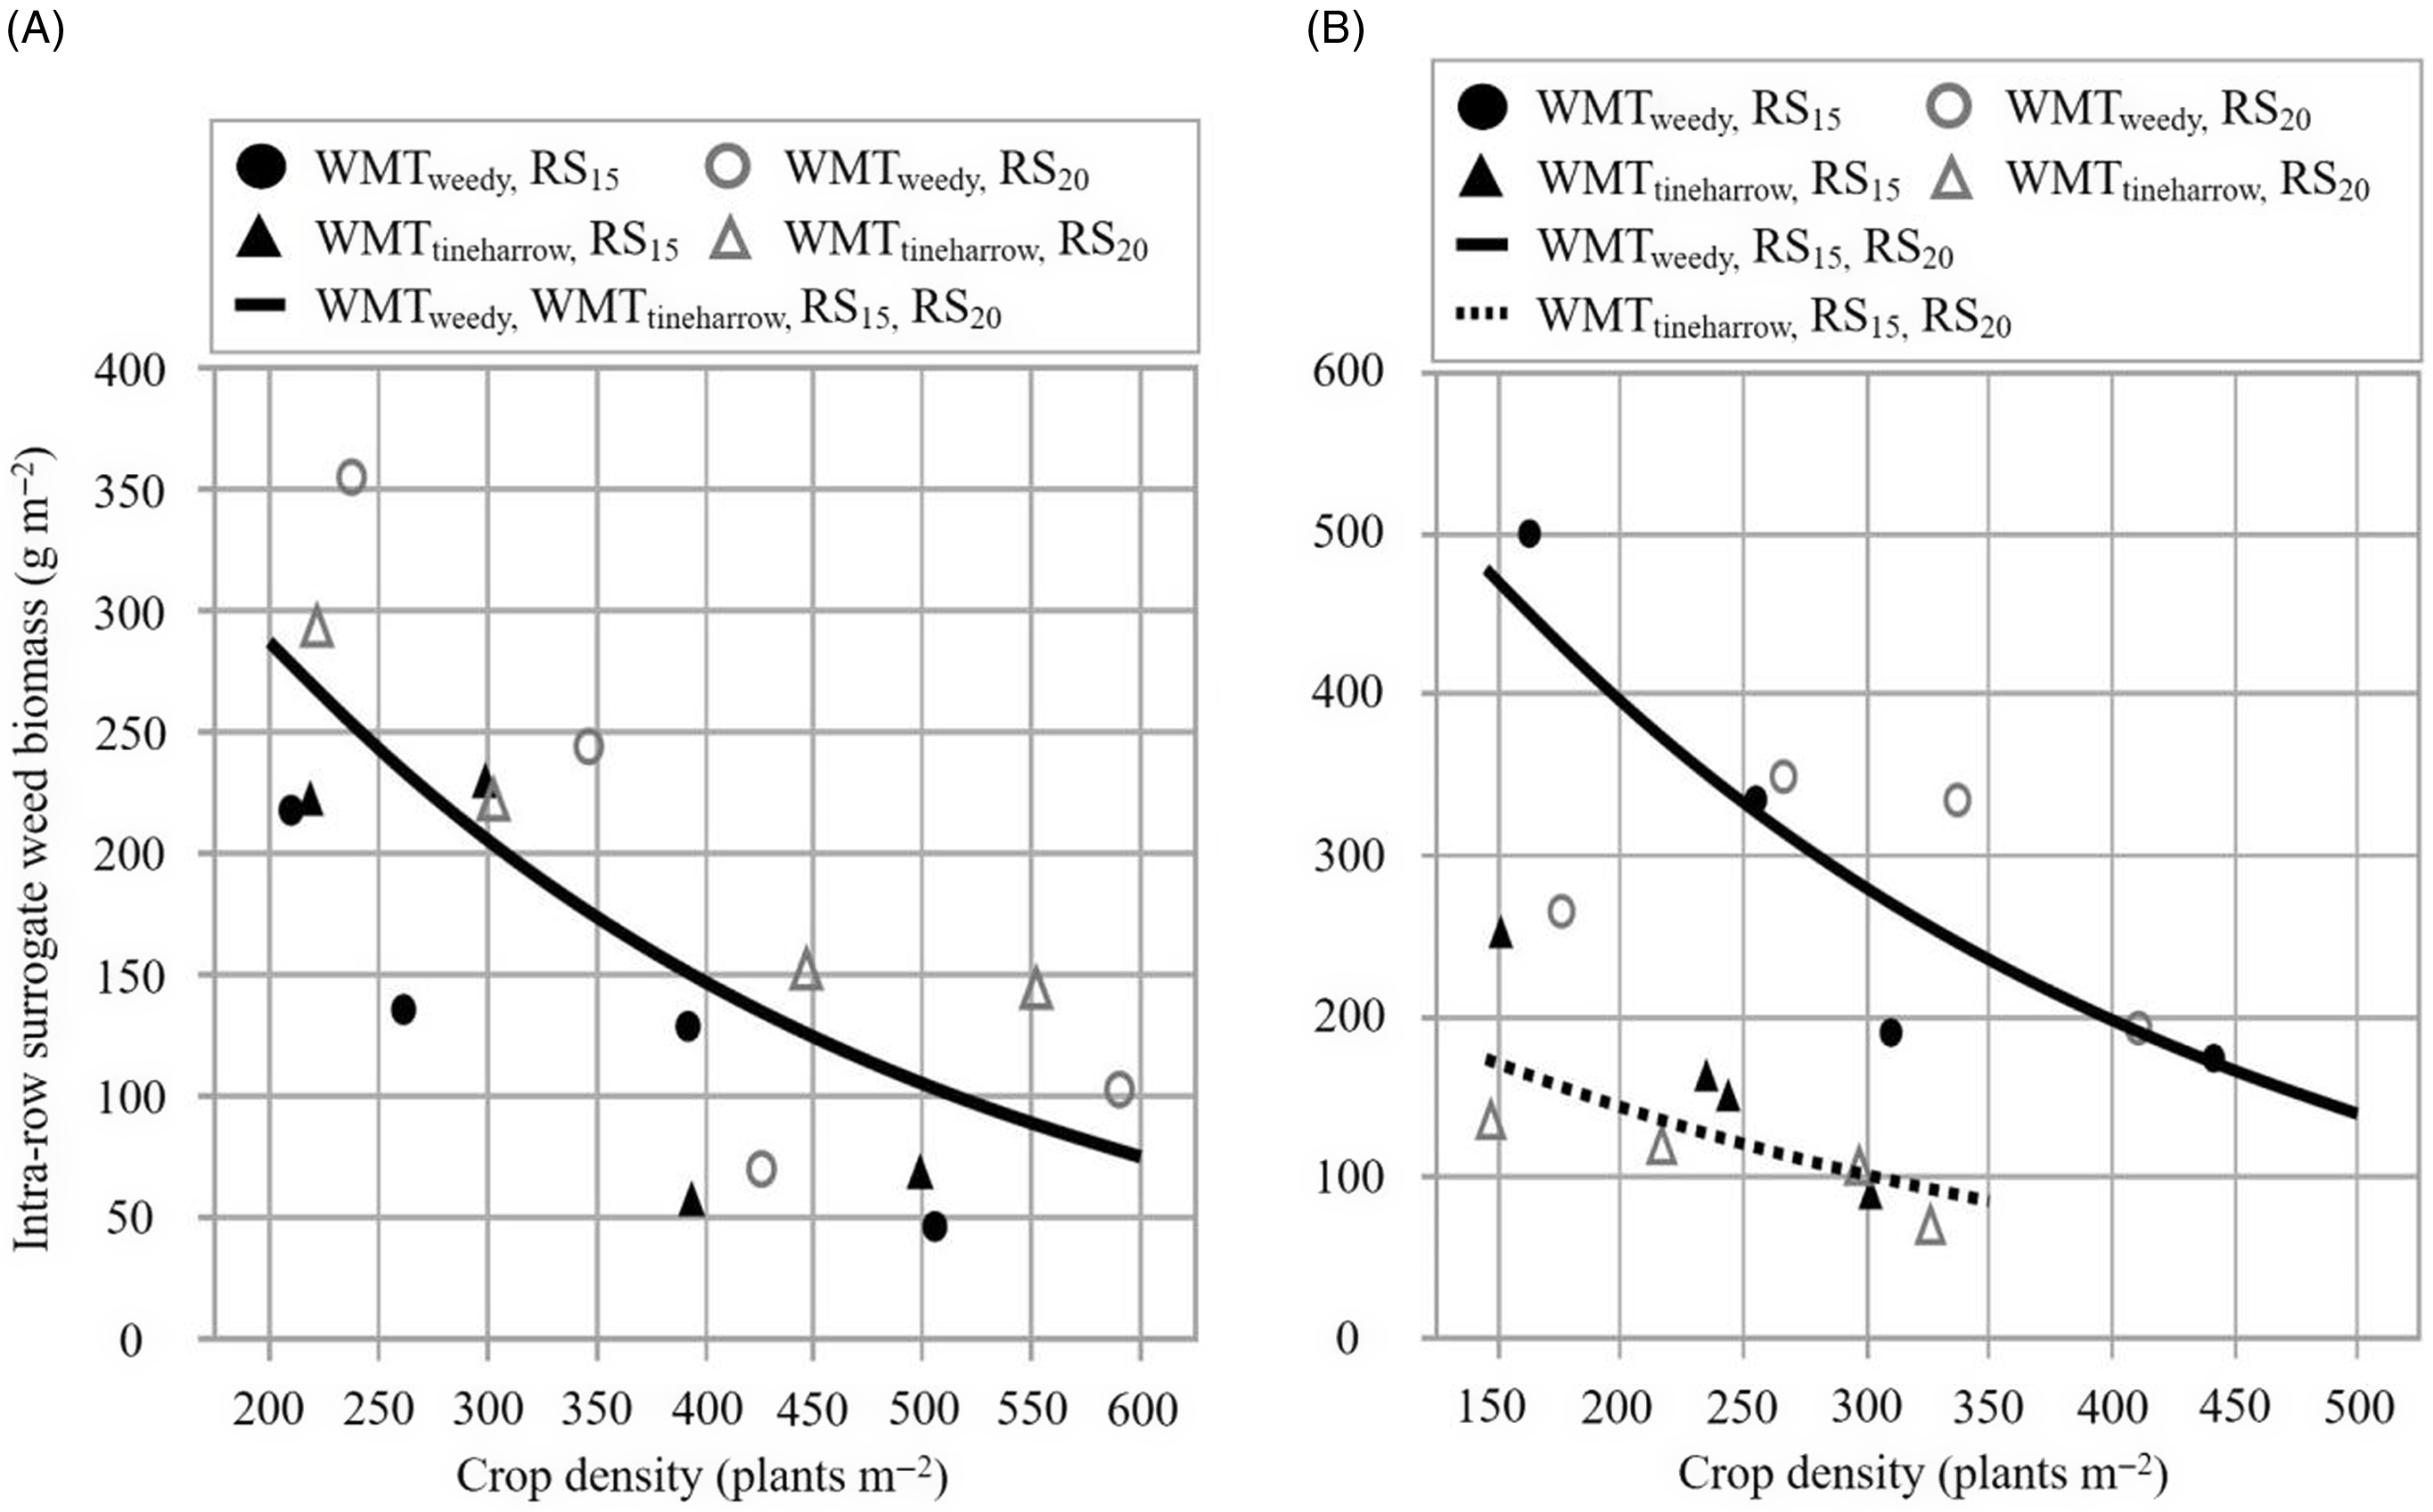
Figure 1. The relationship between intrarow surrogate weed biomass (g m−2; Sinapis alba) and crop density (plants m−2; barley). Observed values represent back-transformed means for two row spacings, 15 cm (RS15) and 20 cm (RS20), and two weed management treatments, receiving no additional weed management treatment (WMTweedy) and preemergence tine harrowing (WMTtineharrow), in 2019 (A, EXP2019) and 2020 (B, EXP2020). All plots received interrow hoeing. Data underwent a log(x + 1) transformation.
Table 3. Estimates of parameters d and e for intrarow surrogate weed (Sinapis alba) biomass from Equation 2, where d represents the amount of weed biomass when crop density equals zero, and e is the rate of weed biomass reduction as crop density increases. a

a Parameter estimates of the reduced model are shown for experiments performed in 2019 (EXP2019) and 2020 (EXP2020) among plots sown to 15 cm (RS15) and 20 cm (RS20) row spacings, receiving no additional weed management treatment (WMTweedy), and pre-emergence tine harrowing (WMTtineharrow). All plots received inter-row hoeing. Data underwent a log (x + 1) transformation.
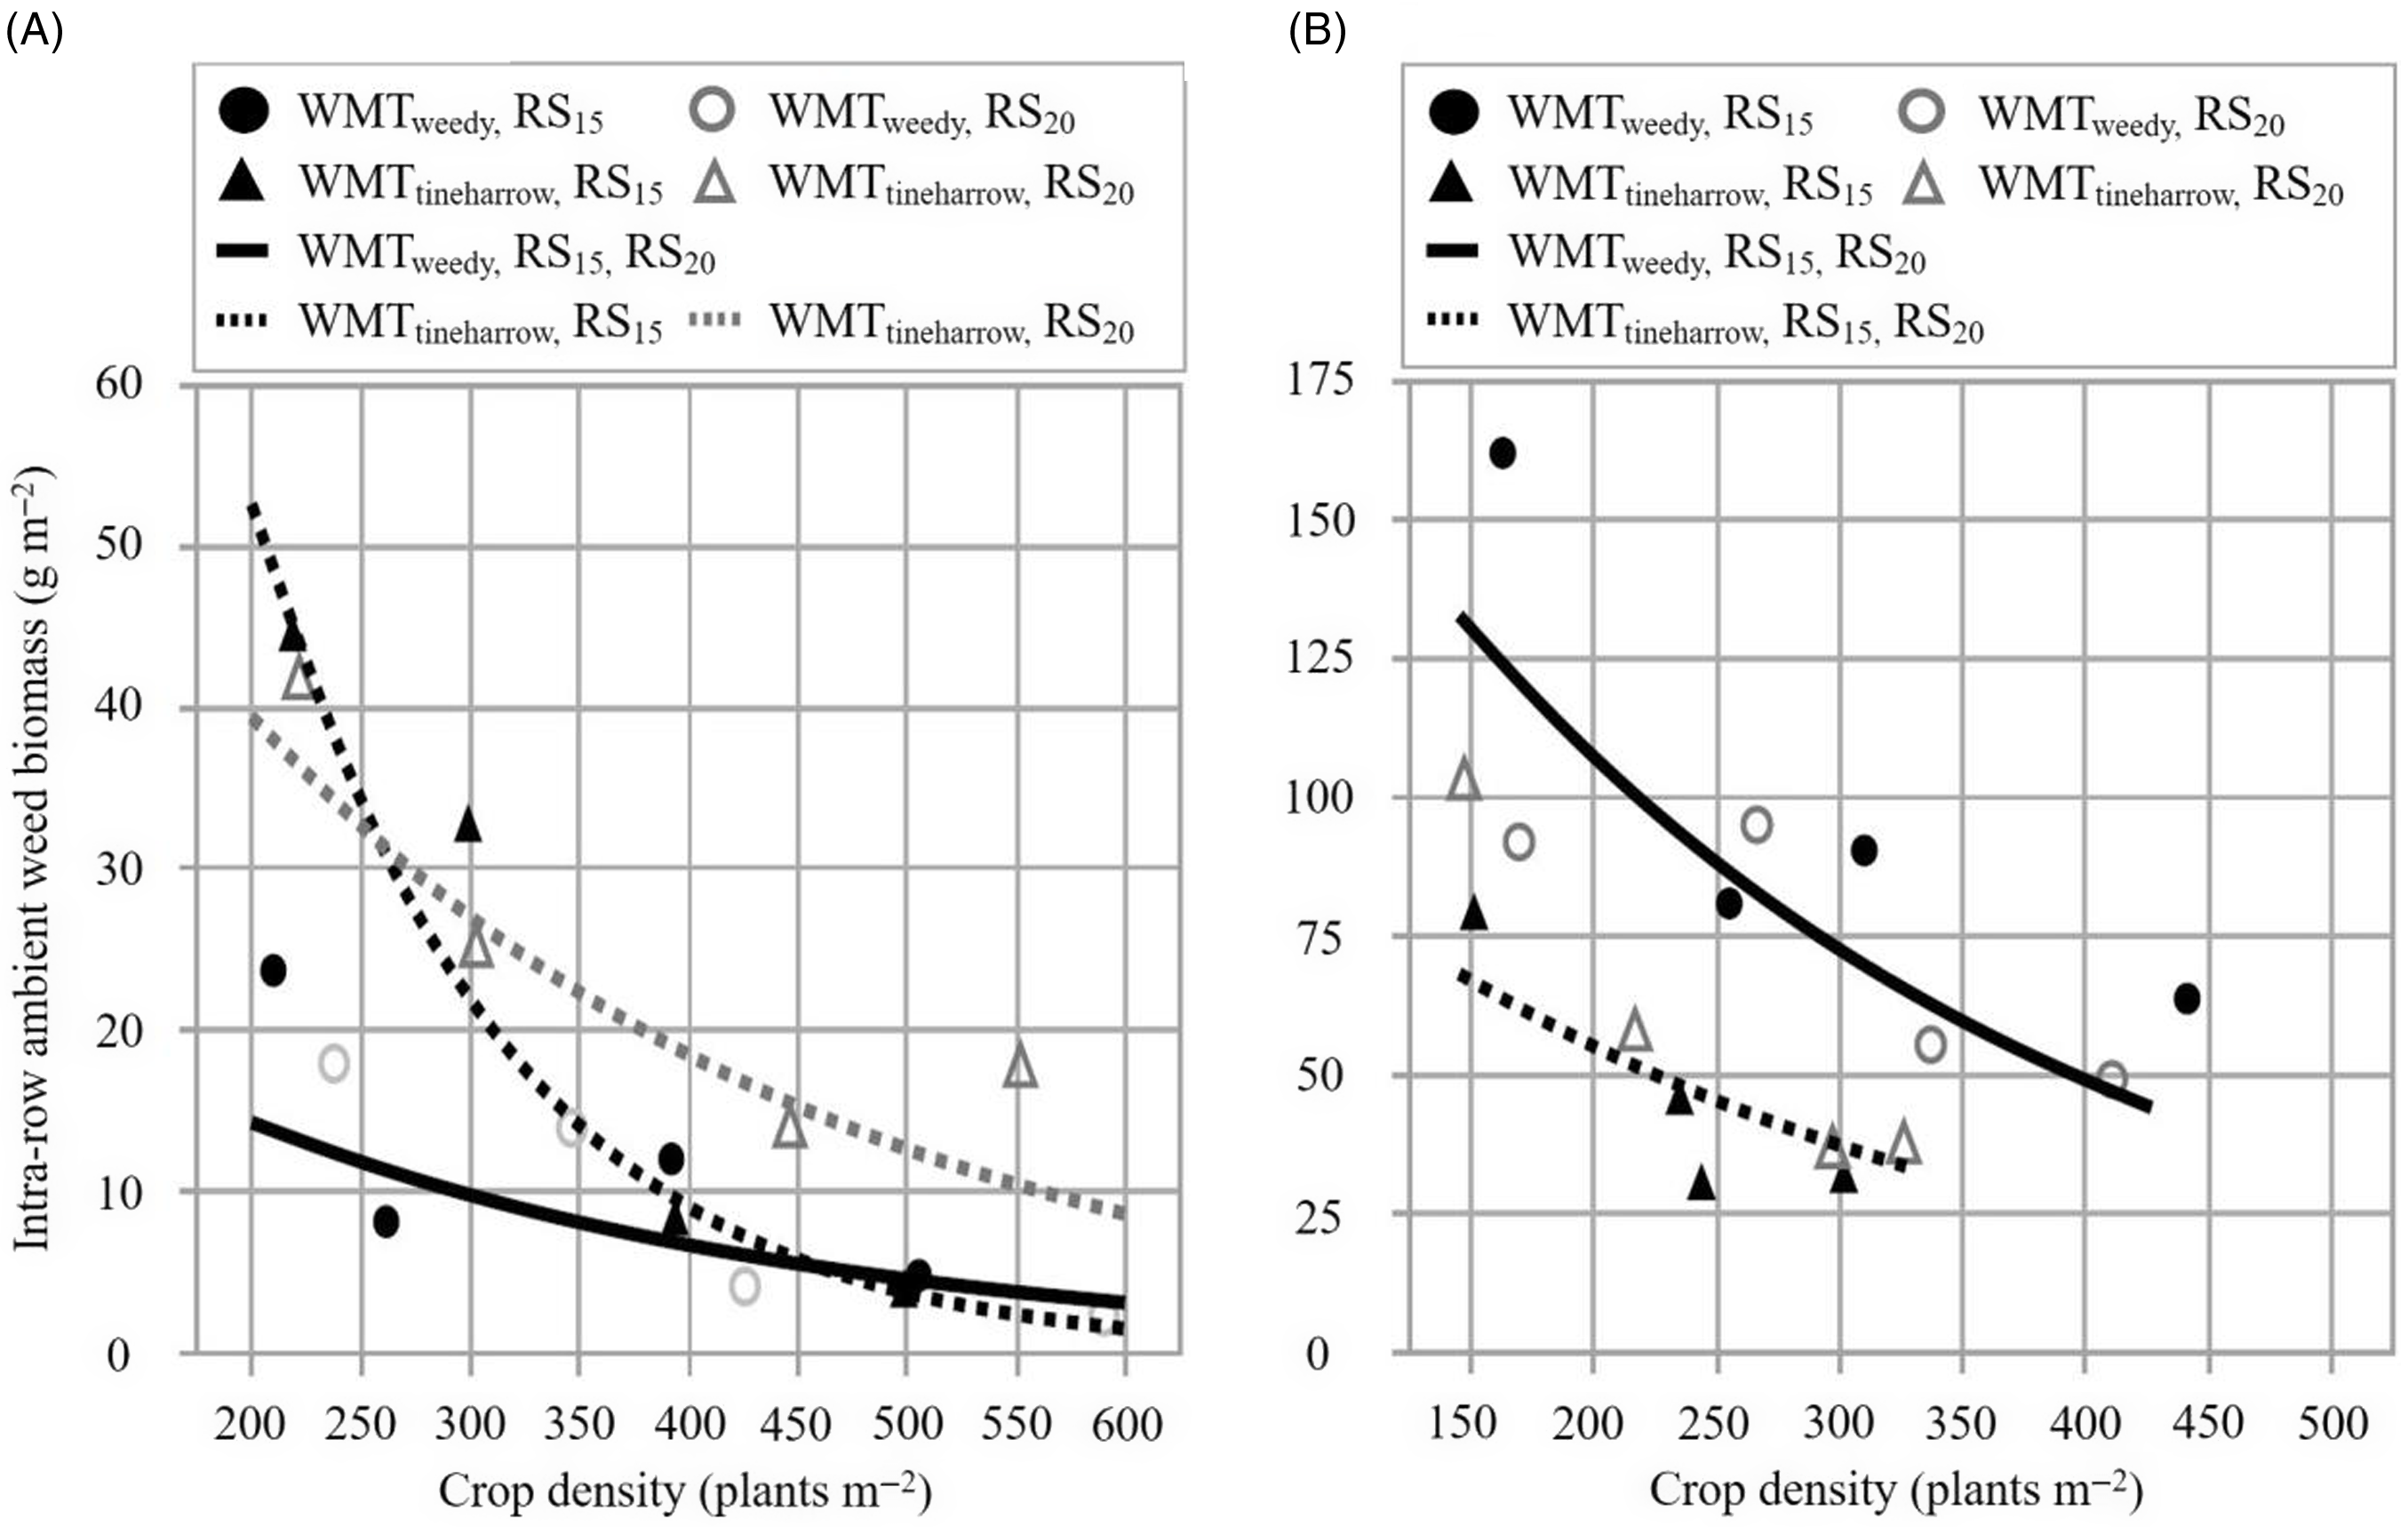
Figure 2. The relationship between intrarow ambient weed biomass (g m−2; assorted species) and crop density (plants m−2; barley). Observed values represent back-transformed means for two row spacings, 15 cm (RS15) and 20 cm (RS20), and two weed management treatments, receiving no additional weed management treatment (WMTweedy) and preemergence tine harrowing (WMTtineharrow), in 2019 (A, EXP2019) and 2020 (B, EXP2020). All plots received interrow hoeing. Data underwent a log(x + 1) transformation.
Table 4. Estimates of parameters d and e for intrarow ambient weed (assorted species) biomass from Equation 2, where d represents the amount of weed biomass when crop density equals zero, and e is the rate of weed biomass reduction as crop density increases. a

a Parameter estimates of the reduced model are shown for experiments performed in 2019 (EXP2019) and 2020 (EXP2020) among plots sown to 15-cm (RS15) and 20-cm (RS20) row spacings, receiving no additional weed management treatment (WMTweedy), and preemergence tine harrowing (WMTtineharrow). All plots received interrow hoeing. Data underwent a log(x + 1) transformation.

Figure 3. Prediction of percent reduction (%) in intrarow surrogate (gray; Sinapis alba) and ambient weed biomass (black; assorted species) as crop density (plants m−2; barley) increases. Curves are calculated on the basis of parameter estimates in Tables 3 and 4 for two row spacings, 15 cm (RS15) and 20 cm (RS20), and two weed management treatments, receiving no additional weed management treatment (WMTweedy) and preemergence tine harrowing (WMTtineharrow), in 2019 (dotted; EXP2019) and 2020 (solid; EXP2020). All plots received interrow hoeing.
Percent reduction of intrarow weed biomass was slightly higher for ambient weeds compared with surrogate weeds, comprising differences of 4.5% and 4.3% at CD300 in EXP2019 and EXP2020, respectively. The difference in response can be attributed to variation among ambient and surrogate weed groups in their competitive response and timing of weed seedling emergence relative to crop emergence (Håkansson Reference Håkansson and Håkansson2003). The ambient group is composed of numerous annual weeds differing in emergence periodicity and competitive ability; both tall and low-growing weeds were among the three most abundant species in each year. In contrast, the surrogate weed, S. alba, was selected to ensure a uniform stand of competitive brassica species, possessing a tall and erect growth habit and resembling problematic wild weeds common in organic cereals: wild radish (Raphanus raphanistrum L.), field mustard (Brassica rapa L.), and charlock mustard (Sinapis arvensis L.). Studies evaluating the effects of crop density on weed biomass originating from both intra- and interrow zones have also observed greater control among weeds emerging later than the crop and less competitive species (Håkansson Reference Håkansson and Håkansson2003); therefore, it is unsurprising to observe a similar effect here. The response of both ambient and surrogate weeds is very similar; this strongly suggests that increasing crop density is a reliable management strategy for suppressing intrarow weeds of varying morphologies and competitive abilities.
Notably, the greatest reductions in intrarow weed biomass are achieved by increasing from low to moderate crop densities, with diminishing returns as seeding rate increased. For example, excluding EXP2019 WMTtineharrow RS15 ambient weed biomass data and rounding to the nearest whole number among all other treatments, increasing from CD200 to CD300 reduces intrarow surrogate and ambient weed biomass by 15%, whereas increasing from CD300 to CD400 and CD400 to CD500 corresponds with 10% and 7% reductions, respectively. Although an economic evaluation is not within the scope of the present study, the severity of weed infestation will determine whether increasing crop density beyond the standard 300 plants m−2 is viable. For example, in organic spring barley, Kolb et al. (Reference Kolb, Gallandt and Molloy2010) reported that due to the high cost of organic seed, increasing seeding rate as a weed control strategy was only economically viable in situations where weed density was high.
The effect of preemergence tine harrowing on weeds was variable among years. In EXP2020, WMTtineharrow reduced surrogate weed density and ambient weed density by 43% (P < 0.0001; data not shown) and 20% (P = 0.0003; data not shown) relative to WMTweedy, respectively. This decrease in weed density corresponded with a decrease in intrarow surrogate (Figure 1; Table 3) and ambient weed biomass (Figure 2; Table 4) of 64% and 52%, respectively, at CD300. In EXP2019, WMTtineharrow did not reduce surrogate or ambient weed density relative to WMTweedy (P ≥ 0.05; data not shown). Intrarow surrogate weed biomass was not affected by weed management treatment (Figure 1; Table 3), and a 175% increase in ambient weed biomass was observed at CD300 for WMTtineharrow RS20 when compared with WMTweedy RS15 and RS20 plots (Figure 2; Table 4). Divergent results are emblematic of the variability in treatment outcomes resulting from tine harrowing. The success of harrowing partially depends on weed community composition; both the presence of established weed seedlings before crop emergence and the absence of late-emerging weeds (Lundkvist Reference Lundkvist2009). Field and weather conditions also play a decisive role in determining weed establishment before harrowing. Harrowing may be an effective weed management strategy, killing 21% to 90% of weed seedlings present (Gallandt et al. Reference Gallandt, Brainard, Brown and Zimdahl2018; Jabran et al. Reference Jabran, Mahmood, Melander, Bajwa, Kudsk and Sparks2017); however, the uniform shallow soil disturbance caused by tine harrowing can also stimulate weed seed germination (Cirujeda and Taberner Reference Cirujeda and Taberner2004; Kees Reference Kees1962), especially if precipitation follows cultivation. In both experimental years, rainfall likely affected the efficacy of preemergence tine harrowing. Low precipitation in May 2020 (63% less than the 10-yr average; Supplementary Table 2), following preemergence tine harrowing (Table 1), likely contributed to the positive outcome of reduced intrarow ambient weed biomass in EXP2020 WMTtineharrow plots. In May 2019, total precipitation was 231% greater compared with May 2020, likely contributing the increase in ambient weed biomass observed among EXP2019 WMTtineharrow plots.
Notably, ambient weed biomass in WMTtineharrow RS15 plots responded differently from WMTtineharrow RS20 in EXP2019; this is the only instance where row spacing impacted weed biomass. In this case, an interaction was present between row spacing and weed management treatment, whereby e, the rate of ambient weed biomass decline in response to increasing crop density, was estimated to be far greater than all other treatments (Figures 2 and 3; Table 4).
While decreasing row spacing is an effective method for suppressing the growth of weeds (Mohler Reference Mohler, Liebman, Mohler and Staver2001; Regnier and Bakelana Reference Regnier and Bakelana1995); the effect of increasing crop density from 200 to 500 plants m−2 should be far greater than that of reducing interrow row distance by 5 cm (Zimdahl Reference Zimdahl and Zimdahl2004), as was observed in the present study. Also, the weed suppressive effect of decreasing row spacing within hoed cereals may be less significant when compared with instances in which full-width tine harrowing or no additional direct control tactics are used (Rasmussen and Svenningsen Reference Rasmussen and Svenningsen1994). When interrow weeds are controlled by hoeing, increasing row spacing while maintaining seeding rate has opposing effects on intrarow weeds, simultaneously (1) delaying crop canopy closure and increasing light penetration into the intrarow zone (Kolb et al. Reference Kolb, Gallandt and Mallory2012) and (2) increasing intrarow crop density and the crop’s competitive advantage over weeds. Because light capture is a primary driver of competition in cereals (Didon and Boström Reference Didon and Boström2003), wide row sowing in hoed cereals can improve growth among surviving intrarow weeds (Kolb et al. Reference Kolb, Gallandt and Molloy2010; McCollough et al. Reference McCollough, Gallandt, Darby and Molloy2020a).
Crop Yield and Biomass
Spring barley yield (kg ha−1) did not increase with increasing crop density in either year. While a lack of relationship between crop yield and crop density is unexpected (Mohler Reference Mohler, Liebman, Mohler and Staver2001), it is not unfounded (O’Donovan et al. Reference O’Donovan, Turkington, Edney, Clayton, McKenzie, Juskiw, Lafond, Grant, Brandt, Harker, Johnson and May2011; Pageau Reference Pageau1991). Spring barley has the capacity to tiller readily, which contributes to the crop’s ability to stabilize yield. As crop density increases, the number of tillers per plant (Simmons et al. Reference Simmons, Rasmusson and Wiersma1982), fertile heads per plant, and kernels per head decrease (Pageau Reference Pageau1991; Thomason et al. Reference Thomason, Brooks, Griffey and Vaughn2009). Due to a lack of yield response in the present study, we cannot recommend optimized seeding rates for hoed cereals based on Mohler’s (Reference Mohler, Liebman, Mohler and Staver2001, p. 276) definition, that optimal density is achieved when “a further increment of seed costs more than the expected increase in yield is worth.” Instead of optimizing for economic return, increasing seed costs must be weighed against other favorable outcomes, including reduced weed biomass and possible weed seedbank withdrawals (Jabbour et al. Reference Jabbour, Gallandt, Zwickle, Wilson and Doohan2017; Liebman and Gallandt Reference Liebman, Gallandt and Jackson1997).
The main effect of row spacing was consistent across years; RS20 yields were on average lower than RS15 by 7% in EXP2019 and 8% in EXP2020 (Figure 4). Yield loss at RS20 can be attributed to the intensification of intrarow crowding and intraspecific competition as row spacing increases and density is maintained (Weiner et al. Reference Weiner, Greipentrog and Kristensen2001). For example, as row spacing widened from RS15 to RS20 within the present study, crop density in the intrarow zone would be expected to increase by 33%. See Supplementary Table 3 comparing full-width and intrarow target and achieved crop densities for RS15 and RS20 plots. Sowing at narrower row spacings typically improves crop yields; however, the effect can be inconsistent (Mohler Reference Mohler, Liebman, Mohler and Staver2001). Olsen et al. (Reference Olsen, Kristensen, Weiner and Greipentrog2004) proposed that the intensity of intraspecific competition resulting from wide row sowing is reduced as weed density decreases due to the improved ability of the crop to readily access interrow resources when weeds are absent. However, in EXP2019, when an interaction between row spacing and weed management treatment was present, yield loss resulting from increasing interrow spacing was greatest in WMTherbicide plots. Crop yields at RS20 were 8% and 12% less than at RS15 in WMTtineharrow WMTherbicide, respectively, and no difference was observed among row spacings for WMTweedy. In EXP2019, crop yield in RS15 WMTherbicide was also 8% greater than in RS15 WMTtineharrow. Results that diverge from the scenario described by Olsen et al. (Reference Olsen, Kristensen, Weiner and Greipentrog2004) reflect our working within the hoed cereal system; interrow weeds are controlled across weed management treatments with aggressive cultivation, diminishing the expected benefits of herbicide use. In EXP2020, an effect of weed management treatment was present: crop yields in WMTtineharrow and WMTherbicide were 9% and 10% less than in WMTweedy, respectively; this outcome was not expected.
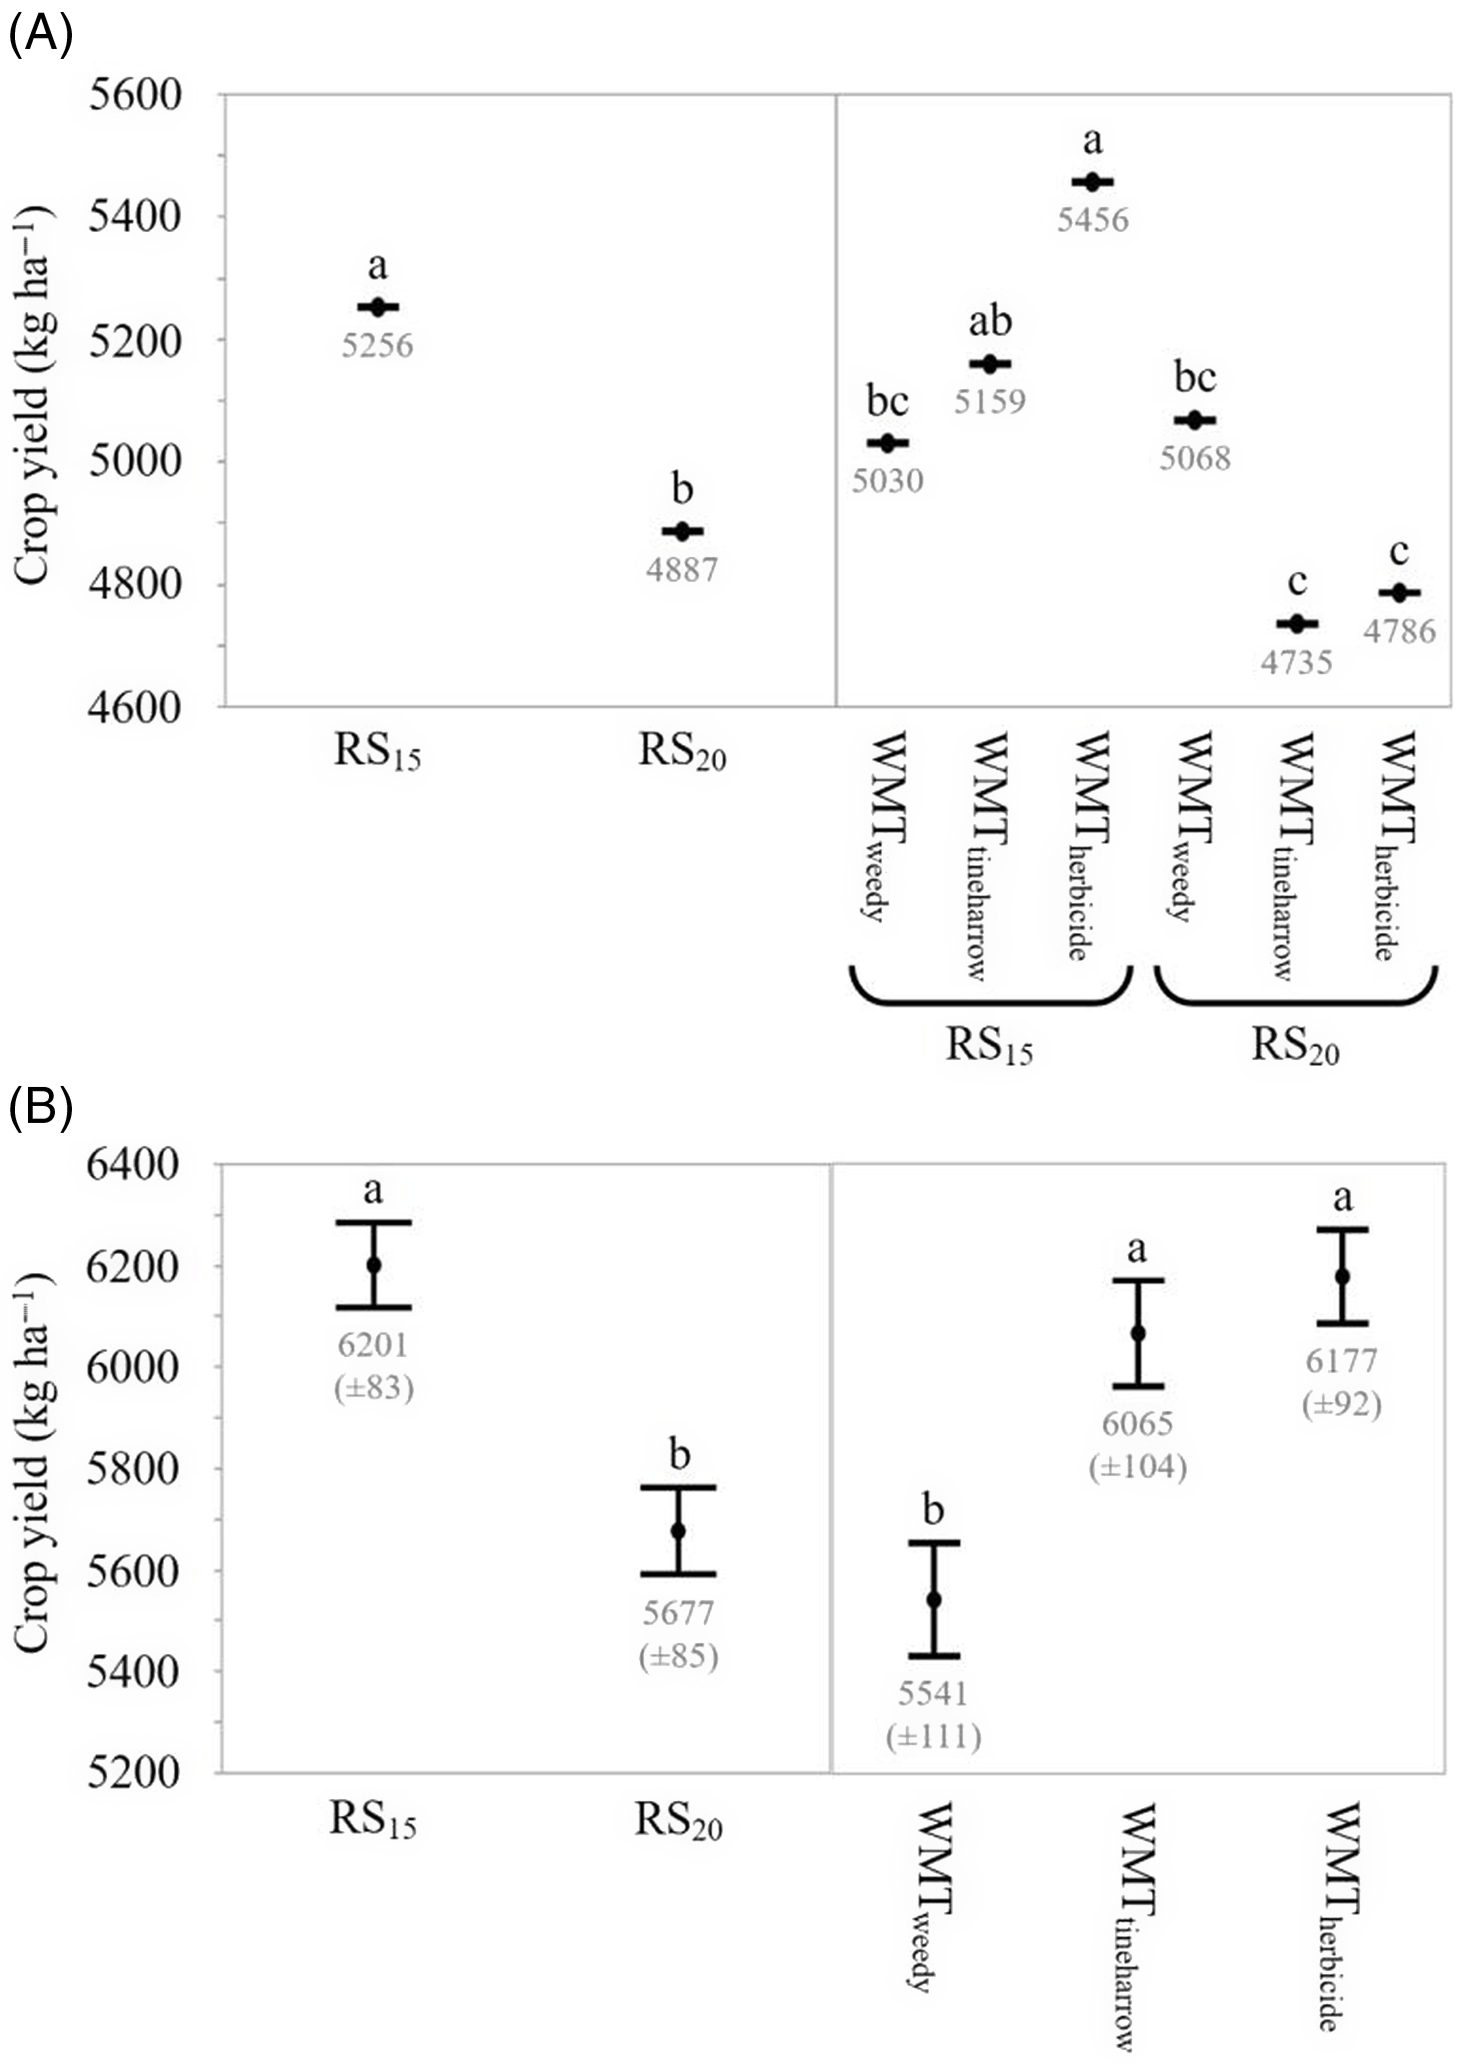
Figure 4. The effect of row spacing and weed management treatment on crop yield (g m−2; barley). Crop density (plants m−2) did not affect crop yield in either site year. Observed values represent means of the reduced model for two row spacings, 15 cm (RS15) and 20 cm (RS20), and three weed management treatments, receiving treatment with herbicide (WMTherbicide), no additional weed management treatment (WMTweedy), and preemergence tine harrowing (WMTtineharrow), in 2019 (A, EXP2019) and 2020 (B, EXP2020). All plots received interrow hoeing. EXP2019 data underwent a log10 transformation; back-transformed means are presented.
Crop biomass (g m−2) was unaffected by treatment variables in EXP2019. Again, spring barley’s plasticity and tillering capacity likely contributed to the absence of expected effects in this year. In EXP2020, in alignment with expected outcomes (Håkansson Reference Håkansson and Håkansson2003), barley biomass increased with increasing crop density at a rate of 35.5 g m−2 per 100 plants m−2 (Supplementary Figure 1; Supplementary Table 4). Crop biomass was also 6% greater in WMTherbicide plots than in WMTweedy and WMTtineharrow. Crop biomass did not, however, differ among row spacings tested.
Grain Quality Parameters
Grain protein (%) in EXP2019 decreased slightly in response to increasing crop density, at a rate of −0.12% per 100 plants m−2; however, no correlation was observed in EXP2020 (Supplementary Figure 2; Supplementary Table 5). While it was expected that grain protein would decline with increasing crop density due to the intensification of intraspecific competition, both negative and null effects among cereals have been observed (Boström et al. Reference Boström, Anderson and Wallenhammar2012; McKenzie et al. Reference McKenzie, Middleton and Bremer2005). Weed management treatment did not affect grain protein in EXP2019, whereas in EXP2020, protein was reduced by 3% and 2% in WMTtineharrow plots compared with WMTweedy and WMTherbicide, respectively. In addition, row spacing did not influence grain protein in either year. Increases in grain protein among cereal crops at wider interrow spacings have been reported, likely due to a corresponding increase in nutrient availability (Boström et al. Reference Boström, Anderson and Wallenhammar2012; Hiltbrunner et al. Reference Hiltbrunner, Liedgens, Stamp and Streit2005; Siemens Reference Siemens1963); however, a difference in interrow spacing of 5 cm may not be enough to see results. The interpretation of protein response depends upon the crop’s intended use. To meet malting barley quality standards in Europe, grain protein must fall within the range of 9.5% to 11.5% (Pettersson Reference Pettersson2006); whereas, barley exceeding 11.5% is regularly sold as livestock feed (Bhatty et al. Reference Bhatty, Christison, Sosulski, Harvey, Hughes and Berdahl1974). Notably, there is a financial incentive to achieve malting quality; selling price was 15% greater than for feed barley in 2020 among reporting member states of the European Union (EuroStat 2021). Given that surplus protein often prevents growers from achieving malting quality standards (Mills et al. Reference Mills, Izydorczyk, Choo, Durand, Mountain, Sorrells and Fillmore2021), a reduction in protein may be interpreted as a positive effect in many cases.
Barley TKW (g) response to increasing crop density (parameter b) differed among weed management treatments in EXP2019 (Figure 5; Table 5). An increase in 100 plants m−2 corresponded with a TKW increase of 0.97 g and 0.35 g in WMTweedy and WMTtineharrow treatments, respectively; however, for WMTherbicide, a slight decrease of −0.27 g per 100 plants m−2 was observed. TKW is expected to decline in the absence of weeds as crop density and intraspecific competition increase (Mills et al. Reference Mills, Izydorczyk, Choo, Durand, Mountain, Sorrells and Fillmore2021; O’Donovan et al. Reference O’Donovan, Turkington, Edney, Juskiw, McKenzie, Harker, Clayton, Lafond, Grant, Brandt, Johnson, May and Smith2012). However, in the presence of weeds, the negative effects of increasing crop density may be offset by the suppression of intrarow weeds. Melander and McCollough’s (Reference Melander and McCollough2020) results indicate that an increase in intrarow weed density has a greater negative impact on barley TKW than increasing crop density; as the intrarow surrogate weed S. alba increased by 100 plants m−2, a decrease in TKW of 1.4 to 3.2 g was observed. In the present study, TKW response to row spacing differed among weed management treatments; as row spacing increased, TKW decreased in WMTtineharrow and increased in WMTweedy and WMTherbicide. The observed increase in TKW as row spacing increased from RS15 to RS20 was also 5.8 times greater in WMTweedy than WMTherbicide. Inconsistent effects of row spacing on barley TKW have been previously reported (Melander et al. Reference Melander, Jabran, Notaris, Znova, Green and Olesen2018), with both positive (Siemens Reference Siemens1963) and negative (Pageau Reference Pageau1991) effects observed. In EXP2020, differences in b were not observed; across treatments, TKW decreased at a rate of −0.86 g per 100 plants m−2. Less ambient weed biomass overall in EXP2019 may also help to explain stronger TKW effects in EXP2020. On average, TKW was 2% greater in WMTherbicide plots than in WMTweedy and WMTtineharrow, and no differences among row spacings were observed.
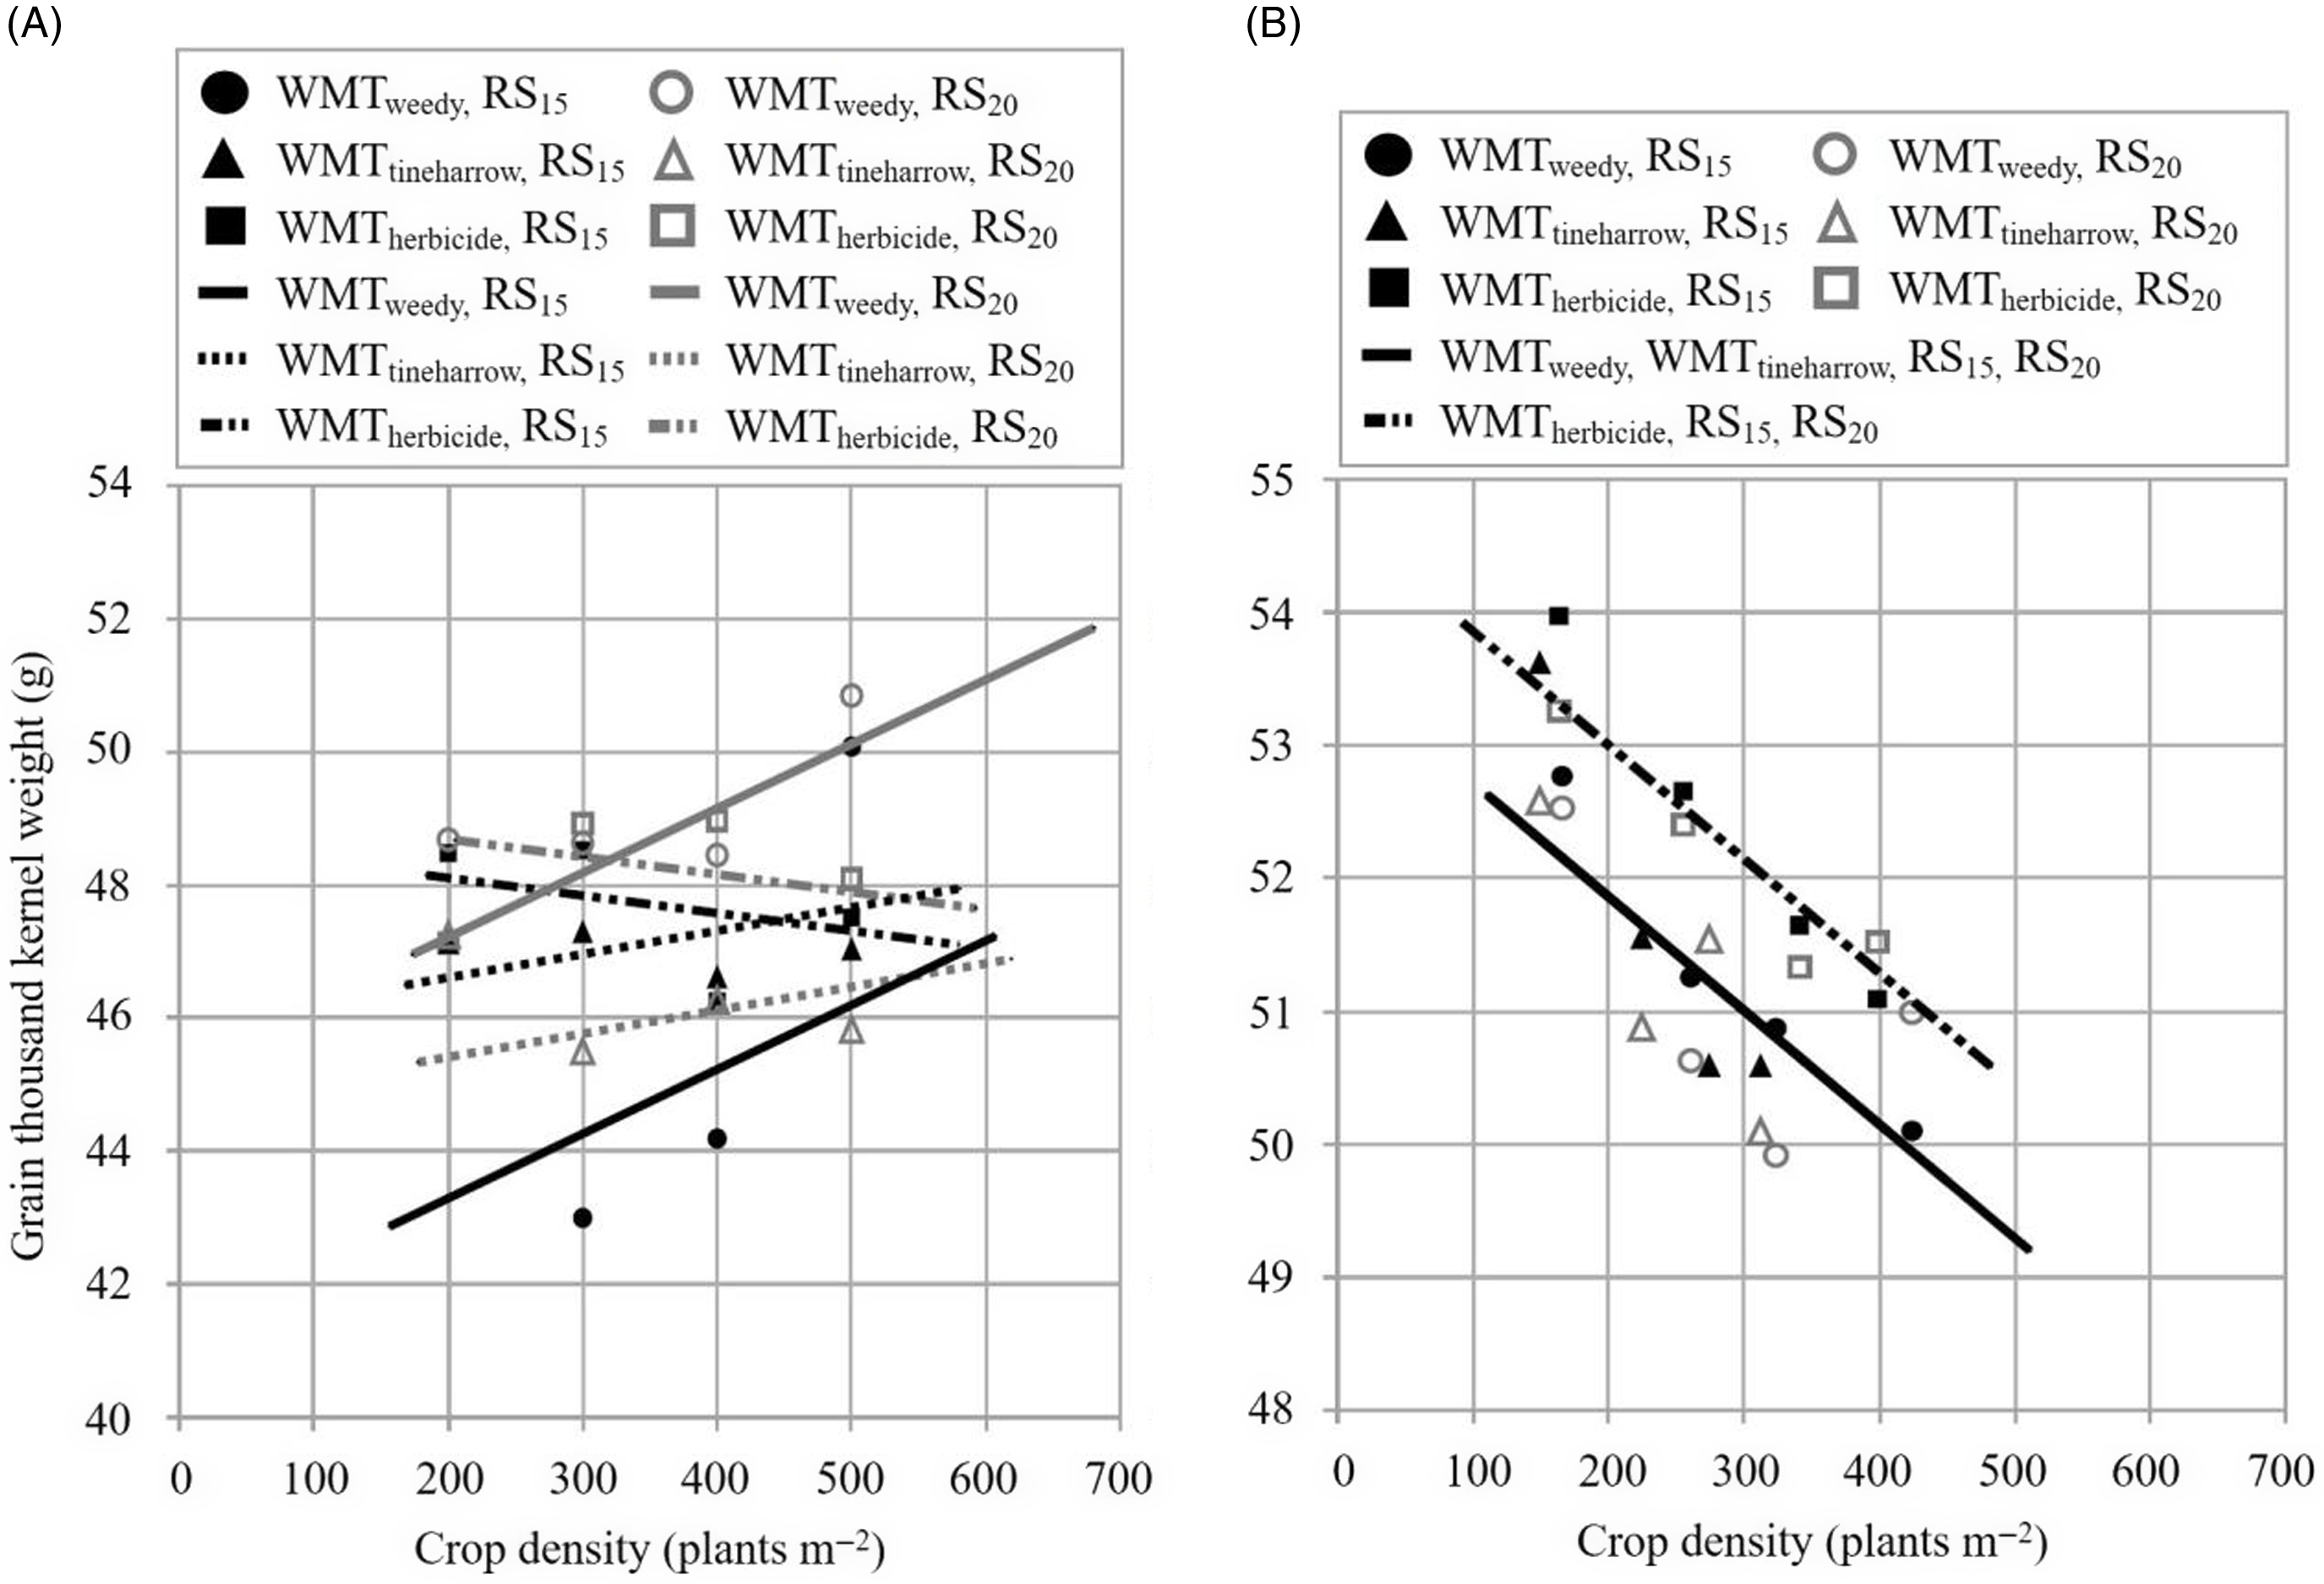
Figure 5. The relationship between grain 1,000-kernel weight (g; barley) and crop density (plants m−2). Observed values represent means for two row spacings, 15 cm (RS15) and 20 cm (RS20), and three weed management treatments, receiving treatment with herbicide (WMTherbicide), no additional weed management treatment (WMTweedy), and preemergence tine harrowing (WMTtineharrow), in 2019 (A, EXP2019) and 2020 (B, EXP2020). All plots received interrow hoeing.
Table 5. Estimates of parameters a and b for spring barley grain 1,000-kernel weight (TKW) from Equation 1, where a represents TKW when crop density equals zero, and b is the change in TKW as crop density increases.
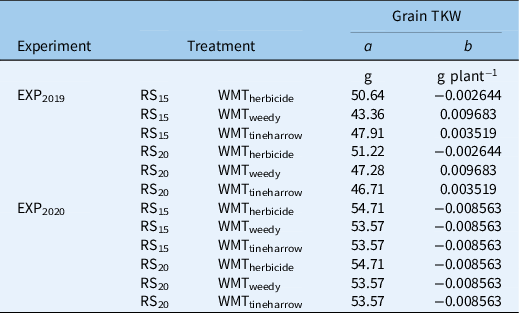
aParameter estimates of the reduced model are shown for experiments performed in 2019 (EXP2019) and 2020 (EXP2020) among plots sown to 15-cm (RS15) and 20-cm (RS20) row spacings, receiving treatment with herbicide (WMTherbicide), no additional weed management treatment (WMTweedy), and preemergence tine harrowing (WMTtineharrow). All plots received interrow hoeing.
Grain bulk density (kg hl−1) decreased with increasing crop density in both years, an increase in crop density of 100 plants m−2 corresponded with a reduction of −0.606 in EXP2019 and −0.541 kg hl−1 in EXP2020 (Supplementary Figure 3; Supplementary Table 6). Results are consistent with anticipated outcomes. Increasing a crop’s population in-field typically has a negative effect on grain bulk density (Mills et al. Reference Mills, Izydorczyk, Choo, Durand, Mountain, Sorrells and Fillmore2021), although variable and null effects have also been observed (Pageau Reference Pageau1991; Thomason et al. Reference Thomason, Brooks, Griffey and Vaughn2009). In EXP2020, grain bulk density was only slightly greater in WMTherbicide (1%) compared with WMTweedy and WMTtineharrow; row spacing had no effect in either year.
Additional Intrarow Weed Management Strategies in the Hoed Cereal System
In addition to preemergence tine harrowing and the adjustment of crop density and row spacing, other suitable intrarow weed management strategies exist for the hoed cereals system. Postemergence tine harrowing remains a valuable tactic to be used alone or in combination with preemergence harrowing (Brandsæter et al. Reference Brandsæter, Mangerud and Rasmussen2012); however, crop damage (Lundkvist Reference Lundkvist2009) and variable efficacy (Gallandt et al. Reference Gallandt, Brainard, Brown and Zimdahl2018; Jabran et al. Reference Jabran, Mahmood, Melander, Bajwa, Kudsk and Sparks2017) exist as drawbacks to employing this tactic. Stacking hoeing and postemergence tine-harrowing cultivation events has shown promising results, providing some control in the intrarow zone while increasing efficacy in the interrow by 14% to 22% compared with hoeing alone (Gerhards et al. Reference Gerhards, Kollenda, Macheb, Moller, Butz, Reiser and Griegentrog2020). Combining hoeing and harrowing may also provide a greater boost in efficacy against taprooted weeds, such as scentless mayweed [Tripleurospermum maritimum ssp. inodorum (L.) Appleq.], than shallowly rooted weeds, such as S. media (Rasmussen and Sveningsen Reference Rasmussen and Svenningsen1994).
Hoeing with rigid flat shares, as was done in the present study, limits sideward soil movement into the crop row, reducing crop soil cover and limiting intrarow weeds’ burial (Machleb et al. Reference Machleb, Kollenda, Peteinatos and Gerhards2018). In contrast, Gerhards et al. (Reference Gerhards, Kollenda, Macheb, Moller, Butz, Reiser and Griegentrog2020) purposefully threw soil into the crop row by hoeing at high speeds with ducks-foot shares, achieving intrarow weed control of 21% to 54% when hoeing at 4 km h−1 and 31% to 91% at 8 km h−1. Furthermore, the adoption of new technologies that enable the accurate operation of hoe blades closer to the crop row will also improve weed control by reducing the area of the uncultivated intrarow zone. To attain the degree of intrarow weed control cited earlier, Gerhards et al. (Reference Gerhards, Kollenda, Macheb, Moller, Butz, Reiser and Griegentrog2020) used improved methods for row detection (Tillet et al. Reference Tillet, Hauge and Miles2002). As a result, they successfully hoed between 15-cm rows with 10-cm shares, leaving a narrow uncultivated 5-cm intrarow zone.
A robust theoretical argument also exists for further optimizing the crop’s spatial arrangement (Fischer and Miles Reference Fischer and Miles1973; Regnier and Bakelana Reference Regnier and Bakelana1995; Weiner et al. Reference Weiner, Greipentrog and Kristensen2001). Instead of planting in standard rows where the crop is crowded into a narrow line, sowing in a random pattern within a 5- to 20-cm wide band may reduce competition among crop plants while increasing intraband weed suppression. However, outcomes have varied among studies evaluating band sowing and hoeing (McCollough et al. Reference McCollough, Gallandt, Darby and Molloy2020a, Reference McCollough, Gallandt and Molloy2020b; Speelman Reference Speelman1975), and further research is needed to validate the theoretical benefits of this strategy.
Methods evaluated in the present study are also highly relevant within integrated weed management (IWM). By combining herbicide use with physical and cultural control strategies (e.g., interrow hoeing, preemergence tine harrowing, and the alteration of crop density and row spacing), one can delay and reduce the risk of herbicide resistance developing (Riemens et al. Reference Riemens, Sønderskov, Moonen, Storkey and Kudsk2022). For example, combining interrow hoeing and intrarow band spraying can effectively decrease herbicide use while maintaining crop yields (Abu-Hamdeh Reference Abu-Hamdeh2003; Loddo et al. Reference Loddo, Scarabel, Sattin, Pederzoli, Morsiani, Canestrale and Tommasini2020). Similarly, suppressing weed growth via the alteration of crop density and row spacing and implementing preemergence tine harrowing are each highly applicable for IWM programs.
In summary, increasing crop density is an effective and reliable method for controlling intrarow weeds in hoed cereals; both intrarow surrogate and ambient weed biomass were consistently reduced across years. However, increasing crop density did not improve crop yields and resulted in increased crop biomass in only one of two years. Because yield was not affected by increasing crop density, it is not possible to recommend an optimal seeding rate. It is also important to consider the effects that increasing crop density has on grain quality parameters; protein content and TKW were reduced by crop density increase in one of two years, whereas bulk density was negatively affected in both years. While increasing crop density may decrease average kernel size, malting quality may not be compromised; at higher seeding rates, barley grain kernels possess greater uniformity, an especially important quality parameter of malting barley (Edney et al. Reference Edney, O’Donovan, Turkington, Clayton, McKenzie, Juskiw, Lafond, Brandt, Grant, Harker, Johnson and May2012; O’Donovan et al. Reference O’Donovan, Turkington, Edney, Clayton, McKenzie, Juskiw, Lafond, Grant, Brandt, Harker, Johnson and May2011). While the observed decline in grain protein may be a negative outcome for growers producing animal feed, it is likely to be interpreted as beneficial for growers producing malting barley, for whom high protein content is often a limiting factor.
Results of preemergence tine harrowing were variable; both positive and negative effects were observed. Whether or not preemergence harrowing improves weed management outcomes will depend upon site-specific variables, including weather and soil conditions following sowing, crop growth stage, and weed species present.
Increasing interrow row spacing reduced barley yield consistently across years and did not reduce intrarow weeds. Improved yields represent an incentive for the manufacturers of automated hoeing equipment to continue to develop systems capable of accurately functioning at row spacings less than 20 cm. Higher yields may also serve as an incentive for growers to adopt narrow row sowing in the hoed cereal system once these technologies become available. In addition, furthering the advance of precision guidance equipment to function at standard row spacings of 12.5 cm would represent a significant accomplishment that would likely facilitate greater adoption of interrow hoeing among cereal growers.
Supplementary material
To view supplementary material for this article, please visit https://doi.org/10.1017/wsc.2022.14
Acknowledgments
An immense amount of gratitude is extended to technicians Karen Bjørn Heinager and Eugene J. G. G. Driessen, without whom the success of this project would not have been possible. Thank you for your skilled assistance, dedication, and camaraderie. Thank you also to Betina Anitta Bendsten and Garth Douston, who assisted in processing biomass samples for experiments. Finally, this study was funded by the European Union’s Horizon 2020 research and innovation program under grant agreement no. 727321 (project acronym: IWMPRAISE); we thank the funding body for its financial support. No conflicts of interest have been declared.


 Open access