


INTRODUCTION
Non-typhic Salmonella is one of the major bacterial pathogens that cause foodborne infections as well as economic losses for the food production industry. In 2008, 131 468 confirmed human cases of salmonellosis were reported by the European surveillance system [1]. Human cases are linked to the consumption of raw or undercooked contaminated food, mainly eggs and egg products, poultry or pork meat; however, Salmonella can be isolated from a variety of food and farm animals, and can be found all along the food chain if unsuitable hygiene conditions are encountered. Wild animals and pets are also a matter of concern.
More than 2500 serotypes are known in Salmonella enterica subsp. enterica, the most frequently isolated subspecies in human and animals. All serotypes are considered dangerous for humans. S. Enteritidis and S. Typhimurium are encountered in almost 60–70% of human cases; however, less frequently isolated serotypes have significant invasive ability, e.g. S. Dublin or S. Brandenburg [Reference Wollin2].
From the public health perspective, preventing contamination of the food chain by any type of Salmonella as early as possible is of paramount importance. Therefore, there is a need to improve early detection in order to prevent human cases of infection as well as the emergence and spread of the bacteria within the agro-food chain.
In addition to self-inspections organized by food business operators, an active national surveillance system has been implemented as part of a government public health programme in targeted foodstuffs or animal production systems (poultry). The aim of this surveillance system is to measure the contamination level and to evaluate the impact of control measures. In the poultry production sector, selected serotypes associated with most human cases are targeted. In particular, a correlation has been found between the implementation of control measures for Salmonella contamination in poultry and a subsequent decrease observed in human cases of infection by S. Enteritidis and S. Typhimurium [Reference Poirier3].
Furthermore, passive laboratory-based surveillance systems have been developed for Salmonella isolated from either the human cases or from the agro-food sector for almost 30 years. Salmonella in humans is monitored by the National Reference Centre (NRC) for Salmonella. Regarding the agro-food chain, the surveillance system managed by the Salmonella network has been integrated into the French Food Safety Agency's (AFSSA) working plan. Passive surveillance activities have established large epidemiological and biological databases for any type of Salmonella isolated by voluntary laboratories, either from patients or from a wide range of animal species and food categories. These databases are regularly requested by public health and food authorities during investigations of outbreaks. These passive surveillance systems are considered to be efficient in detecting emergence or unusual events [Reference Dufour and Hendrikx4].
One of the objectives of a surveillance system is to detect unusual events, i.e. in our case a number of reported isolates greater than the expected number.
Several statistical methods have been described for detecting unusual events of infectious diseases in humans or animals. Most of these involve prospective statistical surveillance using large surveillance datasets (for review see refs [Reference Höhle, Paul and Held5–Reference Sonesson and Bock7]). Some of the methods have been described especially for Salmonella outbreaks in humans; however, their use for routine surveillance activities in veterinary practice has been limited [Reference Hutwagner8–Reference Watier, Richardson and Hubert10]. In France, detection of unusual events using time-series analysis has been routinely implemented by the NRC for Salmonella since 2006 and has led to the timely detection of sudden increases in particular serotypes isolated from human cases. The analysis results are sent on a weekly basis to the French Institute for Public Health Surveillance (InVS) which also collects information on notifiable diseases, such as foodborne outbreaks. Any alarms triggered by data on human cases are examined in respect to other available geographical and epidemiological information. When an increase in human cases is confirmed, the Salmonella network's database can be requested to guide the ensuing investigation.
The objective of this study was to evaluate the ability of the Salmonella network to detect unusual contamination in the agro-food chain using appropriate statistical methods. The issue at stake is to detect as early as possible any Salmonella contamination likely to present a public health risk.
METHOD
The Salmonella network
The main objectives of the Salmonella network are to provide scientific and technical advice to veterinary laboratories on serotyping and to collect epidemiological data on Salmonella isolated in the agro-food chain. The network is composed of voluntary public and private laboratories throughout France. In 2009, 144 laboratories from 80 French metropolitan and overseas départements belonged to the network. Representativeness of the network was estimated at 83% (70/84) of the French public veterinary laboratories, 85% (17/20) of the laboratories that are part of the French Association of Private Veterinary Laboratories (AFLABV) and 42% (5/12) of the laboratories that are part of the French Association of private food hygiene laboratories (APROLAB). Each participating laboratory sends either Salmonella strains for serotyping or the results of their own serotyping analysis to AFSSA. Each isolated strain is coupled with epidemiological information describing the origin of the sample. Isolates come from the environment, animal health, feed and food sectors and from different sampling contexts, such as surveys, investigations, clinical diagnosis, (self-)testing within food businesses or official inspections. Microbiological and epidemiological data on each strain are routinely entered in a computer database (Microsoft Access). These data help estimate the diversity of Salmonella throughout the food chain, particularly rare and/or non-regulated serotypes. Around 14 000 data entries are collected each year (60% from serotyping results and 40% from strains).
Data selection
Data used were extracted from the computer database of the Salmonella network (2001–2009 period). Statistical algorithms were applied on the most suitable data for the early detection of unusual events, according to the network's operating stability and reporting times.
• The ‘network operating stability’ was defined as laboratories that had sent strains to AFSSA each year over the previous 3 years (n=116, 80% of participating laboratories in 2009).
• Only data on submitted isolates were selected according to reporting time which is usually <8 days after receipt at AFSSA (including serotyping and entering the results into the database). The mean number of isolates received at AFSSA fluctuated from 398 (±93) to 511 (±81) strains per month between 2006 and 2009. In contrast, the reporting times for serotyping results were not considered compatible with early detection (most laboratories reported results every quarter and results were usually recorded after >15 days following receipt at AFSSA).
• Data used for the analysis were the number of strains serotyped by AFSSA per week. A weekly time-frame was chosen to detect short-term variation; the NRC has also developed this approach for the human surveillance system.
• All serotypes were included in the analysis to facilitate the detection of the emergence of new serotypes (1664 serotypes were recorded in the database in 2009).
• Only sampling contexts involving regular controls (i.e. official controls, testing in food businesses) were selected to limit bias due to strains isolated from discrete sampling (surveys, investigations).
Data obtained on one serotype constituted one time-series. The substantial amount of data and the high number of time-series generated were analysed using statistical methods that are appropriate for a variety of time-series in terms of number of cases, trends and seasonal variation. Data collected on different Salmonella isolates were assumed to be independent and statistical analysis was based only on the number of isolates submitted.
Statistical methods
Three statistical methods were used for the detection of unusual events: the Farrington method used by the British Health Protection Agency [Reference Farrington11], a Bayesian algorithm and another method used at the Robert Koch Institute (RKI), Germany [Reference Höhle12]. All these methods were implemented in the R package ‘surveillance’ [Reference Höhle and Riebler13] for R statistical software, version 2.9 (R Development Core Team, 2009). These three methods are based on two steps: (1) calculation of an expected value of the event of interest for the current week, based on past counts; (2) statistical comparison between this expected value and the observed value. A statistical alarm is triggered if the observed value is significantly different from the expected value.
Statistical analyses were performed for all serotypes within 2 h. A set of graphs and tables summarizing epidemiological data were automatically produced for each flagged serotype to assist the epidemiologist in interpretation.
Alarm assessment
In 2008 and 2009, 102 and 144 alarms, respectively, were generated by at least one of the three methods. In 2008, 102, 63, and 64 alarms were generated by the Bayes, Farrington, and RKI methods, respectively, and in 2009, 144, 107, and 91 alarms were generated by these respective methods. In the current study, in order to limit the number of alarms to assess and to focus on the most relevant cases, alarms were selected for further investigation according to the following criteria:
(1) Serotypes that presented statistical alarms generated by all three methods (48 concurrent alarms were generated in 27 serotypes in 2008 and 69 in 41 serotypes in 2009).
(2) Serotypes that presented statistical alarms for more than two consecutive weeks.
To completely characterize an unusual event, data must be examined for robustness by contacting the laboratories that sent the strains. Before interpreting a statistical alarm, data must be thoroughly checked by epidemiologists to verify the quality of transmitted information and to examine the sampling context. As the independence of samples is a critical assumption of the analyses, samples taken from one source at the same time are examined with the laboratory and duplicates are systematically eliminated. Epidemiologists can then determine whether a significantly high observed count is the result of a large quantity of duplicate strains being sent (false positive) or an unusual increase in Salmonella contamination in a particular sector.
When appropriate, the managing group of the network, partners of the national Salmonella surveillance systems, and authorities involved in monitoring public health or the agro-food chain were notified.
Surveillance report
Unusual events were classified into three categories, illustrated by examples from the 2008–2009 period.
Category 1. Detection of unusual agro-food chain contamination
Using the Salmonella network database, data could be compiled and compared at national and regional levels. The ability to detect contamination at several levels in the food chain is therefore greater in this type of passive centralized national surveillance system, compared to surveillance undertaken by independent laboratories, especially for a rare serotype.
For example, when S. Hessarek was occasionally isolated from the agro-food chain, a significantly high number of strains of this serotype (n=5) were identified in September 2008 by all three statistical methods (Fig. 1a). Contact with the laboratories indicated that these alarms concurred with unusual regional contamination at different stages of duck production (breeder, layer, producer). All partners in the surveillance system were notified. A common hatchery was identified which supplied several breeders.
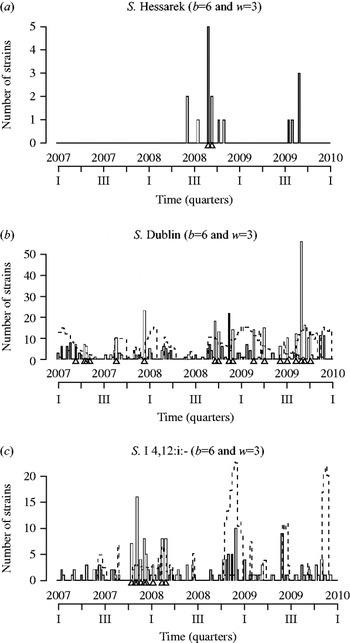
Fig. 1. Statistical surveillance of the strains collected by the Salmonella network using the Farrington method [b, number of years considered for reference historical values (2001–2006); w, number of weeks around time t included in the analysis of previous years' data], for (a) S. Hessarek, (b) S. Dublin and (c) S. I 4,12:i:-. Bars represent weekly counts of collected strains, triangles indicate statistical alarms, dotted line is the upper limit at which alarms are triggered.
Another example is S. Dublin, that is frequently isolated in cattle and dairy products. Consecutive, concurrent alarms were generated at the end of 2008. Strains were isolated from dairy products originating essentially from just one département. After contacting the laboratories, the surveillance system partners were informed and contact was established with local professional organizations and food authorities. In this example, although contamination was detected, Figure 1b shows that it was probably not brought under control in this sector because alarms were generated for almost 1 year, with a clearly significant higher count detected during self-inspection in cow's milk and cheese processing plants in September 2009.
Category 2. Detection of emergence
Successive statistical alarms for one serotype may suggest the emergence and maintenance of contamination by this serotype. Investigation is needed to define whether or not it involves a specific geographic area or a specific sector in the food industry.
For example, successive statistical alarms were obtained for the S. Typhimurium monophasic variant S.I.4,12:i:- serotype from the end of 2007 to the first quarter of 2008 (Fig. 1c). In this case, strains came from several sectors of the food industry and different regions. This observation was in accord with an increase in this serotype in the agro-food chain as well as in humans since the end of the 1990s in many countries around the world [Reference Switt14]. Notably, in France, the number of human cases associated with this serotype also increased and was ranked as the third most important serotype in 2008 by the NRC for Salmonella. These surveillance results were communicated to the competent authorities regulating the food industry. The list of the mandatory serotypes targeted by the veterinary Salmonella control programme has therefore been extended to include the S. Typhimurium variant since January 2010 at the national level.
Category 3. Detection of an unusual failure in network operation
A high number of observed counts may be due to a discrete event where laboratories submit many samples at once; this situation can be encountered in several cases: sending of grouped isolates collected in a particular survey, grouping isolates to reduce shipping costs, sending duplicates, etc. This information must be verified by contacting the laboratory before further investigation. This was the case in 2008 when an unusually high number of S. Blockley strains were detected. These strains were sent by just one laboratory and were all isolated during a particular survey. This context had not been communicated to the network and should not have been considered as part of surveillance activity. The sampling context was immediately corrected in the database and recommendations were reiterated to laboratories to ensure the quality of transmitted information.
DISCUSSION/CONCLUSION
The Salmonella network has proved to be an appropriate means of centralizing national data on Salmonella contamination at any one of several stages in the agro-food chain. The implementation of an automated statistical analysis provides an additional method for evaluating surveillance data, thereby identifying unusual events within a very large dataset.
Major drawbacks for interpreting the results of this type of general surveillance network are well known and are inherent to any passive surveillance system. Stakeholders are voluntary and therefore not systematically exhaustive, especially in the case of the Salmonella network, moreover, all private laboratories involved in food hygiene controls are not well known and not all are integrated into this national surveillance system. Furthermore, data recorded by the Salmonella network are not exhaustive and cannot be considered as representative of the contamination level in food or farm animals. Identification of duplicates is another critical point in the network's operation and should be further controlled in collaboration with the partners in the network. The diversity of sampling contexts and the impact of mandatory surveillance on the sampling scheme also strongly influence interpretation. By definition, submission time is considered as a critical point for early detection.
Performance indicators have been developed for the 2006–2009 period to assess and control the main critical points of the operation of the Salmonella network. Some positive aspects were thus highlighted, including the stability of the network as defined by the constancy of laboratory participation across time and the number of submitted strains per month. The time that elapses between sampling and the arrival of the strains at AFSSA was assessed through an internal survey organized between network partners (data not shown). Most laboratories send the strains within 7–15 days after receiving the sample to be analysed. Considering that the reporting times at AFSSA are <8 days for >80% of the submitted strains, it is assumed that any potential statistical alarms could be reasonably generated around 20 days after sampling. This time-scale of the order of one month corresponds roughly to the time of spread of contamination in the food chain included in the veterinary, food and environmental reservoirs that precede human contamination [Reference Watier15]. Work is in progress to computerize the serotyping results transmission step in order to reduce the transmission time and include the results in future analyses.
Within the limitations of the surveillance system and given these advantages, the proper interpretation of the generated statistical alarms has been improved by selecting more appropriate data for early detection in terms of submission times, sampling context and by taking into account the stability of the network operating system. We have concluded that carefully selecting appropriate data may help detect unusual events associated with:
(1) Strains of unusual serotypes isolated in regulated veterinary sectors for which major serotypes of public health interest are targeted (e.g. S. Enteritidis, S. Typhimurium, S. Hadar, S. Infantis, S. Virchow in poultry); indeed, official testing laboratories are able to serotype common and/or mandatory serotypes; in return, laboratories may submit strains to AFSSA that they are unable to serotype themselves or strains for which unusual results require confirmation.
(2) Strains isolated from unregulated livestock sectors (cattle, ducks, etc.) or from a food sector for which serotyping is not mandatory; in these cases, laboratories may submit strains to AFSSA when they are actively involved in the national surveillance system or when they detect contamination and want to obtain more complete results. This new approach appears useful for identifying serotypes, or sectors that are not integrated into the regular surveillance system.
After an experimental period of more than 1 year, this approach helped to detect and confirm in a timely manner several unusual events linked to contamination of the agro-food chain at the regional or national level. Some were specific to a particular food production sector, others involved the whole agro-food chain, while some events were in accord with surveillance results observed in humans [Reference Fisher16]. To analyse and validate the signals further, external data sources (e.g. alerts on food or active surveillance data gathered by food authorities, other passive surveillance systems organized in a particular subsector, detection of human outbreaks or human surveillance data collected by the NRC) should be taken into account.
This approach is thus considered as an improvement in Salmonella surveillance from farm to fork. Moreover, transparency with respect to the notification process has established new interaction dynamics between the partners in the network. It has also reinforced the position of the Salmonella network within the integrated national surveillance system for public health.
ACKNOWLEDGEMENTS
The authors thank Dana Pottratz for language editing.
DECLARATION OF INTEREST
None.

