


1. Introduction
Granular flows occur in many industrial as well as geophysical flows. From an industrial perspective, the use of granular material spans over a wide range of applications such as pharmaceutical (Massol-Chaudeur, Berthiaux & Dodds Reference Massol-Chaudeur, Berthiaux and Dodds2002), powder, ceramic (Sudah, Coffin-Beach & Muzzio Reference Sudah, Coffin-Beach and Muzzio2002), ores, construction, chemical (Molina-Boisseau & Le Bolay Reference Molina-Boisseau and Le Bolay2002), food (Duran Reference Duran2012) and plastic industries among others. Furthermore, some naturally occurring geophysical granular flows include snow avalanches (Pudasaini & Hutter Reference Pudasaini and Hutter2007), landslides, earthquake-induced soil liquefaction such as debris, pyroclastic flows and lahars. These flows broadly fall under the category of free-surface gravity-driven granular flows (Savage & Hutter Reference Savage and Hutter1989), and have been a topic of continued research for several decades (Delannay et al. Reference Delannay, Valance, Mangeney, Roche and Richard2017). A comprehensive account of granular flows and their applications can be found in articles (Wieghardt Reference Wieghardt1975; Goldhirsch Reference Goldhirsch2003; Cui, Gray & Johannesson Reference Cui, Gray and Johannesson2007; Pudasaini & Hutter Reference Pudasaini and Hutter2007; Delannay et al. Reference Delannay, Valance, Mangeney, Roche and Richard2017; Saleh, Golshan & Zarghami Reference Saleh, Golshan and Zarghami2018). Understanding granular materials and their behaviour under different physical environments is therefore of fundamental importance.
The flow of macroscopic particles is termed as granular when the dynamics of direct particle–particle interaction plays a dominant role in determining the flow properties (Campbell, Brennen & Sabersky Reference Campbell, Brennen and Sabersky1985). A stream of particles with individual grain sizes exceeding 100  $\mathrm {\mu }$m can be considered granular since the effects of molecular forces in dictating the macroscopic flow behaviour can be neglected (Brown & Richards Reference Brown and Richards1970). For macroscopic particles with grain sizes of the order of a millimetre or bigger, inter-particle collisions can be assumed to be governed by contact mechanics using classical Newtonian laws. Such approximations serve well when frictional forces between particles and the losses due to inelasticity in collisions are taken into consideration.
Granular materials show a complex behaviour; depending on the forces applied and the local stresses induced within a system, granular media may behave as a solid or fluid. They show solid-like behaviour when the binding force between grains dominates the external forces resulting in negligible inertial effects such as in sand piles (Savage & Hutter Reference Savage and Hutter1989; Campbell Reference Campbell1990). On the other hand, they flow like fluid when individual grains are not tightly bound to each other and external excitation causes the bulk to be fluidized, such as in the case of sand dunes. The fluidic state of granular materials is fundamentally different from molecular gases. Molecules in gases are associated with conservative force fields and distribution of energy amongst several internal modes arising from molecular and sub-atomic interactions. These molecules are in constant motion by virtue of their thermal energy governed by the absolute temperature of the system. Granular materials, on the other hand, being composed of macroscopic entities, lack thermal agitation at the particle level. Direct inelastic collisions between macroscopic entities and a loss in kinetic energy during every successive collision govern their motion (Savage & Hutter Reference Savage and Hutter1989; Andreotti, Forterre & Pouliquen Reference Andreotti, Forterre and Pouliquen2013). In the absence of any external source of energy, the moving grains immediately lose momentum due to severe dissipation and consequently collapse after several collisions. This is in contrast to fluids, where a small perturbation can travel long distances before getting damped. For example, ripples from a stone dropped in the lake can be felt on far-off distances, whereas a stone dropped on a granular bed will create a localized crater (Marston, Li & Thoroddsen Reference Marston, Li and Thoroddsen2012) with disturbances confined to its close proximity. The formation of special patterns such as segregation (Ottino & Khakhar Reference Ottino and Khakhar2000; Goldhirsch Reference Goldhirsch2003; Gray Reference Gray2018), clusters (Savage Reference Savage1992), oscillons (Umbanhowar, Melo & Swinney Reference Umbanhowar, Melo and Swinney1996; Aranson & Tsimring Reference Aranson and Tsimring2006), shock waves (Amarouchene, Boudet & Kellay Reference Amarouchene, Boudet and Kellay2001; Rericha et al. Reference Rericha, Bizon, Shattuck and Swinney2001; Gray, Tai & Noelle Reference Gray, Tai and Noelle2003; Gray & Cui Reference Gray and Cui2007; Vilquin, Boudet & Kellay Reference Vilquin, Boudet and Kellay2016; Garai, Verma & Kumar Reference Garai, Verma and Kumar2019; Tregaskis et al. Reference Tregaskis, Johnson, Cui and Gray2022) and granular streaks during shock–shock interactions (Khan et al. Reference Khan, Hankare, Kumar, Kumar, Verma and Prakash2019, Reference Khan, Verma, Hankare, Kumar and Kumar2020; Johnson Reference Johnson2020) is, in fact, a direct or indirect consequence of dissipative effects during granular collisions.
The phenomenon of shock waves in granular flows has enticed engineers and mathematicians alike. Shocks are important, since, on the one hand, they are related to many practical situations, while on the other hand, they provide a test bed for modelling the complexities offered by such materials even in apparently simple configurations. The presence of compression and expansion waves in granular systems were initially evidenced by Goldshtein & Shapiro (Reference Goldshtein and Shapiro1995) and Goldshtein, Shapiro & Gutfinger (Reference Goldshtein, Shapiro and Gutfinger1996). Small perturbations or Mach waves in supersonic gases travel at sonic velocity, which is the characteristic of the gas at that state. Similar Mach waves are generated in granular flows when an obstacle, say a circular rod, is moved through a vibrated granular bed (Heil et al. Reference Heil, Rericha, Goldman and Swinney2004; Amarouchene & Kellay Reference Amarouchene and Kellay2006). In granular flows the speed of wave propagation is significantly less than in solids and gases (where, unlike granular flows, information propagates via molecular force field interactions, which are more efficient and less dissipative).
Gravity-driven granular flows on an inclined chute find an analogy in the free-surface shallow-water flows also, wherein the hydraulic jumps relate well with the granular jumps. In both the cases jumps are observed for supercritical states characterised by the Froude number,  $Fr=U/\sqrt {gh\cos (\phi )}$, where $U$ is the flow velocity, g is the acceleration due to gravity, h is the height of the flow and $\phi$ is the chute inclination with respect to the horizontal (Gray et al. Reference Gray, Tai and Noelle2003; Gray & Cui Reference Gray and Cui2007; Cui & Gray Reference Cui and Gray2013; Sinclair & Cui Reference Sinclair and Cui2017). These flows have gained much attention recently, partly because of their application in designing protecting systems against natural hazardous flows, such as avalanches and landslides (Jóhannesson Reference Jóhannesson2001; Tai et al. Reference Tai, Gray, Hutter and Noelle2001; Börzsönyi, Halsey & Ecke Reference Börzsönyi, Halsey and Ecke2008; Faug et al. Reference Faug, Childs, Wyburn and Einav2015). Snow avalanches and landslides are modelled as free-surface flows driven by gravity along the slopes of arbitrary profiles. Such events can be triggered by heavy rainfalls and strong wind currents in mountainous regions bearing a potential threat to the nearby structures. Because of the paucity of land, and sometimes to leverage geographical benefits, it becomes unavoidable to build structures in hazard-prone areas. One strategy to safeguard such structures is to build deflectors that can divert the flow. To this end, Gray et al. (Reference Gray, Tai and Noelle2003) and Gray & Cui (Reference Gray and Cui2007) performed numerical and experimental investigations on avalanche dynamics and shock waves in granular flows. They modelled such flows using hydrodynamic equations and demonstrated the formation of shock waves with the Froude number as the primary governing parameter. Weak and strong oblique shock waves with abrupt changes in the flow height and granular velocities were formed around inclined surfaces. Hákonardóttir & Hogg (Reference Hákonardóttir and Hogg2005) performed laboratory experiments for interaction between rapid, free-surface granular flows and deflecting dams as well as free-surface flows of water. They revealed similarities between the steady deflection patterns of the water and free-surface granular flows. Cui & Gray (Reference Cui and Gray2013) studied the supercritical gravity-driven free-surface flow of a granular avalanche around a circular cylinder that showed the presence of a very sharp bow shock wave in front of the cylinder and discussed the shock stand-off distance ahead of a cylinder and grain-free region termed as the granular vacuum. Others (Chou, Lu & Hsiau Reference Chou, Lu and Hsiau2012; Padgett, Mazzoleni & Faw Reference Padgett, Mazzoleni and Faw2015) used the discrete element method to simulate the motion of granular materials around obstacles in an adjustable inclination chute with different velocities and geometrical parameters such as wedge angle and cylinder diameter. In a recent study the authors of the present article investigated experimentally the phenomenon of shock–shock interactions in rapid granular flows (Khan et al. Reference Khan, Verma, Hankare, Kumar and Kumar2020). They reported the formation of a dense granular streak between two triangular wedges, which became unstable and exhibited oscillations under specific experimental conditions.
Shock waves in gas dynamics are perceived as discontinuities, until a molecular description is invoked to describe the shock structure. In the latter, the shock wave is no longer considered a discontinuity, rather a smooth transition from an overwhelmingly fast-moving stream to relatively low velocities. The transitional region in the thickness of the shock wave is in the state of non-equilibrium, where molecules collide to exchange momentum and energy between the two equilibrium states. Mott & Harold (Reference Mott and Harold1951) proposed a simple model that describes the non-equilibrium shock wave region as a weighted average of two Maxwellian velocity distribution modes. This was later tested experimentally using the electron beam fluorescence technique (Holtz & Muntz Reference Holtz and Muntz1983; Pham-Van-Diep, Erwin & Muntz Reference Pham-Van-Diep, Erwin and Muntz1989; Mazouffre et al. Reference Mazouffre, Vankan, Engeln and Schram2001), and numerically using the direct simulation Monte Carlo technique (Bird Reference Bird1970, Reference Bird1978). The concept of bimodal velocity distribution due to Mott-Smith provides a satisfactory tool to study shock waves in granular gases. Vilquin et al. (Reference Vilquin, Boudet and Kellay2016) in their study on granular shocks around an obstacle, and, more recently, in piston-driven normal shocks in a vibrated granular field (Vilquin, Kellay & Boudet Reference Vilquin, Kellay and Boudet2018), observed that while there are two distinct and dominating modes of velocity, there lies a significant faction of grains with intermediate velocities that requires a dedicated treatment for modelling shock waves precisely.
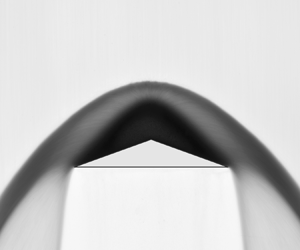
It was shown by Faug et al. (Reference Faug, Childs, Wyburn and Einav2015) that shock waves in granular flows can either be strong with abrupt changes in flow height or can be more diffused (weak) with gradual changes across the shock wave. They demonstrated that the transition between the two depends on the free-stream conditions such that the stronger jumps are favoured by fast-moving streams. A typical shock wave in a dry granular flow around a triangular wedge is shown in figure 1. The central triangular region, which is purposefully rendered white for clarity, represents the wedge obstacle pressed between two glass plates. The shock wave is a detached bow type akin to what is typically observed in a supersonic gas around bluff bodies (Hornung, Schramm & Hannemann Reference Hornung, Schramm and Hannemann2019; Hornung Reference Hornung2021). However, the similarities of granular shocks and the shock waves in gas dynamics should be perceived with caution as the two flows are fundamentally different, and the subtleties of granular flows call for more investigation. Macroscopic grains are inherently dissipative with critical velocity (equivalent to the sonic velocity in gases, and the speed of gravity waves in shallow-water theory) of the order of  $1\,{\rm m}\,{\rm s}^{-1}$ (Heil et al. Reference Heil, Rericha, Goldman and Swinney2004; Khan et al. Reference Khan, Verma, Hankare, Kumar and Kumar2020). The background of the image in figure 1 represents the free stream, and the dark region between the shock front and the wedge tip represents the low-velocity grains compressed by the shock wave. Features similar to expansion fans are evident near the trailing edge of the wedge as the grains accelerate and leave the wedge surface. These flow features share qualitative similarities with those observed by Amarouchene et al. (Reference Amarouchene, Boudet and Kellay2001) using a set-up similar to the Hele-Shaw cell. Their observations concluded that the shock profile is parabolic with an inner triangular stagnant zone irrespective of the solid geometry and the grain size. A few other studies aimed at exploring the shock wave structure include Amarouchene & Kellay (Reference Amarouchene and Kellay2006), Boudet, Amarouchene & Kellay (Reference Boudet, Amarouchene and Kellay2008), Vilquin et al. (Reference Vilquin, Boudet and Kellay2016), Karim & Corwin (Reference Karim and Corwin2017) and Garai et al. (Reference Garai, Verma and Kumar2019).

Figure 1. Detached shock wave in dry granular gas. Flow is from top to bottom.
A brief review of the phenomenon of shock waves and the related studies in granular flows suggests that a clear understanding of the flow features is still lacking despite significant advancements in the field. Much of the earlier works on the subject have focused mainly on the open channel configuration. In this paper we report salient features of granular shock waves in rapid granular flows in a two-dimensional closed channel. Such flows are relevant to applications where granular flow takes place in confinements such as in landslides inside tunnels and valleys, bladed mixers and closed conveyors. We seek to answer some of the following important questions.
(i) Why and how does a shock wave in granular flow detach?
(ii) How does the shock wave structure look near detachment?
(iii) What is the dependency of a shock wave on grain size?
(iv) How does the shock wave scale with the obstacle size?
(v) How does the static heap form in the inner stagnant region of the detached granular shock wave?
In §§ 2 and 3 details regarding experimental set-up and flow characterizations are discussed. In § 4 the structure of granular shock waves, and the same before and after detachment is presented. Finally, non-equilibrium shock wave structure is presented and discussed using velocity data from particle image velocimetry (PIV).
2. Experimental set-up and procedure
The experimental set-up used for the present study consists of a rectangular channel made of two glass sheets, each 900 mm long and 310 mm wide, as shown in figure 2. The set-up is rendered two dimensional by fixing the gap to 5 mm; however, a few experiments are also performed to demonstrate the effects of channel gap,  $h$, on the shock wave structure. The channel can be inclined to the horizontal at an inclination of $20^{\circ } \leq (\phi ) \leq 80\,^{\circ }$. The velocity of the flow, the granular Mach number and the Froude number changes with the channel inclination. An isosceles triangular wedge of 5 mm thickness machined in brass metal is placed inside the channel touching both the glass sheets. Two lateral sides of a wedge are kept fixed ( $D = 20\,{\rm mm}$, unless stated otherwise), whereas the half-wedge angle $\theta$ at the tip (shown in the inset in figure 2) is varied from $10^{\circ }$ to $80^{\circ }$. The wedge is placed at the centre of the channel with its base roughly at a distance of 500 mm from the hopper opening. For each experiment, the hopper is closed from the bottom using a gate mechanism and is then loaded with grains. Although granular mass flux from the hopper is not strongly dependent on the quantity or the height of granular material inside the hopper (Kohaut et al. Reference Kohaut, Weber, Groenendijk, Poppelaars and Janssen1986; Tripathi & Khakhar Reference Tripathi and Khakhar2011), an equal and sufficiently large amount of grains were loaded for each experiment for consistency. Once the gate is removed, grains accelerate and gain momentum due to gravity.

Figure 2. Schematic of the experimental set-up showing the essential components. Channel is inclined with the horizontal at an angle,  $\phi$. Inset shows the triangular wedge model with half-wedge angle $\theta$. Coordinate system is shown with respect to the wedge orientation.
Granular particles used in the present experiments are solid colourless spherical glass beads manufactured from high-grade soda-lime-silica glass. The specific gravity of the beads lies between  $2.5$ and $2.55$ with the bulk density of $1600\,{\rm kg}\,{\rm m}^{-3}$. To analyse the effect of grain size, experiments are performed for grains of different sizes ranging from $125 \pm 25\,\mathrm {\mu }{\rm m}$ to $925 \pm 25\,\mathrm {\mu }{\rm m}$. Bead sizes are characterized based on the nominal diameter, and are assigned shorthand notation, G1 to G4, as shown in table 1. Besides glass beads, experiments are performed for natural beach sand, which is washed and sieved to obtain a narrow range of size distribution comparable to G1. Unlike spherical glass beads, natural sand grains are of irregular shapes, and represent a more generic class of granular materials found in nature.
Table 1. Angle of repose for grains with different interacting pairs.

The diagnostics performed in the present investigation relies on flow visualization and PIV. Flow features, such as shock waves, are captured using a shadowgraph flow visualization technique, where the flow domain is illuminated by an LED panel placed on the rear side of the glass channel and a camera views perpendicular to the channel (see figure 2 for schematic). Shadowgraphs are acquired using a high-resolution DSLR Nikon D810 36 megapixel camera. Figure 1 shows an illustration of the flow field captured with the flow visualization technique. The intensity of the pixels in the acquired images is a strong function of the volume fraction ( $\sim$density), transparency of the glass beads and the depth of the stream. The shock waves in the granular flow appear as an abrupt shift in intensity values of the pixel on either side of the wavefront. For a quantitative description of the flow field, particle imaging velocimetry is performed. For efficient tracking of particles, a high-speed CMOS type IDT camera is used to capture images at a rate of 1500–2500 frames per second, depending on the flow velocity near the shock front. The bulk of the grains consists of a mixture of transparent and coloured grains. The limitation with the obtained velocity fields is that they are more representative of the conditions near the surface.
3. Flow field characterization
Characterization is performed by estimating free-stream flow parameters such as the velocity, Froude number, granular Mach number and the angle of repose for the grain samples used in the present experiments. The angle of repose for particle and other flat surfaces is defined as the minimum angle needed for grains to slide on an inclined surface by virtue of their weight. In the context of the present experimental study, the angle of repose is calculated for all the possible contact surfaces that may exist during the flow process, i.e. grain-wall (glass channel), grain-wedge (brass) and grain-grain systems, and are shown in table 1. The angle of repose for a grain wall and grain wedge is estimated by sliding a few grains on inclined flat surfaces of glass and wedge. The internal angle of repose between grains is estimated by slowly pouring grains from a funnel on a flat surface until a steady heap is formed. The inclination of the heap with the flat surface is marked as the angle of repose between grains. Table 1 tabulates the numerical values of the angle of repose estimated here.
The magnitude of the incoming velocity of granular flow is determined by the particle tracking method and the PIV using images extracted from high-speed video footage. For the particle tracking method, coloured tracer particles are added to the bulk granular material inside the hopper. The variation of velocity along the channel for G1 is shown in figure 3. Data was taken at many locations in small windows due to limited camera resolution. Markers indicate the experimental values obtained from PIV, whereas dashed curves are the trend lines. A higher acceleration is observed initially as the grains gain momentum while leaving the hopper. Although the steady state is not reached, the variation in velocity becomes more gradual in the far downstream locations of the channel. It can be fairly assumed that the change in flow velocity over the length equivalent to the wedge size  $D$ is not significant to alter the shock wave structure significantly. Therefore, the formation of a shock wave on a wedge is assumed to depend primarily on the average properties of the free stream ahead of the wedge tip. Velocities for other grains follow similar trends except that magnitudes are different. Figure 4 shows the variation of velocity with the channel inclination, $\phi$, for different grains measured at a location, which is around 20 mm upstream of the wedge tip. It is observed that velocity increases nonlinearly with channel inclination $\phi$. It is also worth noting that the grain diameter also has some influence on the flow velocity (especially at low channel inclinations) even though the flow is purely driven by gravity. This is probably due to the reason that bigger grains have higher mobility due to less surface-to-surface contact and the rolling friction.

Figure 3. Variation of free-stream velocity for grains G1 along the channel for different inclinations. The inlet of the channel near the hopper exit marks the origin ( $x = 0$ location). The dashed curves are obtained by fitting the experimental data to give a representative qualitative trend to the variation of velocity along the channel.

Figure 4. Variation of free-stream velocity for different grains with channel inclination at a location upstream of the obstacle obtained by particle tracking.
From gas dynamic theory it is known that shock waves are strong compression fronts that are formed when a large number of weak compression waves (Mach waves) coalesce. The mechanism of these compression waves depends on how fast the object is moving relative to the wave speed in that medium. Therefore, properties of the shock wave are governed by the non-dimensional parameter Mach number defined as  $M = V/a$, where $V$ is the relative velocity of the object with respect to the fluid, and $a$ is the local wave speed also known as sonic velocity. The orientation of the Mach wave with the free stream, $\mu$, in supersonic flows is related to the Mach number by the following relation (Anderson Reference Anderson2004):
 \begin{equation} \sin{\mu}=1/M. \end{equation}
Interestingly, experiments have revealed that the wake behind an infinitesimal needle tip placed in a layer of supersonic granular gas resembles closely with the Mach cone in compressible flows (Heil et al. Reference Heil, Rericha, Goldman and Swinney2004; Amarouchene & Kellay Reference Amarouchene and Kellay2006). The same methodology is used in the present work, where the granular stream is perturbed by the tip of a fine needle resulting in the generation of a Mach cone (Khan et al. Reference Khan, Verma, Hankare, Kumar and Kumar2020). The half-angle of this cone gives an estimate of the Mach number. What makes this simple approach appealing and credible is the good agreement of sonic velocity with those predicted from granular kinetic theories (Heil et al. Reference Heil, Rericha, Goldman and Swinney2004; Amarouchene & Kellay Reference Amarouchene and Kellay2006). This can be anticipated since the kinetic theory of gases has been successfully shown to be able to govern the mechanics of dilute granular gases (Goldhirsch Reference Goldhirsch2003; Amarouchene & Kellay Reference Amarouchene and Kellay2006; Kumaran Reference Kumaran2014). It is however important to not overemphasize the analogy between granular gases and molecular gases. Subtle key similarities and differences between the structure of granular shock waves from their molecular counterpart are discussed in some of the recent works (Boudet et al. Reference Boudet, Amarouchene and Kellay2008; Vilquin et al. Reference Vilquin, Boudet and Kellay2016, Reference Vilquin, Kellay and Boudet2018).
In the present work the values of the Mach number are estimated for the finest grain system G1 ( $d = 125\,\mathrm {\mu }{\rm m}$) and are tabulated in table 2. The speed of sound is also estimated using the Mach number and the velocity data, as discussed earlier, and is found to be around $0.22\,{\rm m}\,{\rm s}^{-1}$ for the present set of parameters.
Table 2. Flow properties for G1 ( $d = 125 \pm 25\,\mathrm {\mu }{\rm m}$).

Another important parameter that is used to characterize these types of granular flows is the Froude number which is defined as the ratio of the flow speed to the speed of the weak inertia-gravity waves (Johnson & Gray Reference Johnson and Gray2011). Grains flowing in relatively thin layers can be approximated by shallow-water flow theory, wherein the granular Froude number can be applied and used to study different regimes such as supercritical and subcritical depending on whether the value of  $Fr$ is higher or lower than the critical value.
The depth of the free stream,  $h$, is measured using a micrometre head with a least count of $10\,\mathrm {\mu }{\rm m}$. The micrometre head is placed vertically on the channel with the top glass sheet removed. The spindle of the micrometre that is initially positioned touching the lower glass surface is gradually moved away to a position where it barely touches the granular layer. The net linear translation of the gauge gives the depth of the free-stream granular layer for different channel inclinations. The estimated values of the Froude number are significantly more than one, indicating the supercritical nature of the granular free stream.
From the preceding discussion it can be said that shock waves in granular flows can be viewed both from the perspective of gas dynamics, where shocks are perceived as discontinuities in granular density with the granular Mach number being the governing parameter, and from the standpoint of shallow-water theory, where discontinuities appear as jumps in the granular stream height with the granular Froude number being the governing parameter. Interestingly, analytical treatment to conservation laws based on these two approaches results in hyperbolic governing equations with wave-like solutions (Lax Reference Lax1973; Fletcher Reference Fletcher2012). For a more formal discussion on the topic, readers may refer to Savage & Hutter (Reference Savage and Hutter1989), Wieland, Gray & Hutter (Reference Wieland, Gray and Hutter1999) and Gray et al. (Reference Gray, Tai and Noelle2003).
4. Results and discussion
4.1. Shock detachment
Two important parameters that govern shock waves in granular flows are the wedge angle,  $\theta$ and the free-stream granular velocity. Figure 5 shows shock wave structures obtained when a granular stream with grain diameter $d = 125 \pm 25\,\mathrm {\mu }{\rm m}$ (G1) flows past a triangular wedge at a different wedge angle. To study the effect of wedge angles, $\theta$, on the shock wave structures, flow velocity is held constant by keeping the channel fixed at $\phi = 60^{\circ }$. For slender bodies, i.e. for small values of $\theta$ (such as for $\theta =10^{\circ }$ and $\theta =20^{\circ }$), attached shock waves are formed. It can be seen that grains are concentrated within a small layer close to the wedge surface. As the granular stream passes the wedge, the compressed granular layer undergoes expansion about the trailing corner of the wedge. This expansion feature is more pronounced for the $\theta = 20^{\circ }$ case. These shock waves resemble strong shocks formed in supersonic continuum gas flows (Anderson Reference Anderson2004).

Figure 5. Shock wave structures formed when granular stream with grain diameter  $d = 125 \pm 25\,\mathrm {\mu }{\rm m}$ flows past a triangular obstacle with different wedge angle $\theta$. Channel inclination is constant ( $\phi = 60^{\circ }$). Results are shown for (a) $\theta = 10^{\circ }$, (b) $\theta = 20^{\circ }$, (c) $\theta = 30^{\circ }$, (d) $\theta = 40^{\circ }$, (e) $\theta = 45^{\circ }$, ( f) $\theta = 50^{\circ }$, (g) $\theta = 60^{\circ }$, (h) $\theta = 70^{\circ }$, (i) $\theta = 80^{\circ }$.
As the wedge angle  $\theta$ is increased to $30^{\circ }$ and $40^{\circ }$, the shock wave angle increases, and the high-density granular layer becomes wider, while the shock wave remains attached to the wedge surface. A distinct feature of the attached shock wave in the present cases is the appearance of a kink in the shock wave at a location slightly away from the wedge tip, as evident for the $\theta = 30^{\circ }$ case in figure 5. The mechanism of the kink formation will be discussed later in the same section. When the value of $\theta$ is increased to $45^{\circ }$, the shock wave starts detaching from the wedge, as evident from figure 5. The detachment transition phenomenon is marked by the presence of a granular splash at the tip of the wedge, and the shock front appears to have bulged near the wedge tip. With further increase in the wedge angle, the shock wave clearly detaches from the wedge, as can be seen for $\theta \geq 50^{\circ }$. The detached shock waves resemble the bow shocks in supersonic gases with subtle differences in features such as the presence of a secondary shock with stagnant grains. Detached bow shocks are nearly parabolic in shape for all the values of $\theta \geq 50^{\circ }$.
Shock wave data presented in figure 5 demonstrate many interesting features, however, there are three particularly interesting morphologies that require mentioning: the first one is where the shock wave remains attached to the wedge tip and is observed for slender wedges, as shown in figure 6(a). The shock profile in general would be curved with the presence of a kink (mentioned above). The oblique shock profile angle at the tip is highlighted in red. The second is the case when the shock stands ahead of the wedge with a clear offset from the wedge tip, as shown in figure 6(c). The distance between the wedge tip and the shock nose is termed as the shock stand-off distance  $\delta$. One interesting feature of the detached shock wave in granular flows is the presence of two distinct regions between the wedge surface and the shock wave. One is the inner region that consists of grains which are either stationary or sliding with small velocities over the stagnant heap. The other is the outer region of the shock wave that is formed due to the bouncing back of incoming fast-moving grains as they hit the granular heap. Such flow features are prominently visible due to the presence of the upper wall. To distinguish the two regions within the shock wave, a secondary shock stand-off distance is defined, which is marked with $\delta ^\prime$ in figure 6(c). The secondary shock wave, in that sense represents the size of the inner dense zone formed by piling up of grains on the wedge tip, and delimits the stagnant grains with those of relatively high velocity inside the shock wave region. The third is the transitional case, where the shock wave is on the verge of getting detached, as shown in figure 6(b). The transition from an attached to detached shock wave is not sharp, i.e. while the shock detachment is strongly dependent on experimental parameters such as wedge angle and flow velocity, there is a range of parametric values where the shock wave is neither attached nor fully detached. For these parameters, two attached but curved shock waves are formed on both sides of the wedge, both originating near the wedge tip. The striking feature of this configuration is the small region near the tip where grains splash between the two shock fronts. The splashing occurs since the tip of the wedge is still exposed to the free stream, and the grains that strike the wedge tip are rebounded backward, resulting in the entire flow field appearing like a ’granular splash’. The transitional features observed here are unique and are peculiar to granular flows in a confined flow configuration, for which no specific analogy can be observed in gas dynamic shocks.

Figure 6. Different categories of shock wave patterns obtained by varying the wedge angle  $\theta$; (a) attached shock wave, (b) shock wave at the instant of detachment and (c) detached bow shock wave.
Figure 5 demonstrates the formation of a kink, the position of which changes with the blockage offered by the wedge and the velocity of the incoming granular stream, which in turn are governed by  $\theta$ and $\phi$, respectively. The images in figure 5 show that the kink is formed for higher values of $\theta$ as long as the shock wave remains attached and no such feature is observed for low values of wedge angles ( $\theta = 10^{\circ }$ and $20^{\circ }$). A higher value of $\theta$ means higher blockage to the incoming granular stream, which in-turn means that a larger amount of granular mass is deflected to a greater extent in the lateral direction. As discussed earlier for $\theta = 10^{\circ }$ and $20^{\circ }$, the incoming grains are uniformly deflected by the wedge obstacle and the grains remain intact to the wedge lateral surfaces as they negotiate the wedge obstacle. For the $\theta = 30^{\circ }$ case, the granular flux which is deflected by the wedge slant surface in the lateral direction strikes the upper glass wall of the channel that appears as a thick attached shock wave with a distinct kink, when viewed normal to the channel. This flow feature is more easily apparent in figure 9 where the effect of channel gap is shown for some selected cases. For $\theta = 40^{\circ }$, a similar flow topology is also observed with a wider shock due to a higher granular flux being diverted by the wedge. Also, the position of the kink appears to have moved near the tip of the wedge. This mechanism prevails as long as the shock wave remains attached for relatively smaller values of $\theta$.
To study the behaviour of this kink, experiments are performed for the attached case with  $\theta$ varying in small intervals between $\theta = 20^{\circ }$ to $\theta = 45^{\circ }$ and the resulting shock structures are shown in figure 7. The location of the kinks are marked with red arrows. It is seen that with an increase in the value of $\theta$, the kink moves towards the wedge tip and the granular jump progressively becomes thicker. As the value of $\theta$ approaches the shock detachment angle, the granular jump from both the sides approach towards the wedge tip and eventually merge at the wedge tip at the condition of shock detachment (see the $\theta = 45^{\circ }$ case in figure 7). A kink in the shock appears as long as the shocks are attached; once the shock wave detaches, both the shock fronts merge into a single smooth parabolic-like profile and, thus, no kink is formed thereafter. This happens when the wedge angle $\theta$ is large, and grains start accumulating near the wedge tip (for example, see figure 5 for $\theta = 50^{\circ }$ through $80^{\circ }$).

Figure 7. Shock wave morphologies and the variation in kink location with wedge angle  $\theta$. Channel inclination is constant ( $\phi = 60^{\circ }$). Results are shown for (a) $\theta = 20^{\circ }$, (b) $\theta = 22^{\circ }$, (c) $\theta = 24^{\circ }$, (d) $\theta = 26^{\circ }$, (e) $\theta = 28^{\circ }$, ( f) $\theta = 30^{\circ }$, (g) $\theta = 35^{\circ }$, (h) $\theta = 40^{\circ }$, (i) $\theta = 45^{\circ }$.
A similar behaviour of the granular jump is observed with respect to the channel inclination,  $\phi$, which is shown in figure 8. Here, velocity increases with $\phi$ while the wedge angle $\theta$ is kept fixed at a value of 30 $^{\circ }$. It is observed that as the channel inclination (and, hence, the flow velocity) is increased, the kink moves away from the wedge tip. It is noteworthy that while the variation in the kink location is not as strongly influenced by channel inclination as compared with that by wedge angle, $\theta$, the granular jump downstream of the kink becomes thicker and stronger with increasing $\phi$ (such as in the case with $\theta = 80^{\circ }$ in figure 8), suggesting a stronger shock wave.

Figure 8. Shock wave morphologies and the variation in kink location with channel inclination  $\phi$. Wedge angle is constant ( $\theta = 30^{\circ }$). Results are shown for (a) $\phi = 30^{\circ }$, (b) $\phi = 40^{\circ }$, (c) $\phi = 40^{\circ }$, (d) $\phi = 60^{\circ }$, (e) $\phi = 70^{\circ }$, ( f) $\phi = 80^{\circ }$.
To appreciate the intricate nature of the flow field obtained in the present experimental set-up, it is imperative to discuss the effects of the channel gap on the shock wave structure. Figure 9 shows the visuals of granular shocks when fine grains (G1) flow past a wedge with  $\theta = 60^{\circ }$ for channel height $(t)$ values of 10 and 20 mm. The images on the left column corresponds to $\phi = 30^{\circ }$, whereas those in the right column correspond to $\phi = 50^{\circ }$. As shown in figure 9(a), for $t = 10\,{\rm mm}$, a curved detached shock wave is formed at $\phi = 30^{\circ }$ such that the entire depth of the channel is filled with grains near the wedge tip. For $\phi = 50^{\circ }$, grains splash at high velocity resulting in two separate shock waves from either sides of the wedge, as shown in figure 9(d). The channel is again entirely occupied by grains around the wedge surface, except near the tip. Similar flow features are observed for the $t = 5\,{\rm mm}$ case, however, more grains are accumulated over the wedge due to friction from the glass plates. When the channel height is increased to 20 mm, a clear three-dimensional nature of the jump or the shock wave is revealed, as can be seen in figure 9(b,e) for $\phi = 30^{\circ }$ and $50^{\circ }$, respectively. For $\phi = 30^{\circ }$, the free-stream velocity is small such that grains are easily collapsed and concentrate into a curved shock near the wedge base, whereas for $\phi = 50^{\circ }$, the free-stream velocity is high, and consequently, grains are rapidly turned along the wedge walls and strike the upper surface of the channel. The resulting flow fields in the absence of the top glass plate are shown in figure 9(c, f) for $\phi = 30^{\circ }$ and $50^{\circ }$, respectively. In the absence of the upper plate the grains fly off the wedge surface when the inclination of the channel is high. Thus, the effect of the upper plate is to constrain the grains within the channel such that, for small channel gaps, a nearly two-dimensional shock wave or a granular jump is formed between the two walls. Although the confined flow field in the present case is different from the free-surface flow, it does demonstrate many of the aspects of granular shocks that are not easy to comprehend.

Figure 9. Flow past a wedge for different channel heights: (a)  $t = 10\,{\rm mm}$, $\phi = 30^{\circ }$, (b) $t = 20\,{\rm mm}$, $\phi = 30^{\circ }$ and (c) $t = 20\,{\rm mm}$, $\phi = 30^{\circ }$, (d) $t = 10\,{\rm mm}$, $\phi = 50^{\circ }$, (e) $t = 20\,{\rm mm}$, $\phi = 50^{\circ }$ and ( f) $t = 20\,{\rm mm}$, $\phi = 50^{\circ }$. The top glass plate is absent in (c, f). The inset shows the shadowgraph images when the flow field is viewed normal to the channel.
Based on the observations from the current experimental data set, it can be inferred that the tendency of shock waves to detach in granular flows can be tracked by the footprints of attached shock waves that demonstrate a peculiar kink-like structure, which is sensitive to  $\theta$ and $\phi$. It is observed that the kink approaches towards the wedge tip for higher values of $\theta$ and lower values of $\phi$. In other words, shock wave detachment in granular flows is more likely to occur for higher flow deflections and smaller flow velocity. This observation is similar to that observed for the formation of shock waves in gas flows and in open channel shallow flows of water and grains.
4.2. Effect of grain size on shock waves
To explore the effect of grain size on the granular shock waves, detailed experiments are performed for glass beads of four different grain sizes, viz.,  $d = 125\,\mathrm {\mu }{\rm m}$, $250\,\mathrm {\mu }{\rm m}$, $500\,\mathrm {\mu }{\rm m}$ and $925\,\mathrm {\mu }{\rm m}$, as shown in table 1. The hopper opening is kept constant for all grain sizes. It is known from the literature that, for a smooth and continuous flow, the opening of the channel should be at least six times the grain size (Choi et al. Reference Choi, Kudrolli, Rosales and Bazant2004). This is maintained in the present study by restricting the maximum grain size to below $1000\,\mathrm {\mu }{\rm m}$.
Figure 10 shows the detailed detached shock wave structures around a wedge with  $\theta = 70^{\circ }$ for different grain diameters. Since the velocity is dependent on the grain diameter and the channel inclination, both different channel inclinations are chosen for different grain types so as to obtain a velocity that is nearly the same ( $V = 2.6\,{\rm m}\,{\rm s}^{-1}$) in the present case. This enables us to compare the shock structures for different grains at a given velocity. Salient key features that are peculiar to granular shock waves are evident for all the grain sizes. Shocks are smooth bow-shaped crisp profiles owing to abrupt changes in the flow properties. The outer shock envelope demarcates the incoming undisturbed supersonic flow from the downstream part. Since images are acquired at relatively high exposure time, the flow field is time averaged, and streaklines can be seen in the shock region. There exists a secondary shock that marks the presence of an inner zone with densely packed grains. The core of the inner zone is a static heap where grains are apparently stagnant, whereas the periphery consists of a fluid-like layer where grains slide over the static heap. The static heap and the fluid-like layer are distinctly visible for bigger grains (figure 10c,d). The outer shock profiles in figure 10(c,d) have relatively less spread (lateral width) as compared with those in figure 10(a,b), which is mainly due to the fact that the gravitational force is more influential for bigger particles as compared with the particles of smaller diameter (for example, G1). In molecular-based fluids there exists a stagnation point on the nose tip, which in principle means that the fluid particle from the free stream that approaches the nose tip is brought to zero velocity. However, in granular gases, as demonstrated in the present case, there exist two possibilities depending on whether the shock wave is attached or detached. For attached shock waves, there exists no stagnation point, and a clear violation of the no-slip condition is observed, whereas, for detached shock waves, there exists a sufficiently big zone with the size on the order of the characteristic obstacle diameter, where all the grains are stagnant.

Figure 10. Salient features of detached shock wave for different grain system. Wedge angle  $\theta = 70^{\circ }$ and channel inclination $\phi = 50^{\circ }$. Results are shown for (a) G1, $d \sim 125\,\mathrm {\mu }{\rm m}$; (b) G2, $d \sim 250\,\mathrm {\mu }{\rm m}$; (c) G3, $d \sim 500\,\mathrm {\mu }{\rm m}$; (d) G4, $d \sim 900\,\mathrm {\mu }{\rm m}$.
Figure 11 shows perspective views of granular shocks obtained with different orientations of the camera. Since the camera was placed too close to the flow field and was oriented at an inclination to the channel plane, it was difficult to focus the entire region in one single shot. Some of the salient features of the shock waves are highlighted. A standing bow-shaped granular jump is formed on the front of the wedge, and a granular vacuum is created on the leeward side. Because of the orientation of the wedge, grains are deflected away from the centreline because the vacuum remains wide open even in the far wake. The stagnant zone observed here is similar to the dead zone observed earlier by Faug, Lachamp & Naaim (Reference Faug, Lachamp and Naaim2002) in open channel dry granular flows past an obstacle. The study can be referred to in order see the dependency of the size of the dead zone on parameters such as the obstacle height, channel inclination and the flow depth.

Figure 11. Perspective views of detached shocks/granular jumps generated when grains flow around a wedge obstacle. Orientation and camera settings are varied to get different fields of view. Flow is from right to left and experimental parameters are mentioned on the top left corner of each image. Results are shown for (a)  $d \sim 125\,\mathrm {\mu }{\rm m},\ \theta = 60,\ \phi =33$; (b) $d \sim 125\,\mathrm {\mu }{\rm m},\ \theta = 60,\ \phi =40$; (c) $d \sim 250\,\mathrm {\mu }{\rm m},\ \theta = 60,\ \phi =50$; (d) $d \sim 250\,\mathrm {\mu }{\rm m},\ \theta = 60,\ \phi =60$; (e) $d \sim 900\,\mathrm {\mu }{\rm m},\ \theta = 60,\ \phi =33$; ( f) $d \sim 900\,\mathrm {\mu }{\rm m},\ \theta = 60,\ \phi =40$.
Figure 12 shows the shock wave structure for dry beach sand (with size comparable to G1) for  $\phi = 60^{\circ }$ with varying wedge angle $\theta$. On comparing these images with that of glass beads G1 (shown in figure 5), it is observed that almost similar kinds of structures are obtained with slight differences such as the shape of the shock profile, which is more rounded for glass beads and more conical near the nose for sand grains. Since sand grains are opaque in nature, shock waves appear darker as compared with glass beads. Also, for the same reason, the presence of primary and secondary shock structures is not apparent from the shadowgraph images presented here. Shock wave structures for bigger glass beads (G2, G3 and G4) are shown in figures 24, 25 and 26 in the Appendix. Figure 13 shows the morphology of shock waves at specific detachment angles, i.e. at the instant of shock detachment, for different grain diameters. While no specific trend in the shock detachment angle is observed with respect to the grain diameter, the general observation is that it seems to lie between the range $40^{\circ } \leq \theta \leq 50^{\circ }$.

Figure 12. Variation in the shock wave structures with wedge angle  $\theta$ for natural sand at channel inclination, $\phi = 60^{\circ }$. Results are shown for (a) $\theta = 10^{\circ }$, (b) $\theta = 20^{\circ }$, (c) $\theta = 30^{\circ }$, (d) $\theta = 40^{\circ }$, (e) $\theta = 47.5^{\circ }$, ( f) $\theta = 50^{\circ }$, (g) $\theta = 60^{\circ }$, (h) $\theta = 70^{\circ }$, (i) $\theta = 80^{\circ }$.

Figure 13. Shock wave structure at the instant of detachment. Shock detachment angle  $\theta$ is mentioned at the top left of each frame. Channel inclination, $\phi = 60^{\circ }$. Results are shown for (a) G1 $(\theta = 45^{\circ })$, (b) G2 $(\theta = 38^{\circ })$, (c) G3 $(\theta = 42^{\circ })$, (d) G4 $(\theta = 47^{\circ })$.
Shock stand-off distance is an important parameter in detached shock dynamics both in granular and continuum flows. Shock stand-off distance,  $\delta$, is measured and its variation with the Froude number for all the grain types used in the present study is shown in figure 14. The figure shows the shock stand-off distance normalized by the projected length of the wedge ( $R$, see figure 2) corresponding to three different values of $\theta$, for which shock waves remain detached. To give readers a perception of the general trend in the variation of shock stand-off distance or the detachment length with the Froude number, the data from the work of Gond et al. (Reference Gond, Perret, Mignot and Riviere2019) in a shallow hydraulic flow is also plotted. The range of Froude numbers in the present experiments does not overlap with that of Gond et al. (Reference Gond, Perret, Mignot and Riviere2019), as their experiments were performed in an open channel where the obstacle is traversed at small velocities, whereas in the present case high Froude numbers are obtained due to high values of channel inclinations. For this reason, a direct comparison is not possible. It is observed that the shock stand-off data from the present experiments for all the three cases of wedge angle $\theta$ ( $\theta = 50^{\circ }, 60^{\circ }$ and $70^{\circ }$) fall around the trendline obtained by fitting the experimental data from Gond et al. (Reference Gond, Perret, Mignot and Riviere2019). It is observed that the values of shock stand-off distance decreases slightly for a higher range of Froude number. It is also noted from figure 14 that the values of the shock stand-off distance for natural sand matches closely with that of glass beads of diameter around $125\,\mathrm {\mu }{\rm m}$, suggesting that grain shape might not be an important factor for small grains ( $d \leq 125\,\mathrm {\mu }{\rm m}$) in the estimation of shock stand-off distance. Another observation to note is that the values of $\delta /R$ increases with $\theta$, and almost all the values of $\delta /R$ for $\theta = 70^{\circ }$ lie above the trendline. This is attributed to the frictional forces acting on grains; as the value of $\theta$ increases, the role of frictional force acting on the grains colliding with the wedge surface increases resulting in higher values of the shock stand-off distance.

Figure 14. Variation of shock stand-off distance  $\delta /R$ with Froude number for glass beads and natural sand. The Froude number is changed by changing the channel inclination $\phi$. Results are shown for (a) $\theta =50^{\circ }$, (b) $\theta =60^{\circ }$, (c) $\theta =70^{\circ }$.
Figure 15 shows the variation of the shock stand-off distance (normalised with the wedge side length  $D$) with the wedge angle $\theta$ while keeping the channel inclination the same. Fixing the channel inclination fixes the free-stream velocity and the Froude number for a particular grain type. The shock stand-off distance appears to increase with the wedge angle, $\theta$, for all values of channel inclination, $\phi$, studied in the present investigation. This is anticipated since the stagnant heap becomes more stable when $\theta$ is increased. It is observed that the values of shock stand-off distance for $\phi = 70^{\circ }$ and $80^{\circ }$ almost overlap indicating that the values of $\delta /D$ do not vary significantly for higher values of $\phi$. Figure 14 also demonstrates that for very high $Fr$ (which depends only on the value of $\phi$) in the present study, the values of $\delta$ tend to saturation.

Figure 15. Variation of shock stand-off distance ( $\delta$) with half-wedge angles $\theta$. Results are shown for (a) G1, (b) G2, (c) G3, (d) G4, (e) sand.
5. Effect of scaling
Scaling in granular flows is a topic of much debate. It is still not clear as to how well the results from laboratory set-ups can be translated to large-scale realistic scenarios (Silbert, Landry & Grest Reference Silbert, Landry and Grest2003). There are features in granular flows, clustering for example, which are observed only beyond a certain scale of the domain (Fullmer & Hrenya Reference Fullmer and Hrenya2017). Chute flows show scaling laws that are confirmed from several experimental and numerical studies (Azanza, Chevoir & Moucheront Reference Azanza, Chevoir and Moucheront1999; Pouliquen Reference Pouliquen1999; Silbert et al. Reference Silbert, Landry and Grest2003). However, whether such scaling and flow properties can be applied to very large flow domains such as landslides and extra-terrestrial flows is an open question (for a more elaborate discussion on the topic, see Delannay et al. Reference Delannay, Valance, Mangeney, Roche and Richard2017). An attempt is made in this direction to see whether shock waves obtained in the experimental set-up show scaling or not. The objective is to see how the shock location (the stand-off distance for instance) changes when the obstacle is linearly scaled. This analysis will provide some insight for further investigation on the subject, and could possibly help in the numerical modelling.
The characterization of shock waves is done by measuring the shock stand-off distance, and the same is used as a basis for scaling analysis. The value of shock stand-off distance for a particular grain geometry depends mainly on the wedge size  $D$, grain diameter $d$, wedge angle $\theta$, channel height $t$ (which is constant in the present case), free-stream velocity $V$ (that is dependent on channel inclination $\phi$), the height of the granular stream h and acceleration due to gravity, $g$, which can be expressed in a functional form as
 \begin{equation} \delta = F\left(D, d, \theta, t, V, h, g \right). \end{equation}
 Using  $D$ and $V$ to normalize variables, (5.1) reduces to
 \begin{equation} \frac{\delta}{D} = g\left(\frac{d}{D}, \theta, \frac{t}{D}, \frac{h}{D}, \frac{gD}{V^2} \right). \end{equation}
 It is hypothesized that in the actual relationship perhaps the two non-dimensional numbers  $h/D$ and $gD/V^2$ occur as a product resulting in a frequently used Froude number $(V^2/gh)$ based on incoming velocity, $V$, and incoming stream height, $h$. Assuming the wedge angle $\theta$ is constant, (5.2) can be written in terms of Froude number as
 \begin{equation} \frac{\delta}{D} = f\left(\frac{d}{D}, \frac{t}{D}, Fr \right) \end{equation}
 Figure 16 shows the effects of scaling on the structure of the shock waves. The three wedges shown in figure 16(a–c) correspond to the side length  $D = 10$, 30 and 40 mm, respectively, while other parameters such as $\theta$ and $\phi$ are kept the same. The differences in the flow field for the three cases is evident from the figure. It is observed that the size of the inner static heap increases significantly on increasing the size of the wedge. For the $D = 10\,{\rm mm}$ case (figure 16a), an inner static heap is not observed, whereas, for the $D = 30$ and 40 cm cases, the inner static heaps are prominently visible. Furthermore, the heap angle appears to increase with the heap size (which in-turn increases with the wedge size). This is largely due to the frictional force acting between grains and the channel wall. When the size of the wedge is small, the grains hitting the wedge surface undergo dissipation but the wedge surface being small they easily escape the wedge surface and are shed into the wake. This effect results in either too small or a complete absence of static heap, as is observed in figure 16(a). For bigger wedge sizes, the grains hitting the wedge surface have sufficient space and opportunity (in the sense that they could undergo a large number of collisions before leaving the wedge surface) to lose their energy and get condensed into a static heap. This is the case in figure 16(b,c). The increase in the heap angle with the wedge size also follows from the same mechanism of frictional force. The static heap formed on the wedge surface is stabilized by a dynamic mechanism that involves the collisional dissipation between the free-stream grains and the static grains near the heap (see (Taberlet et al. Reference Taberlet, Richard, Valance, Losert, Pasini, Jenkins and Delannay2003) for relevant discussion). Thus, a bigger heap means more dissipation and a more effective stabilization mechanism, which causes the heap angle to increase with the heap size. Similar behaviour between the heap size and the angle of heap in a confined channel was also reported by Amarouchene et al. (Reference Amarouchene, Boudet and Kellay2001).

Figure 16. Detached granular shock waves on wedges of different sizes with  $\theta = 70^{\circ }$ and $\phi = 40^{\circ }$ and grain size $d=250\,\mathrm {\mu }$m. Wedges are linearly scaled: (a) $D = 10\,{\rm mm}$, (b) $D = 30\,{\rm mm}$ and (c) $D =40\,{\rm mm}$.
Variation of shock stand-off distance,  $\delta$, with channel inclination, $\phi$, for geometrically similar wedges and for G1 and G3 set of grains is shown in figure 17. The channel width and the free-stream conditions are kept fixed. Figure 17(a,c) shows shock stand-off distance in dimensional form, whereas figure 17(b,d) shows the same data when normalized by the characteristic length scale of the wedge, $D$. A generalized qualitative trend is observed from figure 17, where the value of shock stand-off distance decreases as the channel inclination $\phi$ is increased from 30 $^{\circ }$ to 50 $^{\circ }$ and remains fairly constant for higher values of channel inclination. As evident from figure 17, most of the data lies around $\delta /D=1$, indicating that the shock stand-off distance scales almost linearly with the wedge size $D$. While a good collapse in the shock stand-off data is not observed, the present results do indicate that the size of the wedge is one important parameter that directly influences the shock stand-off distance. Equation (5.3) shows that the shock stand-off distance is a function of the grain diameter, channel width and the channel inclination. However, when the shock stand-off distance is normalized by the wedge characteristic length $D$, it appears from figure 17 that the dependency of shock stand-off distance, $\delta /D$, on grain size is weak.

Figure 17. Variation of shock stand-off distance with  $\phi$. Results are shown for (a) G1: $d = 125\,\mathrm {\mu }{\rm m}$; (b) G1: $d = 125\,\mathrm {\mu }{\rm m}$; (c) G3: $d = 425\,\mathrm {\mu }{\rm m}$; (d) G3: $d = 425\,\mathrm {\mu }{\rm m}$.
6. Velocity distribution in granular shock wave
In the present section the flow field around the obstacle (triangular wedge) is analysed using velocity distributions obtained from PIV. The focus is on the shock detachment phenomenon and the shock evolution process during the transitional state. The analysis is done for grains with diameter  $d=500$ and $925\,\mathrm {\mu }{\rm m}$ (G3 and G4, respectively), since, for finer grains, it was not possible to track individual grain accurately even at high resolution. Furthermore, the observations drawn from the present analysis are generic for the class of grains considered here. The general features of the velocity distribution are initially discussed using particle velocity distribution functions and ‘ $u-v$’ scatter plots, where $u$ and $v$ are the components of velocity along the streamwise and cross-streamwise direction ( $x$ and $y$ directions, respectively).
A series of images are acquired at a high frame rate (1405 fps) from the initiation of flow to the fully developed shock wave. Two instances of the flow field of G4 ( $d=925\,\mathrm {\mu }{\rm m}$) are discussed here: (i) the instant when the shock wave is on the verge of detachment, and (ii) the fully developed steady state with a detached shock standing in front of the wedge, as shown in figure 18(a,b), respectively. The images are instantaneous and are taken with an exposure time of $28 \,\mathrm {\mu }{\rm s}$. When the gate is removed, grains accelerate down the channel to interact with the obstacle. As the grains strike the wedge surface, they undergo inelastic collisions that result in a loss of kinetic energy. To have a physical sense of the influence of inelasticity in the collisional dynamics, the coefficient of restitution, $e$, is estimated by using the relation
 \begin{equation} e = v_2/v_1, \end{equation}
where  $v_1$ and $v_2$ are the magnitudes of incident and reflected velocities of the grain striking the wedge surface. The average value obtained for a sample of 10 collisions is $e = 0.74$, which translates to a loss of $45\,\%$ of the kinetic energy possessed by the incident grain in a single collision. The grains that are reflected from the wedge surface are acted upon by gravitational force ( $g \sin (\phi )$) and momentum transfer from the incoming grains from the free stream. Consequently, they are dragged along the wedge surface to form a thin layer of densely packed grains that appear as an attached shock wave such as the one shown in figure 18(a). Figure 18(c) shows the velocity field of this early shock wave with velocity vectors and streamlines overlayed on either halves. The sharp turning and merging of the streamlines are the typical characteristic motion of a fluid particle across a shock wave. The blue region on the top represents the undisturbed supersonic free-stream flow, whereas the red region near the wedge tip represents the stagnant or creeping flow. The transition from supersonic to subsonic occurs in the thin zone represented by the white colour, where streamlines gradually curve into the shock wave. This is the non-equilibrium region within the shock thickness, and is formed as a result of multiple collisions of particles between the red (subsonic) and blue (supersonic) zone. From the velocity vectors it can be seen that there is a sharp reduction in velocity near the nose of the shock and vectors start growing as the grains slide down the wedge.

Figure 18. (a) An instantaneous image of a shock wave which is on the verge of getting detached and (b) image of a fully developed shock wave in granular flow past a triangular wedge (see supplementary movie 1 available at https://doi.org/10.1017/jfm.2022.5). Images correspond to  $\theta = 60^{\circ }$, $\phi = 33^{\circ }$ and $d=925\,\mathrm {\mu }{\rm m}$. Images (c,d) show velocity contours obtained from particle imaging velocimetry with streamlines and velocity vectors overlayed on the right and the left half, respectively. Plots (e, f) show velocity scatter plots for the streamwise and the transverse velocity components, and (g,h) show probability distribution functions (p.d.f.s) demonstrating two dominant peaks for upstream (supersonic) and downstream (subsonic) velocities across the shock wave. Velocity data are non-dimensionalized by the free-stream velocity.
Once the shock wave is formed on the wedge surface, as shown in figure 18(a), it serves as an ad-hoc granular bed for the grains approaching from the free stream. The incoming grains, therefore, do not strike the wedge walls, but instead strike the granular bed that is relatively soft. Consequently, the incident grains do not reflect back easily, and start getting accumulated near the shock front. As more and more grains accumulate near the shock front, a condensed region of stagnant grains is formed around the tip, and the shock front evolves into a smooth bow-type detached profile standing in front of the obstacle, as shown in figure 18(b). Once the stagnant heap grows to its maximum height, the grains no longer accumulate and simply slide down the heap. The velocity contours for a fully developed shock wave are shown in figure 18(d). The abrupt turning of the streamlines across the shock wave can be seen on the right-hand side of the image and the velocity vectors along the fully grown heap on the left-hand side.
Figure 18(e, f) shows the scatter plots obtained by plotting the  $x$ and $y$ components of dimensionless instantaneous velocities for the two cases. In figure 18(e) velocity points that are clustered near $v/V = 1$ represent the majority of the particles in the supersonic state within the free stream. Since the free stream consists of undisturbed particles, it represents a uniform scatter around the mean value, which is $v/V = 1.0$ and $u/V = 0.0$ for the two components of velocity. Since the flow field represented by figure 18(a,b) is spatially heterogeneous, the mean value of velocity varies spatially, i.e. each point in the domain has a local velocity distribution with a local mean and a local variance. Since PIV is done simultaneously over the entire domain, the velocity distribution is taken globally, which is justifiable in the present case since the velocity distribution is tightly clustered around the mean value. Sparsely distributed particles in the plot away from the cluster represent velocities of grains that have undergone dissipation due to interaction with the wedge. Very mild clustering can be observed in the bottom-left and bottom-right regions, which precisely represent particles that are deflected symmetrically by the lateral walls of the wedge in either direction. When the shock wave gets detached, the supersonic cluster gets thin as particles migrate from the supersonic regime to the subsonic, and a new cluster appears where both $v/V$ and $u/V$ are close to a value of zero, as can be seen in figure 18( f). Data around this cluster represent the subsonic or near-stagnant particles present between the shock front and the wedge tip. Particles in this region are not isotropically distributed around the mean value since they are guided by the wedge walls and the shock wave. An interesting feature of the scatter plot is that it effectively demonstrates the presence of an intermediate population of particles, which are present within the non-equilibrium shock wave region. This population is represented by the markers (dots), which do not lie in either cluster, and are the result of the interaction of free-stream particles with the wedge or the subsonic stream during the formation of the shock front.
Another way to represent the velocity data is in the form of probability distribution functions (p.d.f.s), as shown in figure 18(g,h). The p.d.f. for the first configuration, when the shock wave is on the verge of getting detached, is single peaked with subsonic population represented by a small bump near  $v/V = 0$ (see figure 18g), whereas, for a fully developed detached shock wave configuration, it is bimodal with two clear and distinct peaks; one near $v/V = 0$ that represents the subsonic mode, and the other near $v/V = 1.0$ representing the supersonic mode. As is evident, there is an intermediate population of particles with velocities ranging from subsonic to supersonic. The bimodal distribution of particles across the shock wave is the simplest but approximate approach of modelling the shock wave structure. Mott & Harold (Reference Mott and Harold1951) proposed a very simple and innovative approach of modelling the shock wave structure by superimposing two Gaussian distributions, one representing the supersonic stream and the other representing the subsonic region downstream of the shock wave. Applicability of the Mott-Smith model for granular shocks has been recently investigated by Vilquin et al. (Reference Vilquin, Boudet and Kellay2016, Reference Vilquin, Kellay and Boudet2018). Their results also demonstrated the presence of particles with intermediate velocities, as is evident from the scatter and the p.d.f. plots in the present case. They demonstrated that the intermediate population is obtained with few collisions between the two dominating streams.
Figure 19 shows snapshots of the transient phase during different stages of the shock wave formation for G3 grains with  $d = 500\,\mathrm {\mu }{\rm m}$ and $\phi = 33^{\circ }$ flowing around a wedge with $\theta = 50^{\circ }$ (see supplementary movie 2). The time instant of each frame is stated with reference to the residence time, $\tau$, defined as the time taken for the shock wave to fully form and stabilize. The residence time is $\tau = 0.57$ s for the present case. The entire transient phase is represented by six raw snapshots, $a$ through $f$, along with velocity contours, p.d.f.s and the scatter plot arranged vertically in the column.

Figure 19. Instantaneous snapshots and p.d.f.s of transient stages during shock wave formation for  $\theta = 50^{\circ }$, $\phi = 33^{\circ }$ and $d=500\,\mathrm {\mu }{\rm m}$. Results are shown for (a) $t/\tau = 0.22$, (b) $t/\tau = 0.44$, (c) $t/\tau = 0.67$, (d) $t/\tau = 0.78$, (e) $t/\tau = 0.89$, ( f) $t/\tau = 1$.
Figure 19(a) shows an attached shock wave with grains accumulated within a thin region near the wedge surface at time  $t/\tau =0.22$. The attached shock wave is the transitional state during the formation of a steady-state detached shock wave, as explained before. Supersonic grains in the free stream give a large peak in the p.d.f., whereas decelerated grains within the shock wave region give a small bump. The bump is centred around $v/V = 0.2$ indicating that grains are not decelerated to zero velocity and no stagnation zone exists around the wedge. From the ‘ $u-v$’ scatter plot, it is observed that particles that contribute to the formation of the bump in the p.d.f. are, in fact, the grains that get deflected and flow along the two inclined walls of the wedge (as seen by streamlines in the velocity contour plots). Therefore, these deflected particles appear as mild concentration at $u/V = {\pm }0.4$ in the ‘ $u-v$’ scatter. At the time $t/\tau =0.22$, the shock still remains attached but becomes thicker because of more grains getting deposited near the wedge. The bump in the p.d.f. is now slightly widened around $v/V = 0.2$. From the scatter plot, it is evident that even though the shock wave becomes thicker, grains do not undergo enough dissipation to stagnate, and, therefore, the region around $u/V = {\pm }0$ is sparsely populated. At $t/\tau =0.67$, as shown in figure 19(c), the shock wave is detached with a large portion of grains being densely packed around the wedge. The detachment modifies the shock structure from a straight oblique profile to a curved bow-type structure. Furthermore, the streamlines in the case of attached shock follow the wedge surface and the streamlines turn smoothly near the wedge tip. On the other hand, in the case of the detached shock wave the streamlines turn abruptly at the wedge tip and appear to follow the bow-type trajectory near the shock envelope, as is evident from the velocity contours of figure 19(c). Two important developments in the p.d.f. due to detachment are observed: (1) the mild bump that is observed for the attached shock wave has now evolved into a distinct peak, and (2) the peak is centred around $v/V = {\pm }0$, indicating that the majority of the population between the shock periphery and the wedge surface is stagnant. In addition, due to the migration of particles from the supersonic to subsonic regime, the supersonic distribution near $v/V = 1$ is slightly thinner in comparison to the previous two cases of the attached shock. A similar observation can be made from the ‘ $u-v$’ scatter plots.
As the flow develops further, more grains are piled up in the stagnant region near the wedge tip, and the shock envelope goes farther from the wedge. A bigger stagnant zone is evident from the contour plots in figure 19(d,e). The subsonic peak around  $u/V = 0$ becomes sharper and ultimately comparable to the supersonic peak when the shock wave is fully developed at $t/\tau =1$, as can be seen in figure 19( f). While the peak of the subsonic mode rises progressively post detachment, the p.d.f. for the intermediate population of particles (see the p.d.f. for $0 \leq u/V \leq 0.5$ in figure 19d–f) demonstrates particles in the fluid-like regime, which slide on the static heap. Thus, as we move from left to right in the p.d.f., the behaviour of grains changes from solid to liquid and eventually to the gas-like regime in the supersonic regime.
It is observed here that the inner static heap behaves as an integral part of the wedge and in a way is responsible for the detachment of the shock wave. During the transient phase of the shock wave development post detachment, it is actually this heap that grows while there is always a fluid-like layer of grains that keeps sliding and qualitatively remains the same. Interestingly, and like in other previous studies (Amarouchene et al. Reference Amarouchene, Boudet and Kellay2001; Ancey Reference Ancey2001; Khakhar et al. Reference Khakhar, Orpe, Andresén and Ottino2001; Taberlet et al. Reference Taberlet, Richard, Valance, Losert, Pasini, Jenkins and Delannay2003), the static heap remains stable as long as there is a feeding of grains from the hopper. Once the flow stops, the static heap destabilizes and flows down the wedge. Therefore, the static heap is in a dynamic state (in a fully developed state of detached shock wave), since it is stabilized by the layer of grains flowing atop it, and its stability is supported by the friction imparted by the walls. The static heaps observed in detached shocks in the present experiments are similar to those observed by Taberlet et al. (Reference Taberlet, Richard, Valance, Losert, Pasini, Jenkins and Delannay2003) and were termed as the super stable heaps. They also observed that granular material between a thin channel on an inclined chute creates a stagnant zone that was stabilized by the grains flowing atop it.
The presence of the static heap demonstrates the strong influence of the Coulombic friction and inelasticity in collisions on the dynamics of granular fluids. To understand the mechanism of shock detachment in a confined channel, it is important to discuss the role of collisions and the wall friction in the dynamics of the process of the static heap formation in the transition phase. Frictional dissipative effects are dominant in the frictional regime, i.e. when the medium is dense and slowly sheared, it results in long-lived persistent contacts between neighbouring particles. This is the case with the fluid-like layer that slides on the static heap. On the other hand, losses due to inelasticity in collisions are more prominent in dilute and highly sheared granular flows. Later flows behave more like gases where particles travel a sufficient distance before colliding with other particles, and such collisions can be assumed instantaneous for deducing macroscopic properties (Campbell Reference Campbell1990; Goldhirsch Reference Goldhirsch2003; Nedderman Reference Nedderman2005). This behaviour is observed on the outermost periphery of the shock wave, where grains coming from the gas-like free streamstrike.
During the initial phase of the flow development, the region around the wedge is less populated, and, therefore, grains striking the wedge surface undergo fewer collisions. Even though a single collision of the grain with the wedge causes a loss of as much as  $50\,\%$ of the kinetic energy, the overall dissipation due to a fewer number of collisions is not enough to render them motionless. In other words, grains do not undergo granular collapse. These grains tend to bounce away from the wedge and in the process they interact with other grains that are coming from the top (free stream). The overall outcome of this interaction is the compression of grains within a thin layer near the wedge that appears as an attached shock wave. As the flow develops further, the grains from the free stream when approaching the wedge undergo more collisions and suffer more dissipation. These grains now bounce between the granular layer on the wedge (detached shock region) and the supersonic grains from the free stream. This causes grains to pile up on the wedge and fill the entire depth of the channel around the wedge. These low momentum grains are finally ceased due to frictional resistance imparted from both the channel walls, and the shock wave detaches with a static heap of stagnant grains on top of the wedge. As more and more grains are piled up, due to friction from walls and collisional dissipation, the static heap grows into a big triangular zone, as shown in figure 19( f). It is because of collisional dissipation due to incoming grains that keep the heap stabilized and static, and once the feeding is stopped from the hopper, the stagnant grains are remobilised due to their own weight, and the heap breaks down.
The transient growth of the stagnant zone does not go on indefinitely, it eventually ceases after achieving the steady state. The growth of the heap is checked by the inclination of the stagnant zone, which is characterized by the angle of repose, which could change with the experimental conditions. It is the formation of this heap that is affected both by the velocity of the incoming granular stream and, more importantly, by the included wedge angle,  $\theta$. For a particular set of parameters, the heap grows to attain that angle, and once that is achieved, all the grains coming from the top simply slide down without effectively adding anything to the stagnant zone. When this happens, the detached shock wave structure achieves the fully developed steady state.
The angle of repose is measured from the time-averaged snapshots such that the stagnant heap is demarcated from the moving layer flowing atop it through motion blur. The time-averaged counterpart of the image is shown in figure 18(a), and the measured angle of repose,  $\chi$, is shown in figure 20. It is important to note that the angle of repose shown in figure 20 is specific to the present experimental configuration, and is different from the general definition of the angle of repose based on the formation of a conical heap on the free surface (Zhou et al. Reference Zhou, Xu, Yu and Zulli2002).

Figure 20. Time-averaged snapshot of a shock wave indicating the angle of repose measured with respect to the wedge base orientation.
Figure 21 shows the angle of repose,  $\chi$, of the inner stagnant zone as a function of channel inclination for different grain systems and wedge angle $\theta$. The values of the angle of repose obtained in these experiments are much higher than the general angle of repose, which hovers around 15 $^{\circ }$ depending on the grain diameter. As can be seen, the higher the wedge angle, $\theta$, the higher the angle of repose. For higher values of $\theta$, the grains have more tendency to stick to the surface since the component of gravitational force along the wedge wall decreases, whereas the component normal to the wall that is responsible for friction force between the grain and the wall surface increases. Therefore, both the angle of repose and the shock stand-off distance is found to increase with an increase in the wedge angle, $\theta$.

Figure 21. Angle of repose of the static heap inside the detached shock wave.
The velocity field obtained from PIV can be used to estimate the shock profiles and the shock wave thickness for different experimental parameters. Figure 22 shows a typical shock wave profile obtained by plotting velocity magnitude across a shock wave. Note that the velocity is normalized by the free-stream velocity and the shock wave thickness is normalized by the grain diameter. The zero of the  $x$-axis corresponds to the wedge tip and negative values show the upstream region. The profile looks smooth since it is obtained from a time-averaged flow field. The velocity profile exhibits a typical shock wave characteristic, where it suddenly drops from a high value in the upstream to a low value downstream of the shock wave. The spatial extent of this transition gives the shock wave thickness, $\kappa$, as shown in figure 22. The value of the shock wave thickness (normalized by grain diameter) with channel inclination is shown in figure 23(a), and lies typically around 10–15 times the grain diameter. In order to gain some understanding of the strength of the shock wave, the ratio of the volume fractions across the shock wave ( $\nu _2$/ $\nu _1$) is plotted for different channel inclinations. The volume fraction $\nu$ is defined as the volume occupied by the grains divided by the total volume under consideration and is an important ingredient that is needed when gas-kinetic theory is used for modelling granular flows (Vilquin et al. Reference Vilquin, Boudet and Kellay2016, Reference Vilquin, Kellay and Boudet2018). The upstream volume fraction $\nu _1$ is estimated from the free stream using the particle tracking methodology. The exercise is repeated, and average estimates are used. Measurement of the volume fraction downstream of the shock wave $\nu _2$ is difficult from the present data, and, therefore, a constant value of 0.6 is used, which is a reasonable estimate for a random close-packing volume fraction for spherical particles. Earlier studies also suggest that this value of volume fraction for a static region of the heap near the wedge is a decent approximation (Vilquin et al. Reference Vilquin, Kellay and Boudet2018). The ratio $\nu _2/\nu _1$ increases with the channel inclination indicating that the shock strength increases with the incoming flow velocity. Furthermore, the present results show that the variation is not very sensitive to the grain size.

Figure 22. Velocity profile across a granular shock wave (G4,  $\theta = 60^{\circ }$ and $\phi = 33^{\circ }$).

Figure 23. Variation of shock thickness (a) and the volume fraction ratio (b) across the shock wave with channel inclination  $\phi$.
7. Conclusions
A quasi-two-dimensional closed experimental model was used to show that oblique attached and detached bow shock waves were formed when a rapid granular stream was displaced by a triangular wedge with a sharp tip. Like gas dynamic shocks, the granular shock detachment phenomenon is strongly governed by the flow deflection angle and the free-stream velocity. In the present work an intermediate regime was identified where the shock wave was neither completely attached nor detached, indicating that the shock detachment is not an abrupt phenomenon. For small wedge angles and higher flow velocities, the attached shock wave was found to locate away from the wedge tip, which appears as a kink in the shock profile. As the wedge angle was increased and/or the flow velocity was decreased, the kink from both the sides of the wedge was found to approach the tip, and eventually, the shock wave is detached from the wedge. For attached shocks, the wedge tip remained exposed to the free-stream grains and caused grains to splash, whereas detached shock waves were observed to house stagnant grains piled up on the wedge tip. Many of these flow features were found to be peculiar to granular flows with no correspondence to continuum fluid dynamics. The effect of grain size on the shock wave structure and the shock detachment angle was quantified by measuring the shock stand-off distance.
From scaling analysis it was observed that the value of shock stand-off distance scaled almost linearly with the size of the wedge for a given condition of the granular free stream. These results are particularly helpful in suggesting that if a thorough analysis is performed while incorporating other experimental conditions, such as the free-stream granular layer thickness as was done by Amarouchene et al. (Reference Amarouchene, Boudet and Kellay2001), more conclusive and generalized scaling laws can be realised.
Probability distribution functions and ‘ $u-v$’ scatter plots were used to demonstrate the evolution of shock wave detachment. The supersonic undisturbed granular stream inside the channel was represented by a uniform bell-shaped velocity distribution around the mean value. The formation of a shock wave caused particles to migrate from supersonic to subsonic regions resulting in a bimodal distribution that becomes more prominent when the shock wave is detached. The transitional stages of shock wave development were thoroughly discussed. It also showed the presence of an intermediate population that did not belong to either of the dominant modes. The thickness of the shock wave is found to be around 15 particle diameters and the strength of the shock waves, which is quantified by the ratio of the volume fraction across the shock waves, increases with the flow velocity. The present results show that the thickness and the strength of granular shocks does not vary much with the grain size.
The mechanism and evolution of shock detachment with a quasi-static heap on the wedge top was discussed. The collisional and frictional dissipation were observed to go hand-in-hand in the process of shock detachment. Initially, it is the collisional dissipation that dominates and causes deceleration of fast-moving supersonic grains. Once these grains are slowed down enough, they start accumulating around the wedge, and this is when the frictional dissipation takes over amongst the grain-grain pairs and between the grains and the channel walls. These stagnant grains result in a static heap that is stabilized due to forces imparted by a fluidized layer atop it.
The flow field discussed in the present work demonstrated many similarities with the open channel flows, but also revealed new flow features that are peculiar to confined geometries such as the one considered here. Modelling such flows is challenging due to the presence of extreme flow regimes; dilute and rapid in the upstream region of the shock wave, whereas slow and dense in the downstream region. A major difficulty arises due to the lack of accurate constitutive relations necessary to capture the shear rheology exhibited by dense granular systems. A plausible approach to model these flows is to use Navier–Stokes equations for gravity-driven shallow flows (Savage & Hutter Reference Savage and Hutter1989). Earlier studies have shown that many of the important flow features are successfully modelled by assuming constant velocity across the flow depth, the free surface on the top and frictional resistance at the base (Gray et al. Reference Gray, Tai and Noelle2003; Forterre & Pouliquen Reference Forterre and Pouliquen2008). The flow configuration in the present case is different since the very condition of the free surface on the top is violated near the obstacle due to the presence of the upper wall. Therefore, it remains to see how well and to what extent the depth-averaged flow equations are capable of predicting flow features observed in the present study.
Supplementary movies
Supplementary movies are available at https://doi.org/10.1017/jfm.2022.5.
Acknowledgements
The authors are thankful to Professor K. Poddar for providing some necessary equipment for the experiments. The authors also thank the reviewers for their help in improving the manuscript.
Funding
This research was supported by Science and Engineering Research Board (SERB) through grant no. CRG/2020/000504.
Declaration of interests
The authors report no conflict of interest.
Appendix

Figure 24. Variation in the shock wave structures with wedge angle  $\theta$ for grains G2, $250 \pm 50\,\mathrm {\mu }{\rm m}$ at channel inclination, $\phi = 60^{\circ }$. Results are shown for (a) $\theta = 10^{\circ }$, (b) $\theta = 20^{\circ }$, (c) $\theta = 30^{\circ }$, (d) $\theta = 40^{\circ }$, (e) $\theta = 45^{\circ }$, ( f) $\theta = 50^{\circ }$, (g) $\theta = 60^{\circ }$, (h) $\theta = 70^{\circ }$, (i) $\theta = 80^{\circ }$.

Figure 25. Variation in the shock wave structures with wedge angle  $\theta$ for grains G3, $500 \pm 50\,\mathrm {\mu }{\rm m}$ at channel inclination, $\phi = 60^{\circ }$. Results are shown for (a) $\theta = 10^{\circ }$, (b) $\theta = 20^{\circ }$, (c) $\theta = 30^{\circ }$, (d) $\theta = 40^{\circ }$, (e) $\theta = 45^{\circ }$, ( f) $\theta = 50^{\circ }$, (g) $\theta = 60^{\circ }$, (h) $\theta = 70^{\circ }$, (i) $\theta = 80^{\circ }$.

Figure 26. Variation in the shock wave structures with wedge angle  $\theta$ for grains G4, $925 \pm 50\,\mathrm {\mu }{\rm m}$ at channel inclination, $\phi = 60^{\circ }$. Results are shown for (a) $\theta = 30^{\circ }$, (b) $\theta = 40^{\circ }$, (c) $\theta = 50^{\circ }$, (d) $\theta = 60^{\circ }$, (e) $\theta = 70^{\circ }$, ( f) $\theta = 80^{\circ }$.


 Open access