


Introduction
With its enormous morbidity and noticeable mortality rates [Reference Monto1], influenza has long been a serious public health issue. Historically, several pandemics such as the Spanish A/H1N1 influenza in 1918, Asian A/H2N2 influenza in 1957, Hong Kong A/H3N2 influenza in 1968, and most recently, A/H1N1pdm09 influenza in 2009 have recurred, killing millions of people and dramatically affecting the economy and society [Reference Potter2–Reference Dawood4]. In addition to these pandemics, the influenza virus induces seasonal epidemics every year, resulting in 3–5 million cases of severe illness and approximately 250 000–500 000 deaths worldwide [5].
Despite 70 years of influenza control [6], our understanding of its transmission is still limited [Reference Brankston7, Reference Killingley and Nguyen-Van-Tam8]. The transmission modes of the influenza virus are controversial [Reference Brankston7, Reference Tellier9–Reference Zhang12], particularly regarding whether influenza is transmitted via the long-range airborne route, the close contact route, the fomite route or combinations of these routes. The close contact route here includes short-range airborne transmission, direct inhalation of droplet nuclei from the expiratory air stream of the infector and direct deposition of large droplets on the mucous membranes of susceptible individuals. Because of this knowledge gap, the recommendations of non-pharmaceutical interventions from the World Health Organisation (WHO) [5] and the Centers for Disease Control and Prevention (CDC) [11] are aimed at all possible influenza transmission routes. Better knowledge of influenza transmission could promote the development and selection of more appropriate infection control measures in healthcare settings, at workplaces and in homes [Reference Brankston7, Reference Killingley and Nguyen-Van-Tam8].
To further investigate the transmission modes of the influenza virus, we conducted a mathematical modelling study in a 2008 nosocomial outbreak in Hong Kong [Reference Wong13]. In this outbreak, since the index patient and most other inpatients were bed-bound during their illnesses [Reference Wong13], we excluded the possibility of the close contact transmission between inpatients. On the basis of the other two transmission routes, three kinds of hypotheses of transmission modes were formulated between index patient and other inpatients: single-route long-range airborne transmission (Hypothesis 1 (Long air)), single-route fomite transmission (Hypothesis 2 (Fomite)) and the combined two-route transmission (Hypothesis 3 (Long air + Fomite)). Furthermore, we assumed three representative healthcare workers’ (HCWs’) routine round patterns, and subdivided Hypotheses 2 and 3 into Hypotheses 2 (Fomite (Pathway 1)), 2 (Fomite (Pathway 2)), 2 (Fomite (Pathway 3)), 3 (Long air + Fomite (Pathway 1)), 3 (Long air + Fomite (Pathway 2)) and 3 (Long air + Fomite (Pathway 3)), respectively. We applied a multi-agent model to simulate how the viruses were transmitted from the index patient to susceptible people by airflow and surface touching to determine the exposure doses and infection risks. We considered 1140 scenarios with various values of four important parameters and conducted least-squares fitting for each scenario to evaluate the hypotheses by comparing the distribution of the predicted infection risk with that of the reported attack rates [Reference Wong13]. The results provide probable evidence for influenza transmission modes in different scenarios.
Methods
Outbreak
As shown in Figure 1, the outbreak occurred in a general medical ward in the Prince of Wales Hospital in Hong Kong in March and April 2008 [Reference Wong13]. According to the identical viral sequencing results [Reference Wong13], all the secondary cases were assumed to be due to a single index patient, a 68-year-old man who developed symptoms of an acute exacerbation of chronic obstructive pulmonary disease on 27 March and was admitted to Bed 24 in the ward. He was bed-bound (i.e. was non-ambulatory and unable to walk around the ward by himself) since hospitalisation due to respiratory failure and required non-invasive positive pressure ventilation (NPPV) in the evening on 31 March 2008 as his condition deteriorated with increasing respiratory distress. It was therefore assumed that this index patient acted as a single, ‘static’ source for this outbreak.
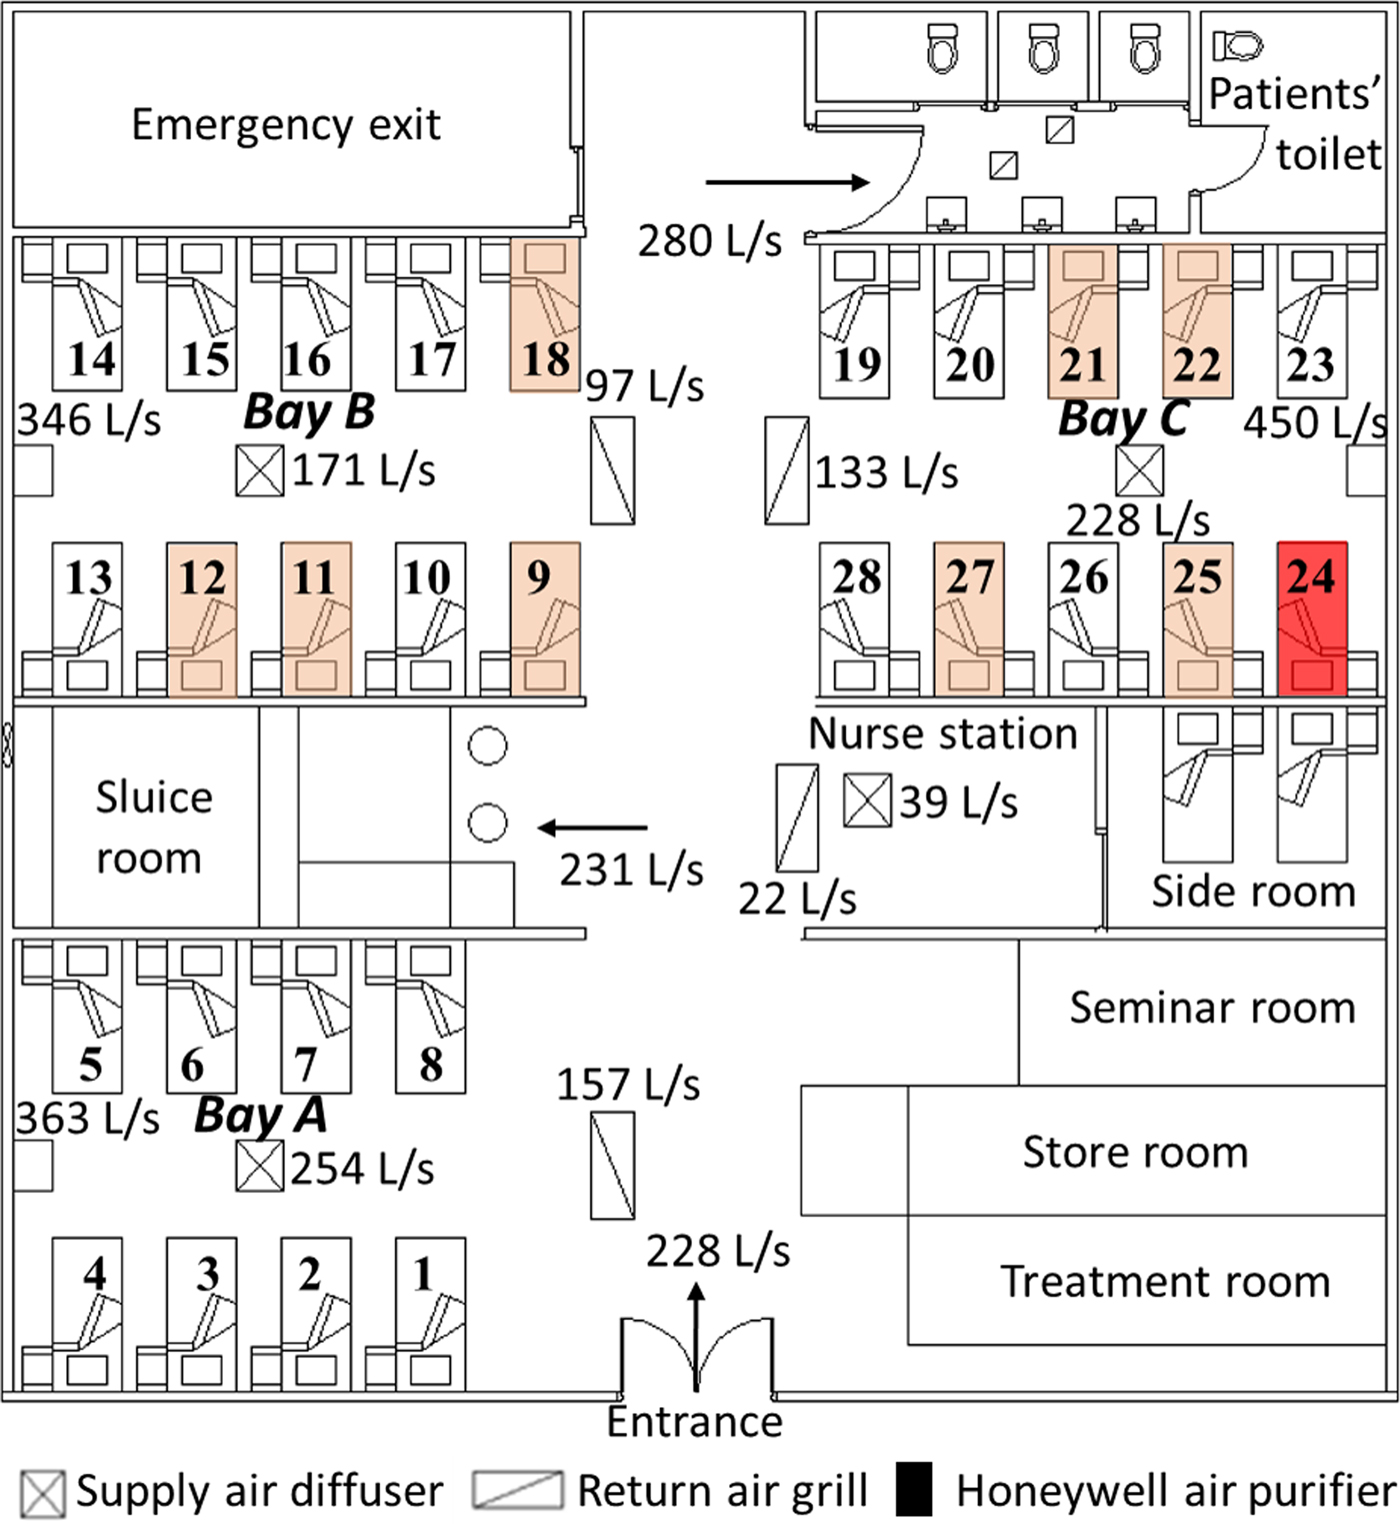
Fig. 1. Floor plan of the outbreak ward and the measured airflow rates (L/s) at different locations [Reference Wong13]. The bed (No. 24) of the index patient is marked in red and the beds (Nos. 9, 11, 12, 18, 21, 22, 25 and 27) of the infected patients are marked in pink.
On 1 April, he was transferred to the intensive care unit for invasive (i.e. closed circuit) mechanical ventilation; the influenza H3N2 (Influenza A/Brisbane/10/2007) virus was later isolated from a tracheal aspirate sample [Reference Wong13]. Thus, the period from 27 to 31 March 2008 was taken as the potential exposure period.
The outbreak ward contained a common patients’ toilet, a long corridor and three bays, consisting of 28 beds (Beds 1–8 in Bay A, Beds 9–18 in Bay B and Beds 19–28 in Bay C). The adjacent beds were about 1 m apart. Three high-efficiency particulate absorbing (HEPA) air purifiers were positioned at the wall end of the three bays, along with four fan-coil units (one in each bay and one over the nurses’ station) and four return air grills in the corridor. All HEPA filters were assumed to function with 100% filtration of the modelled droplet nuclei [Reference Wong13]. The measured airflow rates in the ward are shown in Figure 1. During the outbreak, the HEPA air purifiers in Bays A and B were set to ‘low’ and that in Bay C was set to ‘medium’, with injection velocity 1.47, 1.44 and 1.90 m/s, respectively [Reference Wong13].
In this research, we identified people in six representative roles (inpatients, visitors, doctors, nurses, health assistants and cleaners) as the study objects and focused on the infection patterns of the inpatients in the three bays. We assumed that all exposure doses received by the susceptible patients came from the index patient due to his respiratory activities, such as coughing. As shown in Figure 2a, c and e, we assumed three representative HCWs’ routine round pathways. In Pathway 1 (Fig. 2a), HCWs were responsible for all inpatients and examined them in the ward in a clockwise direction. In Pathway 2 (Fig. 2c), each doctor and each nurse were responsible for the inpatients in a bay and examined them in a clockwise or anticlockwise direction. In Pathway 3 (Fig. 2e), each doctor and each nurse allocated the patients in the order in which they arrived and thus, examined a random set of nine or ten inpatients (as denoted by the circles of three different colours) in the ward in a clockwise direction.
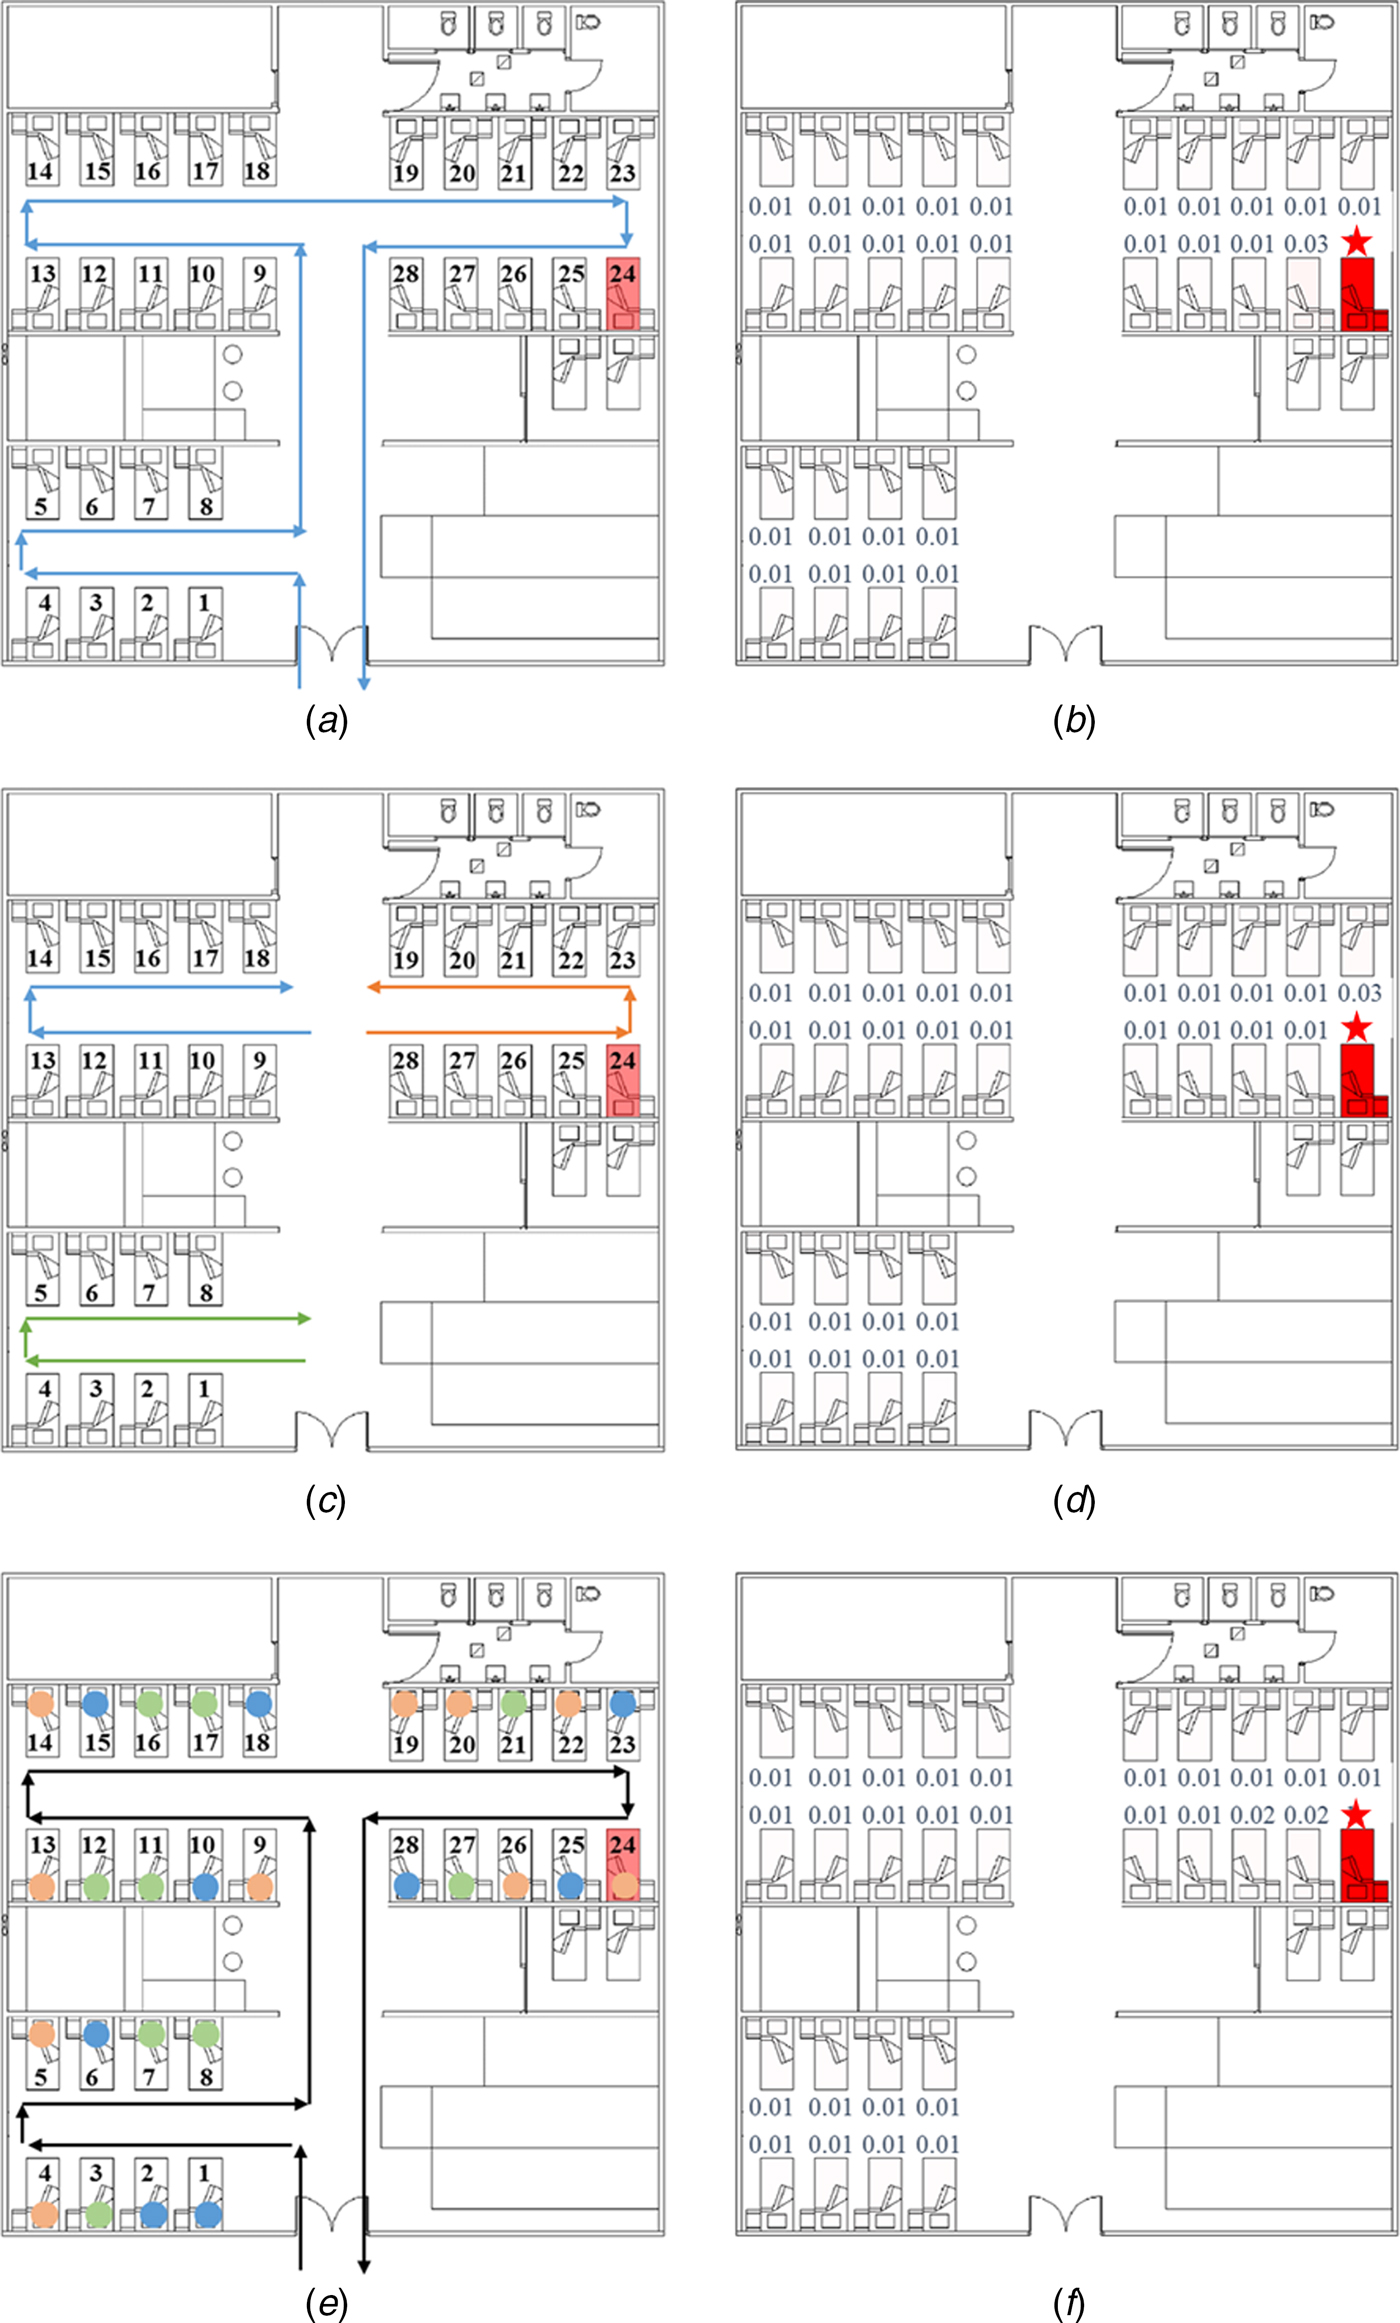
Fig. 2. Healthcare workers’ (HCWs’) routine round patterns and predicted infection risks. (a) HCWs’ routine patient care contact Pathway 1. (b) Predicted average infection risk distribution (for 1000 simulations) via the fomite route (Pathway 1) at 24:00 on 31 March, the end of the exposure period. (c) HCWs’ routine patient care contact Pathway 2. (d) Predicted average infection risk distribution via the fomite route (Pathway 2). (e) HCWs’ routine patient care contact Pathway 3. (f) Predicted average infection risk distribution via the fomite route (Pathway 3). The largest virus-containing droplet size d g = 200 µm, the dose-response parameters in the respiratory tract α r = 1.03/TCID50 and on mucous membranes α m = 0.0014/TCID50 and the viral load L 0 = 109 TCID50/ml. The predicted average infection risk for every inpatient is marked in (b), (d) and (f). The bed marked with a star represents that of the index patient.
During the hospitalisation of the index patient, eight of the 59 inpatients were infected by the same H3N2 virus subtype (Influenza A/Brisbane/10/2007), as determined by nucleotide sequence analysis. The distribution of the infected inpatients is shown in Figure 1, with the highest attack rate (0.222; four of 18 inpatients) in the adjacent cubicle (Bay B) and a slightly lower rate (0.200; four of 20 inpatients) in the source cubicle (Bay C); no patients were infected in the remote cubicle (Bay A) [Reference Wong13].
Multi-agent modelling framework
A multi-agent modelling framework [Reference Xiao14, Reference Xiao15] was used to calculate the infection risk of the inpatients from the three hypothesised influenza transmission modes described above. The mathematical model was implemented in MATLAB R2014a (Mathworks, USA). In this framework, we considered 18 types of representative surfaces (Supplementary Table S2) and categorised them into five types of material according to their properties: porous surfaces, non-porous surfaces, toilet surfaces, skin and mucous membranes in the eyes, noses and mouths (Supplementary Table S2). For the different roles of people studied, we considered various types of behaviours; the frequencies and the sequences of touching were assumed and are summarised in Supplementary Tables S7 and S8, respectively.
Further, in the above framework, three mathematical models were applied to calculate the amount of exposure. For the long-range airborne route, a multi-zone model [Reference Xiao14–Reference Li17] was used to acquire the aerosol concentrations in the six zones of the outbreak ward (Supplementary Fig. S1), and a long-range airborne route exposure model [Reference Xiao14, Reference Xiao15] was used to calculate the exposure doses in the respiratory tract. For the fomite route, a surface contamination model [Reference Xiao14, Reference Xiao15, Reference Xiao, Tang and Li18] was used to calculate the virus concentration on multiple environmental surfaces and the exposure doses on the mucous membranes. With the obtained exposure doses, a dose–response relationship model [Reference Xiao14, Reference Xiao15, Reference Xiao, Tang and Li18–Reference Zhang20] was used to calculate the infection risk.
As in previous studies [Reference Xiao14, Reference Xiao15], we identified some important but uncertain parameters, including the largest virus-containing droplet size d g, dose–response parameters in the respiratory tract α r and on the mucous membranes α m, and the viral load L 0. To reduce the number of variables, α r, α m and L 0 were combined as the products α rL 0 and α mL 0, which are defined as the dose effects of introducing 1 ml of virus-laden droplets with a viral load of L 0 into the respiratory tract and the mucous membranes, respectively. On the basis of the existing literature, we investigated the ranges of three parameters: d g (four values: 20, 50, 100 and 200 µm), α rL 0 (21 values: 105–1010/ml) and α mL 0 (21 values; 102–107/ml). In this study, we considered 1140 scenarios with different value combinations of the parameters (α rL 0, α mL 0, d g) and ran simulations 1000 times for each scenario.
In each scenario, according to the dose–response relationship model [Reference Xiao14, Reference Xiao15, Reference Xiao, Tang and Li18–Reference Zhang20], the infection risk I was calculated as [Reference Xiao15].
 $$I = 1 - {\rm e}^{ - c_{\rm a} \alpha _{\rm r} D_{\rm a} (d_g, \; \,L_0 ) - c_{\rm f} \alpha _{\rm m} D_{\rm f} (d_{\rm g}, \; \,L_0 )} $$
where c a equals 1 if the long-range airborne route exists and 0 otherwise, and c f is the indicator for the fomite route. The exposure dose due to the long-range airborne route D a and that due to the fomite route D f are functions of d g and L 0.
Least-squares fitting
To evaluate each transmission hypothesis, we compared the spatial distribution of the infection risk under each hypothesis to the reported attack rates. In this study, we chose a statistical approach, maximising fit, to select the probable hypothesis [Reference Johnson and Omland21]. In particular, we used the least-squares fitting method, which takes the residual sum of squares (RSS) as a measure of fit [Reference Draper, Smith and Pownell22]. Because a small RSS indicates a good fit of the model to the data, the hypothesis with the minimum RSS was regarded as a probable explanation to the outbreak [Reference Xiao15].
Results
Spatial patterns of the predicted infection risk
The average infection risk distributions of 1000 simulations at the end of the exposure period via fomite routes (three patterns) and the long-range airborne are shown in Figures 2b, d, f and 3b, respectively. In these distributions, the values of parameters (α rL 0, α mL 0, d g) were set to be the same.
For the long-range airborne route, the infection risk was the highest in Bay C (the source cubicle), lower in Bay B (the adjacent cubicle) and the lowest in Bay A (the remote cubicle), which is consistent with the virus concentration distributions obtained from computational fluid dynamics (CFD) simulations [Reference Wong13] and multi-zone modelling methods (Fig. 3a). Virus-containing aerosols were generated during the index patient's respiratory therapy with NPPV, so the virus concentration was the highest in the source cubicle. According to the locations of the supply air diffusers and the return air grills shown in Figure 1, the cubicles had positive pressure towards the corridor. Nevertheless, because of the small temperature difference, two-way airflow patterns occurred at the opening between the corridor and the cubicles, leading to a significant air exchange between the corridor and the cubicles [Reference Chen23]. Moreover, the bed of the index patient was right next to a HEPA air purifier in the source cubicle, and this purifier had a higher air injection velocity than that in the adjacent cubicle, leading to more contaminated air being pushed into the corridor and the adjacent cubicle [Reference Wong13]. Thus, the virus-containing aerosols spread to the other areas of the ward with the airflows. Because the air in the remote cubicle was more diluted than that in the adjacent cubicle, the airborne droplet concentration (Fig. 3a) and infection risk (Fig. 3b) were the lowest in the remote cubicle. Since the filtration efficiency of HEPA air purifiers was about 100%, the overall infection risk was not high, and the difference between the infection risk in the source ward and that in the remote ward was large (Fig. 3b), which was consistent with CFD simulations in a similar hospital ward [Reference Qian24].
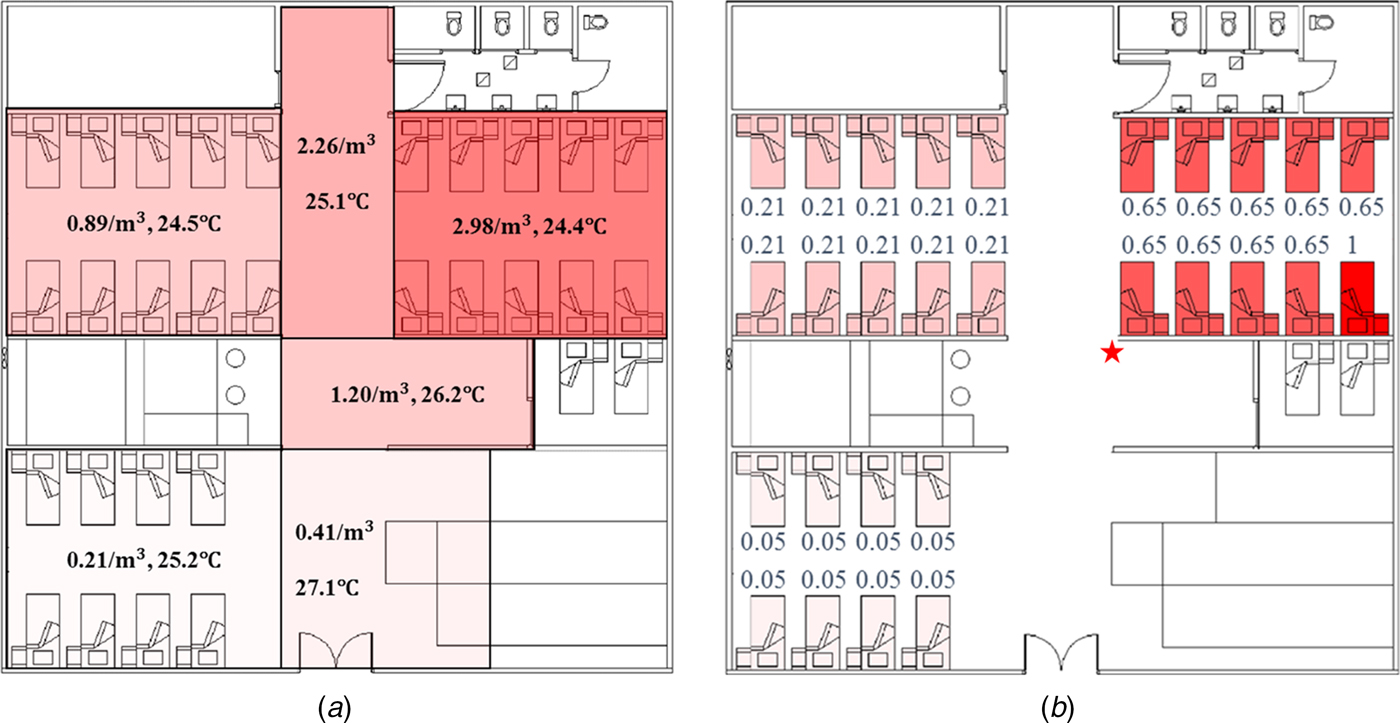
Fig. 3. Distributions of airborne droplets and predicted infection risk. (a) Distributions of airborne droplets (number/m3) and temperature (°C) obtained using multi-zone methods. (b) Predicted average infection risk distribution (for 1000 simulations) via the long-range airborne route at 24:00 on 31 March, the end of the exposure period. The largest virus-containing droplet size d g = 200 µm, the dose-response parameters in the respiratory tract α r = 1.03/TCID50 and on mucous membranes α m = 0.0014/TCID50 and the viral load L 0 = 109 TCID50/ml. The predicted average infection risk for every inpatient is marked in (b). The bed marked with a star represents that of the index patient.
For the fomite route, the infection risk for all susceptible people was very low. In hospital wards, the transmission of the virus via the fomite route depends mainly upon the HCWs’ hands and the environmental surfaces [Reference Xiao14, Reference Xiao15]. Because of the rapid natural inactivation rates on the skin (Supplementary Table S4), the contribution of HCWs’ hands to the infection was very low; therefore, the routine care pathways of the HCWs would have had very little effect on the infection risk distributions, except for a few patients who were specifically visited by HCWs after the index patient (Bed 25 in Fig. 2b, Bed 23 in Fig. 2d and Beds 25 and 26 in Fig. 2f). Thus, the common environmental surfaces, such as those in the toilets, played a predominant role in spreading the virus via the fomite route. Because all susceptible people had the same opportunity to touch the common surfaces, they were expected to receive equivalent exposures from the common surfaces. Thus, the average infection risk of 1000 simulations was equivalent for most of the susceptible people.
Predicted distributions with the best fitness
Table 1 shows scenarios with the best fitness (the minimum RSS) for the hypotheses. Among the single-route modes, Hypothesis 1 (Long air) had the best fitness because it could predict the infection risk quantitatively as compared to the attack rates. The fitness of Hypothesis 2 (Fomite) was poor for all of the three pathways because the infection risk via the fomite route was very small, which deviated largely from the attack rates in all the scenarios. Thus, a higher infection risk via the fomite route would lead to better fitness, so in scenarios with the best fitness for the hypotheses related to the fomite route (Hypotheses 2 and 3 in Table 1), the largest virus-containing droplet size is 200 µm, the largest value assumed for the parameter.
Table 1. Scenarios with the best fitness (minimum residual sum of squares, RSS) for Hypotheses 1 (Long air), 2 (Fomite (Pathway 1)), 2 (Fomite (Pathway 2)), 2 (Fomite (Pathway 3)), 3 (Long air + Fomite (Pathway 1)), 3 (Long air + Fomite (Pathway 2)) and 3 (Long air + Fomite (Pathway 3))
a d g denotes the largest virus-containing droplet size.
b α rL 0 and α mL 0 denote the products of the viral load and the dose–response parameters in the respiratory tracts and on the mucous membranes, respectively.
As shown in Table 1, hypotheses involving the long-range airborne route (Hypotheses 1 and 3) had better fitness than others, and the role of the long-range airborne route was always predominant. From Table 1, the reported attack rate in adjacent ward (Bay B) was actually larger than the source ward (Bay C) while the predicted infection risk of the long-range airborne route in Bay B was much smaller than that in Bay C. Since the predicted infection risk of the fomite route in Bay B was similar to that in Bay C, the combination of the two routes (namely Hypothesis 3) would have better fitness than the single routes. Compared with the other two pathways, Hypothesis 3 (P2) resulted in the prediction most consistent to the attack rates. In the transmission, the long-range airborne route contributed approximately 94% to the infection risk, whilst the fomite route only contributed about 6%.
Figure 4 shows the hypotheses with the best fitness (i.e. the minimum RSS) in the 1140 scenarios. In scenarios with d g of 20 µm (Fig. 4a), all virus-containing droplets were very small and could remain suspended in the air for a long time. The deposition of virus-containing droplets on the surfaces was severely weakened, which leads to the negligible infection risk via the fomite route. Thus, no hypotheses related to the fomite route are shown in Figure 4a.
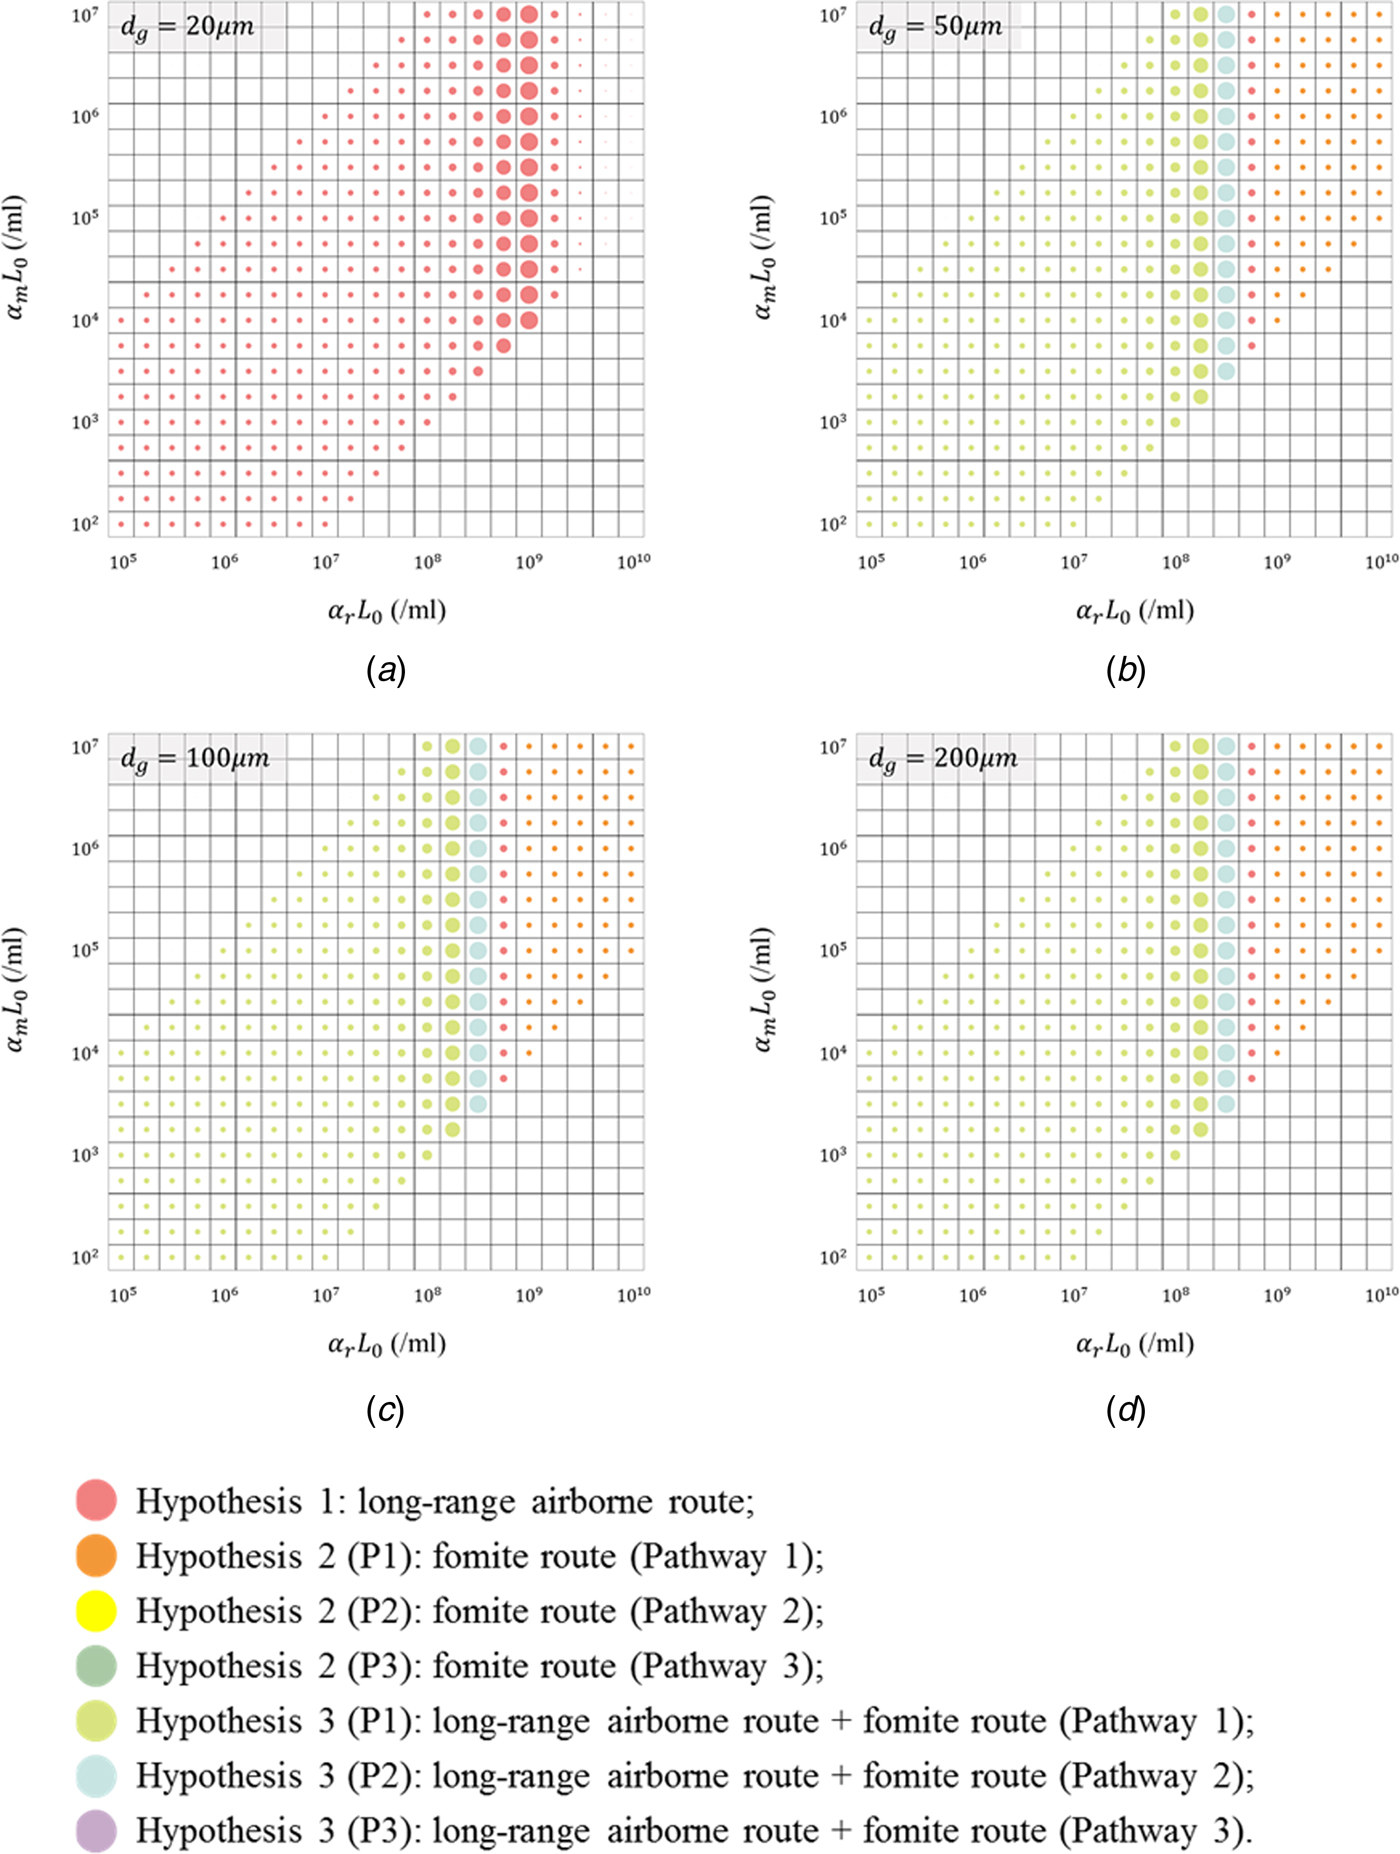
Fig. 4. Illustration of the hypotheses with the best fitness (minimum residual sum of squares; RSS) for the 1140 scenarios, with different values for the largest virus-containing droplet size d g (20, 50, 100 and 200 µm) and products of viral load and dose–response parameters in respiratory tracts α rL 0 (21 values, 105–1010/ml) and on mucous membranes α mL 0 (21 values, 102–107/ml). (a) d g = 20 µm; (b) d g = 50 µm; (c) d g = 100 µm; (d) d g = 200 µm. Different hypotheses are marked with different-coloured dots. The dot diameter is inversely proportional to the value of the RSS.
In scenarios with d g of 50, 100 and 200 µm (Fig. 4b–d), since d g was larger than the largest initial diameter for the airborne droplets (30 µm), the infection risk via the long-range airborne route was irrelevant to d g. Moreover, the exposure site for this route was in the respiratory tract, so the infection risk was not related to α m. For the fomite route, the infection risk was low for all scenarios and thus varied slightly with parameters (α rL 0, α mL 0, d g). Therefore, in Fig. 4b–d, the results varied considerably with α rL 0 but changed little with d g and α mL 0. When α rL 0 was small and moderate, the infection risk caused by any single-route mode was small, and then the probable transmission modes were Hypothesis 3 (Long air + Fomite) (cyan and blue dots). When α rL 0 were large, the probable transmission modes were single-route ones (red and orange dots), but the corresponding fitness was very poor.
Discussion
Although the actual values of parameters (α rL 0, α mL 0, d g) in the outbreak were unknown, some more-likely values could be identified based on the literatures. Despite not always detectable [Reference Tang25], influenza viruses have been found in human saliva [Reference Endo26] where large droplets originate [Reference Johnson27], so the largest virus-containing droplet size d g is more likely to be 50, 100 and 200 µm. The viral shedding varied with people [Reference Yan28], and Nicas and Jones estimated the virus concentration ranged from 104 to 108 TCID50/ml [Reference Nicas and Jones19] based on the measurements of Murphy et al. [Reference Murphy29]. According to Spicknall et al. [Reference Spicknall30], we estimated the dose–response parameter of influenza in the respiratory tract α r as 1.03/TCID50 and that on mucous membranes α m as 1.4 × 10⁻³/TCID50. Thus, the product α rL 0 was more likely to range from 1.03 × 10⁴ to 1.03 × 10⁸/ml, and α mL 0 was more likely to range from 1.4 × 101 to 1.4 × 10⁵/ml. From Fig. 4b–d, with these more-likely parameter values, the probable transmission mode was Hypothesis 3 (Long air + Fomite (P1)), but the fitness with the reported attack rates (RSS = 0.929) was not good. If the index patient shed a higher viral load than average and the product α rL 0 increased to 108.50/ml, the probable transmission mode was Hypothesis 3 (Long air + Fomite (P2)) and the fitness (RSS = 0.520) was almost as good as the overall best fitness (RSS = 0.505) in Table 1.
As the above analyses suggest, whether the index patient shed an average viral load comparable to those reported in literatures or the index patient was a super-spreader, the influenza virus was most probably spread via a combined long-range airborne and fomite transmission mode in the considered outbreak. The potential of the two transmission routes has been supported by the detection of influenza virus ribonucleic acid (RNA) in the air [Reference Blachere31, Reference Yang, Elankumaran and Marr32] and on surfaces [Reference Boone and Gerba33, Reference Simmerman34] in indoor environments. Additional data have demonstrated that the influenza virus can survive for several hours in the air [Reference Loosli35, Reference Schaffer, Soergel and Straube36] and on fomites [Reference Bean37, Reference Noyce, Michels and Keevil38].
As the results show, it is most likely that in this outbreak, the long-range airborne route made a predominant contribution to the influenza infections [Reference Wong13], which the original study authors also suggested. Moreover, the current modelling study suggests the fomite transmission route played a slight role. The relative importance of these two routes suggested by our results could explain the following findings: ultraviolet radiation [Reference McClean39] and ventilation [Reference Moser40, Reference Drinka41] significantly affected the attack rates in some influenza outbreaks, whilst little or no direct evidence has been found to show that fomites can mediate transmission [Reference Killingley and Nguyen-Van-Tam8] despite the emphasis on hand-washing and surface cleaning. In addition, several control measures aimed at reducing the aerosol transmission achieved a good effect in the hospital after the outbreak [Reference Wong13], which also supported the significant role of the long-range airborne route. As the original outbreak investigation [Reference Wong13] reported, a series of measures were applied, such as isolating patients with suspected influenza, usage restriction of aerosol-generating procedures, regular checking on air-conditioning units and settings and the use of N-95 respirators. As a result, the hospital did not encounter another influenza outbreak in open wards during the subsequent year, including the first wave of the influenza H1N1 pandemic in 2009.
Other modelling investigations [Reference Nicas and Jones19, Reference Spicknall30, Reference Atkinson and Wein42, Reference Lei43] have been performed to quantify the relative importance of different routes in influenza transmission. Similar to this study, Atkinson and Wein [Reference Atkinson and Wein42] and Lei et al. [Reference Lei43] concluded that the airborne route is far more dominant than the fomite route. Nicas and Jones [Reference Nicas and Jones19] and Spicknall et al. [Reference Spicknall30] predicted a substantial contribution of the fomite route to the infection. In their assumptions, the virus source of the fomite route included the large droplets and the virus concentrations in large droplets were the same with small ones. In contrast, on the basis of the absence of any detectable influenza RNA in naturally infected human volunteer exposure experiments, Tang et al. [Reference Tang25] speculated that large droplets produced during human exhalations (breathing and coughing) may not carry a significant amount of virus because they may consist of less viscous, less virus-rich salivary fractions, whereas most of the virus may remain trapped in the mouth within more viscous salivary mucins that contain antiviral substances. Therefore, for various reasons, the contribution of the fomite route may have been overestimated in these two studies [Reference Nicas and Jones19, Reference Spicknall30].
The general ward in which this outbreak occurred is similar to that in which the largest severe acute respiratory syndrome (SARS) nosocomial outbreak in Hong Kong [Reference Xiao14] occurred. The cubicles in these wards were all designed to maintain positive pressure relative to the corridor, but the virus-containing airborne droplets could still spread from the source cubicle to other cubicles because of the two-way airflow effect [Reference Chen23]. In the nosocomial outbreaks of SARS [Reference Xiao14] and influenza [Reference Wong13] on the general medical ward, there was very likely a significant contribution by the application of a jet nebuliser and NPPV on the index patients respectively in addition to an imbalanced ward airflow. In experimental studies using smoke particles as exhaled air marker, application of a jet nebuliser or NPPV on a human patient simulator via a single circuit and various face masks has been shown to produce significant leakage and room contamination even in an isolation room with negative pressure [Reference Hui44–Reference Hui46]. Therefore, the long-range airborne route played a predominant role in the virus transmission in these two outbreaks [Reference Wong13, Reference Xiao14]. Chen et al. [Reference Chen23] suggested that reducing the area of the openings between the cubicles and the corridor would help to reduce the potential for long-range airborne transmission. Unlike in this influenza outbreak, the fomite route made a considerable contribution to the infection in the SARS outbreak. The difference could be attributed to virus inactivation rates on surfaces, particularly hands. The inactivation rate of the SARS virus on hands was estimated to be 0.80/h on the basis of the measurement of the 229E coronavirus [Reference Wolff, Schmidt, Wolff and Weber47] and that of influenza viruses was estimated to be 55/h [Reference Spicknall30, Reference Bean37], which implies that approximately 1.3% of the SARS viruses and 60% of the influenza viruses are inactivated every minute. Thus, most of the influenza viruses transmitted to the hands of the HCWs during contact with the index patient might be inactivated before the HCWs can transmit them to subsequent inpatients and before the subsequent inpatients can then touch their own mucous membranes. Hence, the fomite route appears to be of less importance for the transmission of the influenza virus [Reference Weber and Stilianakis10].
This study has the following three limitations. First, because the knowledge of some aspects of the influenza virus is still limited, some parameters of the model are uncertain, such as the transfer rates between hands and surfaces (Supplementary Table S3). In this study, we discussed only the range of possible values of some important parameters (α rL 0, α mL 0, d g) and used published estimates for other parameters, sometimes based on other non-influenza viruses, bacteriophages or even bacteria, which could lead to less accurate results.
Second, because of a lack of detailed and contemporaneous information during the outbreak, most of the patient and staff behaviours during the outbreak were assumed, retrospectively. Nevertheless, human behaviours are to some extent crucial for constructing multi-agent models, since they can affect the infection risk generated for each of the two transmission routes. For example, the duration and frequency of the index patient walking in the corridor would influence the virus source strengths of the two routes. Moreover, the individual variation in the behavioural modes of people performing the same roles were not considered in this study; for example, nurses were assumed to visit all normal inpatients at the same frequency, which is unlikely in reality because the most sick patients will usually receive the maximum attention, thereby relatively influencing virus transmission via the fomite route.
Third, the patient-to-patient close contact transmission was not considered in this study. The close contact route, in particular the large droplet route, has long been perceived to be the most important in the influenza transmission [5, 11, Reference Baker48–Reference Voirin50]. However, in this outbreak, since the index patient and most other inpatients were immobile during their illnesses [Reference Wong13], the possibility of direct contact between the index patient and other inpatients was nearly impossible. In addition, the distance between the patient in the adjacent bed and the index patient was about 2 m [Reference Wong13], and the index patient was less likely to cough or sneeze in the direction of the adjacent beds since he initially required supplemental oxygen via nasal cannula and then underwent BiPAP (bi-level positive airway pressure) ventilation support. Thus, the close contact transmission might have made little contribution to the overall infection patterns so it was ignored in this study.
Overall, more laboratory measurements and human behaviour observations in hospitals are needed for a better understanding of influenza transmission.
Conclusions
In this outbreak, the influenza virus might have spread via a transmission mode involving the long-range airborne route. This virus was probably transmitted via the combined two-route mode and HCWs might have conducted the routine rounds in Pathways 1 or 2. In the two-route mode, the long-range airborne route played a predominant role and the fomite route played a very small role. Our findings on the influenza transmission modes and the possible roles of the two routes contribute to the development of evidence-based infection control advice for healthcare settings.
Supplementary material
The supplementary material for this article can be found at https://doi.org/10.1017/S0950268818001012.
Acknowledgements
This work was supported by an HKSAR Government Collaborative Research Fund project (grant number C7025-16G) and a General Research Fund project (grant number 17211615).
Declaration of interest
None.
Ethical standards
No ethics approval was required for this study as this is a reanalysis of a past outbreak.


