


Introduction
The transport of snow by wind is an important process in Scotland, particularly in upland areas where, due to the maritime nature of the climate, mean wind speeds are high. Reference BartonBarton (1987), for example, reported annual mean wind speeds of 13 m s−1 at Cairn Gorm summit (1245 m), which are within the range likely to cause snowdrifting.These high mean wind speeds result in accumulation patterns whereby wind-slab avalanches are the predominant cause of avalanche accidents in Scotland (personal communication from D. S. B. Wright, 1997). Unstable wind-slab deposits are a common occurrence on sheltered lee slopes, which are often the approach slopes to popular winter climbing venues. Many avalanche accidents in Scotland involve relatively small avalanches dislodging climbers, who are then injured in the subsequent fall, rather than as a direct result of the avalanche itself.
Since wind is important, avalanche forecasters require a knowledge of threshold wind velocities and the conditions under which snow is transported and deposited. Furthermore, they must understand the regimes under which drifting snow is sublimated away during transport and how this affects the avalanche hazard. Road closures are a frequent occurrence in the Highlands of Scotland during the winter months and are generally associated with the redistribution of snow by wind, rather than overall quantities of precipitated snow. This phenomenon means that road-clearing operations must be almost continuous during periods of high wind, even after snowfall has ceased, in order to maintain communication links. Ski areas in Scotland are also extensively affected by drifting snow, with snow fencing being an essential mechanism for maintaining snow on pistes. Extensive scouring of runs down to icy layers in high winds is not uncommon and this presents significant management difficulties. Thus, it is clear that a model of snow transport and accumulation for mountain topography in Scotland would be a useful tool, with practical applications.
This paper describes one possible approach to the problem, exploring the use of a rule-based model. The model incorporates simple rules for the wind field over irregular topography and for the availability of snow for drift at individual locations. Thus, the flux of snow is modelled over the topography, allowing a map of the resulting pattern of snow accumulation to be built up.
Data for use in the model were collected on Aonach Mor (1221 m) in the Western Highlands of Scotland. Figure 1 shows the study area to which all other figures showing distribution patterns should be related. Aonach Mor is the site of the Nevis Range ski area, thus allowing access for field measurements. It is also the area in which the Scottish Avalanche Information Service (SAIS) makes daily measurements of snowpack and meteorological data, for avalanche forecasts in the Lochaber area throughout the winter, Finally, a U.K. Meteorological Office Severe Icing Environment Automatic Weather Station (SIESAWS) is situated near the summit of the mountain. Therefore, a range of data sources is available in addition to that directly collected by the authors. The area on which the model is run is approximately 15 km2 and ranges in height from 600 to 1200 m. The mountain is isolated from those to the east and west by deep valleys, allowing a natural boundary condition for snow transport to be imposed.

Fig. 1. The study site.
This paper describes the methodology adopted in developing the rule-based model of snow transport, paying particular attention to the rules utilized in describing the wind field and resulting flux of snow through the model. Results of model runs under differing conditions are illustrated with reference to observed patterns of snow accumulation at the study site. Finally, plans for further development of the model are presented.
The Development of the Model
Qualitative Nature of the Model
The model was constructed with the aim of producing maps of snow distribution, assuming a particular topography, information about features associated with that topography and a particular set of meteorological conditions. Since the rules are recognized as being empirical and in some cases qualitative, it would be inappropriate to derive any quantitative data from the model. Rather, it should be viewed as producing qualitative maps showing relative measures and distribution patterns. Thus, the model deals with data in terms of purely arbitrary units and inputs to the model (e.g. wind speed) are given in arbitrary units. The digital elevation model (DEM) is the exception in that it is based on height data at 50 m intervals in a rectangular grid format.
Modelling the Wind Over Complex Topography
Although a numerical model of the wind field over complex topography is in principle possible, solutions are often numerically intensive and require careful selection of boundary conditions. Furthermore, experimental measurement of the wind field over a Complex topography is time-consuming and difficult, requiring a large number of sensors or the use of wind-tunnel experiments (Reference Jenkins, Mason, Moores and SykesJenkins and others, 1981; Reference Naaim-BouvetNaaim-Bouvet, 1995). A much simplified model of the wind field is described below, based on a number of heuristics.
In the first instance, it was assumed that the wind incident on the model boundary had a velocity. This wind velocity was mapped to all the cells in the model before the heuristics were applied to modify the wind velocity. Thus a map of wind vectors was generated using a geographical information system (GIS), which is ideally suited to such global functions.
Initially, a simple shelter-index strategy was devised to illustrate the ideas of windward and leeward slopes. Cells were examined for their aspect and inclination, and a remapping function applied to them according to these values. If a cell lay in a swathe of aspects within 45° of the mean aspect of a leeward slope and its inclination was greater than 5°, then it was given an index, 0 < cell index ≤ 1, according to the remapping function; the highest values lay directly in the lee, with the index decreasing towards zero when the slope’s aspect was 45° from the mean Iee-slope aspect.
Figure 2 visualizes this as such a remapping function for the case of a westerly wind. In Figure 3, the resulting effect on the wind speed of such a remapping function is illustrated, where a westerly wind of eight units has been applied to the topography. This measure is similar to the Topex measure described by Reference Bell and QuineBell and Quine (1996) in calculating wind-throw damage to trees. The Topex measure takes account of a cell’s generalized position relative to the topography, for example, the cell’s position relative to the horizon as well as its particular attributes. In effect, the model produces a simple cost surface which represents a map of shelter zones. It is known that topography produces a wind-turning effect and the next stage was to attempt to model such processes. Reference RyanRyan (1977) developed a simple equation for wind deflection in strong gradient winds blowing across a slope (Fig. 4), where the inclination was less than 45°. The expression is for a wind deflection
where F d is the wind diversion (deg), s d is the inclination (%), A is the slope aspect (deg) and θ is the wind direction (deg).

Fig. 2. Reduction of wind speed by aspect and inclination.

Fig. 3. Wind-speed reduction and deflected wind direction vectors for an eight unit westerly wind.

Fig. 4. Wind deflection according to wind direction (θ), aspect (A),and slope (sd) (not to scale).
This equation allows the wind direction in individual cells to be modified according to the aspect and inclination of a cell relative to the wind direction. Since Equation (1) affects wind direction, which is a variable used in the calculation of the shelter index, then the deflected vectors are calculated prior to the shelter index.
The vectors in Figure 3 show wind direction, overlaid on to the remapped wind-speed magnitudes, as modified in individual cells by Ryan’s model. When Figure 1 is compared with Figure 3, it is possible to observe the effects that the topography is having on wind direction, in particular the flow diversion along the western side of Aonach Mor. Here, the westerly wind is being deflected along the steep west face of the mountain, with the wind vectors being northwesterly in this area.
The heuristics described above provided an initial framework for describing a wind field over the mountain, under typical winter conditions. However, they do not provide a complete description of the wind field since features such as flow separation, downslope acceleration or continuity of flux are not modelled.
Modelling the Effects of the Wind Field on the Snow-Pack
Driftability of Snow and Threshold Wind Speeds for Drifting
Before any snow is removed from a cell, the model first examines the cell to ensure that snow is available for drift. Clearly, if no snow is present in the cell, then snow cannot drift from that cell, unless material arrives from an upwind cell. The driftability of snow refers to the ease with which it can be removed from the snowpack by winds. This is described by the threshold velocity for that particular snow-pack, which Reference SchmidtSchmidt (1980) showed to be dependent on a number of factors, in particular:
Temperature and humidity at which deposition occurred.
Contact force with which snow was deposited (was snow deposited by high winds?).
Time since deposition: rates of sintering show large variations with particle size and temperature.
Source of particles to initiate saltation, such as precipitating snow or surface hoar.
These, and other factors, combine to generate a complex physical picture of the availability of snow for drift and the consequent threshold wind speeds for drifting. However, it is clear that some simple heuristics can be developed to take some of these factors into account and perhaps provide an index of driftability. For example, if a melt-freeze cycle occurs, with no new snow falling during the freeze part of the cycle, then it is reasonable to assume that the threshold velocity for drifting will be so high as to prevent any erosion effectively. Equally, during melt periods, no drifting will occur other than from any precipitating snow. The model takes account of the altitude of a cell with respect to the current freezing level in deciding whether drift is allowed from a particular cell. A look-up table determines whether a melt-freeze cycle has occurred or is in progress and, if so, whether it is an impediment to drifting. For example, in cases where a melt-freeze cycle has occurred since the last fall of new snow then the snow is said to be undriftable. Thus, snow is considered either to be available or not for drifting with a single threshold value being applied for snow which is considered driftable.
Currently, the model does not take further account of the state of metamorphism of the snowpack. However, the development of more detailed heuristics, taking into account other influences on the driftability of a snowpack, is one way to refine the model. Such an approach has been adopted by the PROTÉON (forecast of the occurrence of the wind transport of snow) wind model developed in the French Alps (Reference Guyomarc’h, Mérindol. and Sivardière.Guyomarc’h and Mérindol, 1995).
Flux of Snow
The flux of drifted snow is a function of the wind speed acting upon the snowpack, wherever it is greater than the threshold velocity. Although numerous different empirical expressions have been arrived at by different researchers, it is generally considered to be proportional to the cube power of wind speed (Reference BergBerg, 1986; Reference Pomeroy, Gray and LandinePomeroy and others, 1993).
A simple equation of this form was used to calculate the amount of material eroded from a cell by the wind vector within that cell.
where Q is the amount of snow eroded from a cell, k is a constant, u is the wind velocity and u t is the threshold wind velocity. The details of the procedure are as follows. The wind vector at the grid’s origin was examined and the order in which the rows and columns are traversed is determined accordingly. The movement of material is then modelled by re-allocation from cell-to-cell, relative to the x and y components of the wind vector acting upon it, with the snow-depth index (h) in cell (x, t + Δt) after iteration being found explicitly by the following equation
where Δt and Δx are the temporal and spatial steps, respectively, which are assumed to be unit steps. This formulation means that snow erosion and accumulation are assumed to be instantaneous.
When snow is in turbulent suspension, as a result of relatively high winds, then much of it may be sublimated away before it returns to the ground. This is apparent in the Scottish context, since high winds will scour windward and lee slopes down to an icy layer, leaving limited deposits of windblown snow, on occasion virtually stripping an area of its snow cover. Reference PomeroyPomeroy’s (1991) experiments in the Cairngorm mountains demonstrated that losses due to sublimation and vertical transport out of the surface boundary layer could be significant.
At this stage in the research, a term for these effects is not included in the model.
Boundary Conditions
Consideration must be given in any spatial model to the conditions at the boundaries, both in time and space. The model was initialized assuming an equal distribution of snow over the whole topography. At the boundaries, the flux was set to be constant, that is to say, that the rate of erosion at the boundary cells equalled the rate of accumulation.
This condition meant that material was available to drift in the model as long as conditions for drift were met at the boundaries.
Implementation
The model was implemented using a combination of the GRID module of the ARC/INFO GIS package and code written in Visual Basic (Environmental Systems Research Institute, 1993). Figure 5 shows how the two modules were linked and demonstrates the iterative path the model followed.

Fig. 5. Iterative path of the model.
*In principal shelter index should be recalculated as topography changes with snow depth; however, this is not possible with a snow-depth index.
Results and Comparison with Expected Patterns
In this section, a range of results from the model are illustrated and compared with what might be expected to happen in the field under such conditions. The expected results in the field were arrived at mainly through discussion with SAIS observers and employees of Nevis Range, along with photographic evidence recorded over the previous 5 years. More detailed measurements were planned during the winter of 1996–97 but these proved impossible due to the very limited snowfall during that winter. The limitations imposed on the validation of the model are discussed in detail later.
Two wind directions were chosen to illustrate the model output: westerly winds since these, together with southwesterlies, are the prevailing winds at Aonach Mor; southerly winds provide an example where the wind field is known to be modified significantly by the topography.
Results are shown after four iterations since at this point the model reaches a state where relative differences between areas are clearly visible and significant erosion has not started to affect leeward slopes.
Case 1: Westerly Wind, No Wind Deflection
Figure 6 is an illustration of the model output. The wind speed remapping mask shown in Figure 3 was applied to a westerly wind of eight units, with the threshold for drift being five units. Figure 6 illustrates the effects of these conditions after four iterations. The plateau edge, marked by the lighter cells to the right of the figure, has the greatest accumulations of snow with cast-facing corries generally showing greater accumulations. The windward cells in the accumulation zone lack snow as a result of erosion and the snow is trapped in the cells immediately to the leeward. In all other areas, no modification of the snow depth occurs and there is a constant flux into and out of the cells. However, if the model is left to iterate, the erosion zones slowly spread across the windward slopes until a quasi-steady state is reached.
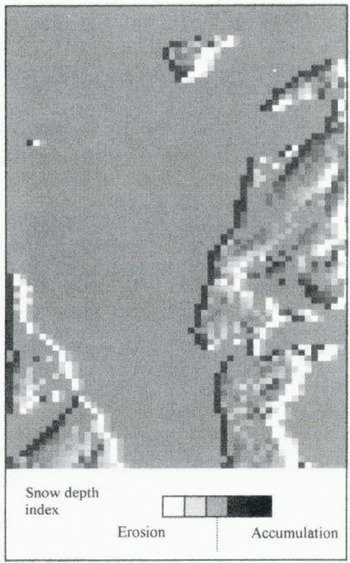
Fig. 6. Snow-depth index with an eight unit westerly wind and shelter remapping after four iterations.
Case 2: Westerly Wind with Wind Deflection
This example (Fig. 7) demonstrates the additional effects of adding wind deflection to the conditions described in case 1. Once again, the wind is eight units from the west. The same general pattern of accumulation can be seen on sheltered slopes but a much more subtle pattern of shading is picked out on other areas of the topography. This pattern mimics the relief of the topography with features such as Goose Gully (feature A) clearly identifiable as areas of increased accumulation.

Fig. 7. Snow-depth index with an eight unit westerly wind shelter remapping and wind deflection after four iterations.
The striated effect on the western side of the mountain (feature B) shows the effects of the various deeply incised gullies on this face.
Case 3: Southerly Wind with Wind Deflection
The final example (Fig. 8) illustrates a southerly wind of eight units with wind-deflection effects. The orientation of the mountain is such that many of the cells are now sheltered and a much more complex pattern of snow deposition now emerges. Of particular note is that Goose Gully appears to experience erosion of snow. In areas where the wind direction but not speed is being modified, mainly on the western slopes of the mountain, the subtle shading pattern resulting from wind deflection is again identifiable.

Fig. 8. Snow-depth index with an eight unit southerly wind shelter remapping and wind deflection after four iterations.
Discussion of Results
During the winter of 1996–97, a comprehensive measurement program was planned to validate the model, in particular measuring snow depth at a range of sites to compare with the modelled snow-depth index. However, very limited snowfalls and fluctuating temperatures meant snowdrift rarely occurred and little data were collected. Therefore, the validation of the model is in the first instance based on the experience of local experts and only refers to larger scale features such as gullies, rather than individual cells.
The results clearly show areas of accumulation in sheltered zones, as one might expect. The most notable feature in case 1 (Fig. 6) is feature C. This is the new beginner’s ski area at Nevis Range and was chosen as a good snow-holding site under the prevailing conditions (west and southwesterly winds). It is a relatively gentle depression, which holds snow better than the surrounding areas due to its increased shelter from the prevailing winds. Also well defined are the break in slope from the plateau to the eastern corries of Aonach Mor, which are clearly shown to collect large quantities of snow.
In case 2, Goose Gully (feature A), the most prominent natural snow-holding feature on the north face of the mountain, holds snow preferentially compared to the surrounding slopes, as a result of the effects of wind deflection in the model. Likewise, the gullies on the western side of Aonach Mor are shown to colled snow, even under westerly winds. The wind-deflection heuristic allows gullies to collect snow preferentially by angling the wind vectors in towards the gully and thus causing a net gain of material. The deposition of snow in such gullies, even on windward slopes, agrees with observations by SAIS observers.
When southerly winds are applied, a much more complicated situation arises, which is more difficult to compare with reality. In general, southerly winds often scour the mountain and diverge with the strongest winds being found on the western and eastern slopes of Aonach Mor and lighter winds on the north-facing slope. This phenomenon is not represented by the model, since the model does not take account of the generalized pattern of flow resulting from specific conditions around the mountain, rather looking at cells on an individual basis. The complex pattern of deposition on the north-facing slopes is more difficult to assess without more-detailed field measurements although on occasion south winds do scour Goose Gully.
Conclusions and Further Work
This paper has described the initial stages in developing a rule-based model for snow transport over a topography. A number of simple heuristics were formulated and have been shown to produce patterns of snow accumulation which show good agreement with those expected by experts in the field. In particular, the use of the combined shelter-index and wind-deflection heuristics was successful in that it demonstrated accumulation both on leeward slopes and in locally sheltered topographic features such as gullies.
The model has been less successful in showing the expected scouring patterns under a southerly wind, since the wind heuristics operated on a cell-by-cell basis, rather than examining the shape of the whole topography relative to the wind. Thus, patterns such as flow separation are not modelled.
Future work on the model will focus on developing a more complete set of heuristics, taking account of such generalized flow features and in trying to correlate the measured wind field at a number of points with the modelled wind field. Rules, altering the driftability of the snowpack as metamorphism occurs, will also be developed. The modular nature of the model makes the inclusion of such rules a relatively simple process.
Further data will be collected in the field, in order to quantify various elements of the model, such as the mass-transport equations. A programme of detailed correlation with snow accumulation in the field is also planned.
Acknowledgements
The assistance of Nevis Range Development Company, G. Moss, M. Hughes and B. Wright of the SAIS is gratefully acknowledged. This research was funded by U.K. NERC grant GR9/053. The useful comments and advice of the referees and editor are also gratefully acknowledged.


