1. Introduction
The purpose of this paper is to develop a metric of morphological relatedness that reflects the perceptions of relatively naïve speakers, as determined by a behavioural study. Morphological structure has long been known to have an influence on both lexical processing and production (e.g., Forster and Chambers Reference Forster and Chambers1973, Murrell and Morton Reference Murrell and Morton1974, Taft and Forster Reference Taft and Forster1975, Burani and Caramazza Reference Burani and Caramazza1987, Napps and Fowler Reference Napps and Fowler1987, Napps Reference Napps1989, Marslen-Wilson et al. Reference Marslen-Wilson, Komisarjevsky Tyler, Waksler and Older1994, Baayen et al. Reference Baayen, Dijkstra and Schreuder1997, Radeau et al. Reference Radeau, Besson, Fonteneau and Luis Castro1998, Meunier and Segui Reference Meunier and Segui1999, Feldman Reference Feldman2000, Frost et al. Reference Frost, Deutsch, Gilboa, Tannenbaum and Marslen-Wilson2000, Hay Reference Hay2003, Moscoso del Prado Martín Reference Moscoso del Prado Martín2003, Morris et al. Reference Morris, Frank, Grainger and Holcomb2007, Longtin et al. Reference Longtin, Segui and Hallé2003, Pluymaekers et al. Reference Pluymaekers, Ernestus and Harald Baayen2005, Stockall and Marantz Reference Stockall and Marantz2006, Gonnerman et al. Reference Gonnerman, Seidenberg and Andersen2007, Baayen et al. Reference Baayen, Levelt, Schreuder and Ernestus2008, Pastizzo and Feldman Reference Pastizzo and Beth Feldman2009, Tabak et al. Reference Tabak, Schreuder and Harald Baayen2010, Bien et al. Reference Bien, Baayen, Levelt, Bertram, Hyönä and Laine2011, Smolka et al. Reference Smolka, Preller and Eulitz2014, Xu and Taft Reference Xu and Taft2015, inter alia). For example, morphologically related words have been shown to prime each other in ways that are different from sound-based and meaning-based priming (e.g., Murrell and Morton Reference Murrell and Morton1974, Napps and Fowler Reference Napps and Fowler1987, Napps Reference Napps1989, Marslen-Wilson et al. Reference Marslen-Wilson, Komisarjevsky Tyler, Waksler and Older1994, Feldman Reference Feldman2000, Frost et al. Reference Frost, Deutsch, Gilboa, Tannenbaum and Marslen-Wilson2000, Smolka et al. Reference Smolka, Preller and Eulitz2014; see especially the review in Feldman Reference Feldman2000), and the frequency of occurrence of morphological roots within derived words affects the speed of processing (e.g., Taft and Forster Reference Taft and Forster1975, Burani et al. Reference Burani and Caramazza1987, Meunier and Segui Reference Meunier and Segui1999, Xu and Taft Reference Xu and Taft2015). At the same time, less work has been done on how one can determine whether any two words are perceived by native speakers to be morphologically related; instead, such studies rely on a priori notions of morphological relatedness. Yet this perceived relation has consequences for a number of areas of linguistic analysis.
In phonology, for example, one of the primary phenomena to be explained is the existence of alternations: why does one sound occur in some environments, but a phonetically different sound regularly occur in other environments? In order for this to be a sensible question, however, one must be able to recognize the recurrence of morphemes from one context to another, specifically when they are not identical in form across contexts. Without recognition that a morpheme is the “same” in two or more contexts, there is no sense in which sounds alternate with each other. For example, the [k] at the beginning of couch does not alternate with the [s] at the beginning of sofa, even if they occur in word-initial positions of two words that mean roughly the same thing; similarly, the [k] and [s] in cat and sat do not alternate with each other despite their shared phonological environment. The [k] and [s] in electri[k] vs. electri[s]ity, however, do show an alternation, but only if we assume that it is the same morpheme, electric-, that occurs in both words.
Linguists tend to use meta-linguistic knowledge to organize data into morphologically related datasets (e.g., base forms and their plurals, negatives, diminutives, etc.). The assumption is that naïve language users can and do make similar classifications, but it is not clear how accurate this assumption is. For example, Johnson and Babel (Reference Johnson and Babel2010) directly compare the phonological status of [s] and [ʃ] in Dutch and English. In Dutch, the two sounds are often thought to be allophonic (e.g., Booij Reference Booij1995, Gussenhoven Reference Gussenhoven1999), given alternations between singular forms and their diminutives such as tas [tɑs] ‘bag’ ~ tasje [tɑʃə] ‘handbag,’ ijs [εis] ‘ice’ ~ ijsje [εiʃə] ‘ice cream,’ and glas [xlɑs] ‘glass’ ~ glasje [xlaʃə] ‘small glass, lens.’ In English, however, the sounds are typically assumed to be contrastive, given (near) minimal pairs such as sue vs. shoe, seesaw vs. seashore, or mass vs. mash. As Johnson and Babel (Reference Johnson and Babel2010) point out, however, [s] and [ʃ] do undergo morphophonological alternation in English, as in opress ~ oppression, press ~ pressure, or face ~ facial, but they dismiss the relevance of this, saying that “alternations of this type are infrequent in English and the phonemic contrast between /s/ and /ʃ/ is a very salient aspect of the English phonological system” (Johnson and Babel Reference Johnson and Babel2010: 129; emphasis added). Interestingly, parallel to the existence of alternations in addition to contrasts in English, there is in fact some evidence of surface contrast between [s] and [ʃ] in Dutch, in addition to their regular alternations: there are words like tassen [tɑsə(n)] ‘bags’ that have [s] before [ə] and therefore form a surface minimal pair with words like tasje [tɑʃə] ‘handbag.’Footnote 1 Thus the Dutch and English cases are different in terms of the degree of the contrast, rather than its quality: Johnson and Babel seem to be arguing that the ratio of minimal pairs to alternations is much higher in English than in Dutch, and then go on to show that this difference has consequences for the perception of these fricatives in the two languages.
In order to evaluate this claim, however, there needs to be a way of quantifying the frequency with which two sounds alternate. One way of determining the frequency of the alternation would be to calculate the number of words that contain morphemes that have both [s]- and [ʃ]-ful allomorphs and compare that to the number of words that contain morphemes that have allomorphs that consistently contain only one of [s] or [ʃ]. To do this, however, one must have a good sense of what should “count” as containing an allomorph of a given morpheme. For example, does the root morpheme face occur in the word face? in face-lift? facial? type-face? facet? façade? superficial? Etymologically speaking, the answer to each of these is yes, but it is much less clear that naïve English speakers recognize this connection in all of these (and other) cases. (Note that the same problem arises in Dutch: the diminutive suffix in Dutch is generally considered to be derivational, not inflectional (Bauer Reference Bauer1997, ten Hacken Reference ten Hacken2013), as the somewhat semantically opaque nature of meisje ‘girl’ – for which there is no base form – suggests.)
Thus, even though the perceived morphological relations between words are not always clear, the implicit assumption that morphological structure reveals phonological patterns is present in countless examples of phonological analysis. Some phonologists (e.g., Silverman Reference Silverman2006: 88, see also Lu Reference Lu2012) have even made the claim that alternations are the only way to identify allophonic phonological patterns, discounting other common criteria such as complementarity of distribution (Silverman Reference Silverman2006: 101–106) and phonetic similarity (Silverman Reference Silverman2006: 95–100).
Thus, there is a need for an objective metric of perceived morphological relatedness that can be applied to word pairs to determine whether they are likely to be thought of as being morphologically related and therefore a candidate for alternation. The purpose of this paper is to establish a methodology for doing exactly that and apply it to a particular language; in this case, English. In section 2, prior work on measuring morphological relatedness is discussed, and rationale for the current task is given. Sections 3 and 4 present the design and results of the behavioural study. In section 5, the analysis of these results is turned into a predictive metric of perceived morphological relatedness and the results are tested with novel words. Section 6 presents conclusions.
2. Measuring morphological relatedness
As mentioned in the introduction, the role of morphology has been extensively examined in the psycholinguistic literature. As a number of authors (e.g., Gonnerman et al. Reference Gonnerman, Seidenberg and Andersen2007, Smolka et al. Reference Smolka, Preller and Eulitz2014) have pointed out, much of the work in this area has been focused on whether complex words are stored and processed as decomposed parts or as non-decomposed wholes, with another sub-branch of research on how to analyse words whose morphological structure is not entirely clear (e.g., grocer, remit, cranberry; see, for example, Aronoff Reference Aronoff1976).
Of most direct relevance to the current question are studies that have investigated the existence of morphological relatedness, often through its indirect effect on priming in tasks such as lexical decision (e.g., Marslen-Wilson et al. Reference Marslen-Wilson, Komisarjevsky Tyler, Waksler and Older1994, Radeau et al. Reference Radeau, Besson, Fonteneau and Luis Castro1998, Feldman Reference Feldman2000, Frost et al. Reference Frost, Deutsch, Gilboa, Tannenbaum and Marslen-Wilson2000, Longtin et al. Reference Longtin, Segui and Hallé2003, Stockall and Marantz Reference Stockall and Marantz2006, Gonnerman et al. Reference Gonnerman, Seidenberg and Andersen2007, Pastizzo and Feldman Reference Pastizzo and Beth Feldman2009, Smolka et al. Reference Smolka, Preller and Eulitz2014, etc.). Morphologically related words have been shown to induce facilitatory effects that go beyond phonological and semantic similarity, though there is variability in the results such that the extent to which morphology is separate from the combined effects of other forms of similarity is still in doubt (see especially the discussion in Longtin et al. Reference Longtin, Segui and Hallé2003, Stockall and Marantz Reference Stockall and Marantz2006, Pastizzo and Feldman Reference Pastizzo and Beth Feldman2009, and Smolka et al. Reference Smolka, Preller and Eulitz2014). Generally speaking, though, such studies involve carefully controlled stimuli in which words are quite clearly either morphologically related or unrelated. Feldman (Reference Feldman2000), for example, seems to use “morphologically related” to mean “inflectionally related”, and even studies that examine derivational relations generally have very strict criteria for determining that two words can be considered to be morphologically related. Marslen-Wilson et al. (Reference Marslen-Wilson, Komisarjevsky Tyler, Waksler and Older1994) used the criteria shown in (1); they considered pairs of words to be either morphologically related or not, without any intermediate categories.
(1) Criteria for morphologically related stimuli in Marslen-Wilson et al. (1994: 7)
a. The derived form has a “recognizable” affix (determined by listing in one of two standard references);
b. The stem without its affix has the same form (at least underlyingly) as the stem that occurs as a free word;
c. The pair of words have a common etymological source.
These criteria quite clearly delimit sets of words that can be considered to be morphologically related, and are entirely reasonable for the kind of question under study in that paper, that is, whether morphological relatedness affects priming. It is not so clear, however, that native speakers would have the same judgements; for example, the criteria count all of friend ~ friendly, elude ~ elusive, and grade ~ gradual as being morphologically related. This may in fact be entirely accurate, but the key points are (a) that the morphological status is pre-determined in these studies, (b) that such determinations are binary, and (c) that the results of such studies are interpreted as reflecting the morphological status, rather than themselves being used to examine perceived morphological relatedness itself. Note in particular that Marslen-Wilson et al. explicitly excluded “pairs that had coincidentally homophonic stems” (7) that otherwise met their first two criteria, thus prioritizing historical relatedness over potential perceived relatedness, whether that perception is historically accurate or not. Longtin et al. (Reference Longtin, Segui and Hallé2003), however, found effects similar to the priming effects in Marslen-Wilson et al. (Reference Marslen-Wilson, Komisarjevsky Tyler, Waksler and Older1994), even with “pseudo-derived” words, i.e., words that look as though they could be morphologically related even if they are not etymologically related, such as artery-art. This finding suggests that perceived morphological relatedness may indeed be different from historical relatedness.
Several more recent studies directly address point (b), that is, whether relatedness is binary or gradient (e.g., Feldman et al. Reference Feldman, Soltano, Pastizzo and Francis2004, Gonnerman et al. Reference Gonnerman, Seidenberg and Andersen2007, Morris et al. Reference Morris, Frank, Grainger and Holcomb2007, Xu and Taft Reference Xu and Taft2015). Gonnerman et al. (Reference Gonnerman, Seidenberg and Andersen2007), for example, do a series of pre-tests for phonological and semantic relatedness, using a Likert scale to gather judgements of similarity of each type. They then divide their stimuli into low-, medium-, and high-similarity groups along each of these domains, and control for the other: for example, in their experiment 1, they hold phonological similarity constant while using gradient degrees of semantic similarity; in their experiment 2, the factors are reversed. They find that degrees of similarity do affect priming: for example, they find twice as much priming for highly semantically similar pairs as for pairs with a medium degree of semantic similarity, and again about twice as much for pairs that were different only in terms of a consonant change as compared to both a consonant and vowel change in the root morpheme, although it should be noted that this effect was found only for words that were already highly semantically similar. Furthermore, they argue that, given these gradient results, “effects of morphological structure on processing should be predictable from the degree of semantic and phonological overlap between words” rather than constituting an independent level of processing (Gonnerman et al. Reference Gonnerman, Seidenberg and Andersen2007: 338). They propose that this can best be captured by a distributed connectionist model, in which morphology emerges from phonological and semantic representations.
The behavioural study presented here builds on Gonnerman et al. (Reference Gonnerman, Seidenberg and Andersen2007) and is designed to test a wider range of semantic and phonological similarity. It also incorporates measures of orthographic similarity, as other prior studies have indicated that spelling can also play a role in the perceived structure of words (e.g., Carlisle Reference Carlisle1988, Feldman Reference Feldman2000; see also discussion and review in Baayen Reference Baayen, Lieber and Stekauer2014). Indeed, Carlisle (Reference Carlisle1988: 154) claims that “the morphemic structure of words […] may be more apparent from the orthography than the phonology”.
Additionally, the current study deviates from most studies in morphological processing in that it involves a meta-linguistic judgement rather than a measure of an implicit response: participants were directly asked to judge the similarity of pairs of words (see section 3 for details), rather than perform some unrelated task in which reaction time is used to measure the extent to which different pairs of words prime each other. This method was chosen partially to serve as a comparison to the well-documented effects of priming, and partially because priming effects have in fact not been found in certain conditions. For example, Marslen-Wilson et al. (Reference Marslen-Wilson, Komisarjevsky Tyler, Waksler and Older1994) found that morphologically related words did not prime unless they were also semantically related (as an example of a morphologically but not semantically related pair, consider casual ~ casualty: according to their criteria, these are morphologically related, but were not judged to be semantically related in a pre-test of native speakers). They also found that phonologically related words that are not morphologically or semantically related did not reliably prime. Feldman (Reference Feldman2000) found that orthographically related primes can either inhibit or facilitate targets in a lexical decision task, depending on the latency between the two. Thus, we were wary of using a priming task. By contrast, similarity rating has been used successfully in several studies to determine independent degrees of phonological and semantic similarity (Feldman et al. Reference Feldman, Soltano, Pastizzo and Francis2004, Morris et al. Reference Morris, Frank, Grainger and Holcomb2007, Gonnerman et al. Reference Gonnerman, Seidenberg and Andersen2007, Boomershine et al. Reference Boomershine, Currie Hall, Hume, Johnson, Avery, Elan Dresher and Rice2008, Xu and Taft Reference Xu and Taft2015). We were thus more confident that asking about similarity would yield results in all cases. That is, by using a similarity comparison task, we hoped to ensure that all comparison types (morphological, semantic, and phonological) would be represented in the resulting similarity continuum, and specifically that both form and meaning similarity would be recognizable as such. That said, the task certainly allowed participants to make metalinguistic, conscious judgements about similarity that would have been minimized in a priming task.
3. Experiment design
The basic design of the experiment was to use an AXB comparison task, where participants saw a key word and were asked which of two comparison words was more similar to that key word. For example, on a single trial, the key word might be press, and the two comparison words might be pressure and expressway, or expressway and dress, etc. Participants simply had to indicate which of the two comparison words was, according to their subjective judgement, more similar to the key. Note that this differs from a more standard similarity rating task, where there are at least implicit comparisons across trials in addition to within trials about how similar a given trial pair is in comparison to other trial pairs in the experiment. This method makes it easier to compare results across participants, who might otherwise be using very different interpretations of a similarity rating scale, and likely also makes it easier for participants, who can focus on a single trial at a time.
The rationale for this experimental design was that participants would likely have three basic criteria on which to make similarity judgements: (a) semantic relatedness, (b) phonological relatedness, and (c) orthographic relatedness. Words that are morphologically related should be seen to share both semantic and phonological relatedness (and quite likely orthographic relatedness), and should therefore be reliably chosen as more similar than non-morphologically related words. If naïve language users do not perceive any morphological relatedness between a pair of words, then they should treat them as no different from other words that happen to share some semantic, phonological, or orthographic similarity. For example, if speakers do not perceive the admittedly distant morphological relation between press and expressway, they would be expected to choose relatively randomly between expressway or dress, both of which share phonological and orthographic similarity to press: the former contains the whole string <press> within it, while the latter contains only <ress>, but matches in terms of syllable count and rhyme. On the other hand, if they perceive the morphological relation, then they should pick expressway consistently over dress. By doing all possible comparisons of semantically related, phonologically related, morphologically related, and unrelated words, participants are forced to make judgements about different kinds of similarity and to indicate the relative importance they assign to semantic, phonological, and orthographic relatedness. Note that this is not a direct measure of morphological relatedness or even of perceived morphological relatedness; we simply assume that there should be a correlation between perceived similarity and perceived morphological relatedness, and exploit this correlation to create a metric.Footnote 2 As mentioned above, this framework is similar to the approach taken in distributed connectionist models (e.g., Seidenberg and McClelland Reference Seidenberg and McClelland1989, Seidenberg and Gonnerman Reference Seidenberg and Gonnerman2000, Gonnerman et al. Reference Gonnerman, Seidenberg and Andersen2007) and naïve discriminant learning models (Baayen et al. Reference Baayen, Milin, Đurđević, Hendrix and Marelli2011), in that morphological structure is assumed to be an emergent effect of the interactions between form and meaning similarity (see discussion in e.g., Baayen Reference Baayen, Lieber and Stekauer2014, though some evidence against such a view is found in Stockall and Marantz Reference Stockall and Marantz2006).
3.1 Stimuli
The stimuli consisted of 180 unique key words and a set of nine comparison words for each one; these are all listed in the Appendix. The nine comparison words consisted of: an inflected form; two derived forms, one of which was intended to be more transparent than the other, as discussed below; two words that were semantically related to the key without being etymologically related; two words that were phonologically related to the key without being etymologically related; and two words that were unrelated to the key.
Key words were selected by three native English speakers brainstorming words that were likely to have comparison words of the right kinds. The selection process for comparison words was as follows. The inflected form was chosen by doing a Google ngram search for inflected forms of the key; the most frequent inflected form was picked. The first, more transparent derivationally related form had only one affix in addition to the key, and ideally was listed in WordNet (Princeton 2010) as a derivationally related form; if no such word was available, a word that was felt to be relatively transparent was chosen and verified by two native English speakers. The second, ostensibly less transparent derivationally related form generally had two affixes attached to the key word and was found by a search in an online etymological dictionary, to verify that it was historically related to the key. Thus, the primary difference in transparency was due to the number of affixes, but was also confirmed by the intuitions of two native speakers. The two semantically related forms were picked using the most frequently attested conventional meanings (senses) in WordNet for the key; the primary meaning was chosen from the definition of the most frequent sense, and the secondary meaning from the definition of the most frequent sense that belonged to a different lexical category than the primary sense, if available, and otherwise from the definition of the second most frequent sense overall. The first phonologically related form was a rhyming form, which, wherever possible, matched the key word from its stressed vowel to the end of the word, and otherwise came as close to such a match as possible (as judged by two native speakers of English). The second phonologically related form was a cohort-sharing form, which, wherever possible, shared all material from the beginning of the word through to the stressed vowel (inclusive), and again came as close to that ideal as possible if there was no exact match. The two unrelated words were chosen essentially at random, trying to avoid any obvious ways in which they could be semantically related to the key. They never shared an initial phoneme with the key, nor did they ever rhyme with the key. The two unrelated words were also matched to each other in terms of syllable count and lexical category, to avoid one of the two being more similar in either of these ways than the other to the key word (this is necessary for times when the two unrelated words are paired with each other).Footnote 3 Examples are given in Table 1; the complete set of 1,620 comparison words is available in the Appendix. It should be noted that trying to find words in a natural language that entirely meet the guidelines laid out above is nearly impossible; it is our hope that having as many key words as we do (180) will allow generalizations about comparison types to emerge even though not every instance of a comparison word is an ideal match to the goal.
Table 1: Example stimuli

All nine comparison words were paired with every other comparison word for a given key, for 36 types of comparison pair (8 + 7 + 6 + 5 + 4 + 3 + 2 + 1 = 36 pairs) and put in both possible orders, for a total of 72 possible pairs (36 * 2 = 72) for each of the 180 key words. There were thus 12,960 total unique triples of key word and comparison pair (72 * 180 = 12,960). To ensure that individual participants saw any given key word no more than twice, these triplets were divided into 36 groups of 360 triplets each, with two triplets per key word. The triplets were randomly selected for each group, with the caveat that no group contained two triplets that were identical except for the order of the comparison words. Thus, while every group ended up with a random sample of the triplets, the precise number of comparison types that any group had were not the same. For example, one group might have seen five examples of an inflected-unrelated comparison, while another saw only three.
3.2 Procedure
Participants were seated at individual PC workstations with sound-absorbing partitions. Up to four participants were run simultaneously. After a set of four practice trials, participants proceeded to the 360 test trials. An opportunity to take a break was provided after each set of 80 test trials. On any given trial, a key word was presented at the top of the screen in capital letters, with the two comparison words for that trial presented in lowercase letters below the key, to the left and right, as shown in Figure 1. Participants were instructed to press “1” on an accompanying button box if they thought the word on the left was more similar to the key word, and press “5” if they thought the word on the right was more similar. No information about how similarity should be determined was given; if a participant asked for clarification, they were told that they were free to use their own judgements. Instructions were shown on screen below every triplet. Although reaction time was recorded, there was no time limit on the trials, and participants were not given any guidelines about how long they should take. The time to complete a session varied widely across participants, from approximately 15 minutes to approximately 50 minutes; most participants completed the task in approximately 30 minutes.

Figure 1: Example of an E-Prime trial
Each participant was randomly assigned to one of the 36 groups using the psychological testing software E-Prime (Psychology Software Tools 2012), and the 360 stimuli for that group were presented in random order for each participant in that group, also using E-Prime.
3.3 Participants
Five English-speaking participants completed each of the 36 groups, for a total of 180 participants.Footnote 4 All participants self-rated their English proficiency as a 7 on a scale of 1–7 on a post-experiment questionnaire.Footnote 5 Participants were recruited through the University of British Columbia community and received either $10 or course credit for participation. Note that the participants were for the most part undergraduate students at the university and therefore were expected to have a relatively high degree of morphological awareness given their age and education levels (Sternberg and Powell Reference Sternberg and Powell1983, Tyler and Nagy Reference Tyler and Nagy1989).
4. Results
For each of the nine different comparison word types (inflection, derived-1, derived-2, meaning-1, meaning-2, rhyme, cohort, unrelated-1, unrelated-2), a first way to examine the data is to calculate the percentage of the time that that type was chosen, relative to all the trials in which that type was an option. Because all options were presented equally often, the null hypothesis would be that any given type would be selected in 50 % of the trials where it was an option, with all other types sharing equally in the other 50 % of the trials (i.e., 50 % / 8 = 6.25 % each). Larger percentages indicate a tendency for that type to be chosen over the other words it was paired with; smaller percentages indicate a tendency for other choices to be selected instead. Table 2 shows the percentage of the time that each type was chosen, relative to the set of trials where it was an option. Rows represent all trials in which a certain type was an option. Columns show which type was actually chosen in any given trial that contained the option indicated by the row. Row totals therefore sum to 100 %; column totals are meaningless. For example, when an inflected form was one of the two choices given, it was selected 83.3 % of the time, while a transparent derived form was selected 4.1 % of the time. On the other hand, when a transparent derived form was one of the two choices given, it was chosen 75.1 % of the time, and an inflected form was chosen 8.4 % of the time.Footnote 6
Note that at chance, the entries along the diagonal would all be 0.50, and all other cells would be 0.50 / 8 = 0.0625. That is, each of the other eight choices would also have been selected with equal probability when a given option was a choice. Thus, in the examples above, the inflected and transparent derived forms were each chosen more often than expected by chance, looking across all their comparison types (83.3 % > 50 %, 75.1 % > 50 %). When a transparent derived form was paired with an inflected form, however, the transparent derived form was picked less often than expected by chance (4.1 % < 6.25 %), and the inflected form was picked more often than expected by chance (8.4 % > 6.25 %).
Table 2: Percentage of the time that each word type was picked, relative to the total set of times that type was an option. For example, the first row shows what word type was picked for all the trials in which inflected forms were an option. Row totals therefore sum to 1. Chance would have all cells on the diagonal at 0.50 and all other cells in any given row at 0.0625.

The first observation to make is that the percentages with which each comparison type was chosen line up extremely well with the intended similarity. That is, inflected forms were chosen most often (chosen 83 % of the time that they were available), followed by transparent derived forms (75 %), then opaque derived forms and primary meaning forms (62 % each), secondary meaning forms (53 %), rhymes (48 %), cohorts (37 %), and finally unrelated forms (15 %).
A linear regression to predict the percentage of time any given individual word was chosen based on what type of word it was (e.g., the percentage of time pressure was chosen, given that it's a derived-1 word) was statistically significant, with p < 0.001. Each of the nine word types was each individually significant, also with p < 0.001 for each. The adjusted R2 of the model is 0.86. See Table 3 for details.Footnote 7
Table 3: Details of a linear regression model, predicting percentage of each word type chosen, from word type. The final column shows the results of a post-hoc t-test comparing the given entry's percentage with the following entry's percentage.

Post-hoc pairwise comparisons on the individual types (shown in the final column of Table 3) showed that each type was statistically significantly different from the one immediately below it on the list (i.e., inflected vs. derived-1, derived-1 vs. derived-2, etc.), each with p-values of less than 0.001, with two exceptions: derived-2 forms were not significantly different from meaning-1 forms, and the two unrelated forms were not significantly different from each other.
Note that, although meaning-2 forms and rhymes were each chosen with percentages close to 50 % in Table 2, this does not mean that they were being chosen randomly. They would be at chance only if all other elements in the rows were also at chance, that is, at 6.25 %. Instead, every element that occurs to the left of the diagonal (in every row, including those for meaning-2 forms and rhymes) is greater than 6.25 %, while every element that occurs to the right of the diagonal in every row is less than 6.25 %. Thus, elements at the beginning of the list are all occurring more often than expected by chance as compared to elements at the end of the list. Ones that end up being selected close to 50 % of the time are being actively selected that often, that is, less often than elements to their left and more often than elements to their right, which happens in these cases to average out to 50 %, but does not actually indicate random selection.
These results provide strong evidence that the categories assumed by linguists are, by and large, psychologically real in how they relate words to each other, at least insofar as perceived similarity can be used as a measure of relatedness. Morphologically related forms (inflected and derived forms) are the most similar to root forms. Semantically related forms are next, with primary meanings being more closely associated with the root than secondary meanings. Phonologically related forms are next, with rhymes being considered more similar than cohorts. All of the preceding relations are considered to be more similar to root words than unrelated forms. These results line up with prior findings; for example, Radeau et al. (Reference Radeau, Besson, Fonteneau and Luis Castro1998) similarly found that semantic relations caused more priming (measured using reaction time) and less surprisal (measured using event-related potentials) than phonological relations. It has also been found that rhymes cause more priming than cohorts (see discussion in Radeau et al. Reference Radeau, Besson, Fonteneau and Luis Castro1998). In spoken word processing, of course, cohorts are more highly activated than rhymes (e.g., Marslen-Wilson and Zwitserlood Reference Marslen-Wilson and Zwitserlood1989, Allopenna et al. Reference Allopenna, Magnuson and Tanenhaus1998), but this could very well be tied to the timecourse of speech perception. The current experiment involved written words.
There are, however, two observations of particular interest. First, derived-2 forms (relatively opaque derivationally related forms) patterned very much like meaning-1 forms in how often, over all, they were selected. At first glance, this might suggest that more distant derived forms are not always recognized as being morphologically related, but rather simply treated as somewhat semantically related forms, i.e., as though they were meaning-1 forms. However, the pattern of competition was different for derived-2 and meaning-1 forms: derived-2 forms tended to lose out to other morphologically related forms (inflected, derived-1) more than the meaning-1 forms, while the meaning-1 forms tended to have more competition from phonologically related forms (rhymes, cohorts) than the derived-2 forms did. This suggests that the more opaquely derived forms were recognized at least some of the time as being morphologically related, and specifically as being more distantly related than other morphologically related forms, while the semantically related forms were simply treated as a different category of relation. It is quite possible that different participants had different preferences for choosing morphologically, semantically, or phonologically related forms, although the overall tendencies are quite clear. Note, too, that when a derived-2 form was in a pairwise relation with a meaning-1 form, it was more often the derived-2 form that was selected, though both were common choices: 498 cases where derived-1 forms were chosen vs. 415 cases where meaning-1 forms were chosen; an exact binomial test indicates that this difference is significant, p < 0.01. This again suggests that participants indeed distinguish between opaque derived forms and purely semantically related forms, at least some of the time.
The second particularly interesting observation is that although the categories do line up with the linguistically expected order, they are not at all absolute. While inflected forms, for example, are interpreted as being the most similar to root forms across the board, they were selected 83 % of the time that they were an option, not 100 %. When inflected forms were not selected despite being an option, derived-1 and meaning-1 forms were the most likely to be selected instead, followed by derived-2 and meaning-2 forms, rhymes, and cohorts. Unrelated forms were also selected, though only 0.8 % of the time (collapsing the two types of unrelated forms). Similar patterns are seen for the other types: when the given type was not itself chosen, the morphologically related forms, then semantically related forms, then phonologically related forms, and finally the unrelated ones were most likely to be chosen instead. There are several possible explanations for the lack of absolute preferences: first is, of course, simple error; participants could have made a selection that was unintended on any given trial. Given that the choices of types other than inflected forms themselves fall along the now-familiar continuum of relatedness, however, it seems unlikely that this explanation can be right for more than a handful of cases (especially, for example, the unrelated forms). Instead, it seems more likely that the overt nature of the task, where participants were explicitly asked to judge similarity between a root and some other form, may have caused participants to develop strategies, looking for words that they believe to be etymologically, semantically, or phonologically related.
5. Developing a predictive measure
While the results of this behavioural study are encouraging in that they indicate that what linguists understand as morphological relatedness is also recognizable by naïve English speakers, what is of fundamental interest is whether it is possible to predict the degree to which pairs of words are perceived to be morphologically related on the basis of independent measures of similarity. That is, can independently calculated degrees of semantic, phonological, and orthographic similarity between a key word and a comparison word be used to predict the percentage of a time that that comparison word would be chosen in the behavioural study? The current section describes a logistic regression model intended to do exactly that.
5.1 Modeling the original results
Semantic relatednessFootnote 8 was measured using the extended Lesk metric (Banerjee and Pedersen Reference Banerjee and Pedersen2003). The relatedness between a pair of words is calculated as the sum of the square of the length of overlapping words in the definitions of the two words in WordNet (Princeton 2010), ignoring function words and other extremely common words. For example, two definitions that have one overlapping word would have a score of 12 = 1; two definitions with two non-adjacent words overlapping would have a score of 12 + 12 = 2; and two definitions with two adjacent words overlapping would have a score of 22 = 4. In the extended version of this score, used here, definitions of hypernyms, hyponyms, metonyms, and other semantically related words are also included.
For orthographic and phonological similarity, we used a measure of string similarity developed by Khorsi (Reference Khorsi2012), who uses it as a direct measure of morphological relatedness itself. Given the typical linguistic assumption that morphological relatedness is also tied to semantic similarity, this measure is not used in isolation here, but it does provide a means of capturing basic form similarity. This measure takes the sum of the log of the inverse of the frequency of occurrence of each of the letters in the longest common shared sequence between two words, and subtracts the sum of the log of the inverse of the frequency of the letters that are not shared, as shown in (2). Khorsi (Reference Khorsi2012) applies this formula only to orthographic similarity, but it is easily transferred to phonological transcriptions, where the longest common shared sequence of phonemes is used instead. Spellings were based on Canadian English standards, as these were used for stimuli in the experiment. Transcriptions of the stimuli were based on the CMU dictionary pronunciations where available (CMU 2008) and otherwise transcribed using the CMU system by a linguistically trained native speaker of North American English. Token frequency values came from the SUBTLEX corpus (Brysbaert and New Reference Brysbaert and New2009). These calculations of string similarity were carried out using the algorithms provided in the Phonological CorpusTools software package (Hall et al. Reference Hall, Allen, Fry, Mackie and McAuliffe2015).
(2) Formula for string similarity from Khorsi (Reference Khorsi2012)
 $$\hskip-20pt\sum\limits_{i = 1}^{\vert \vert {LCS({w_1},{w_2})} \vert \vert} {\log \bigg(\displaystyle{1 \over {\,freq(LCS({w_1},{w_2})[i])}}\bigg) - \sum\limits_{i = 1}^{\vert \vert {\overline {LCS({w_1},{w_2})}} \vert \vert} {\log \bigg(\displaystyle{1 \over {\,freq(\overline {LCS({w_1},{w_2})[i]} )}}\bigg)}}$$
Note:
• w 1, w 2 are two words whose string similarity is to be measured
• LCS(w 1, w 2) represents the Longest Common Shared Sequence of symbols between the two words
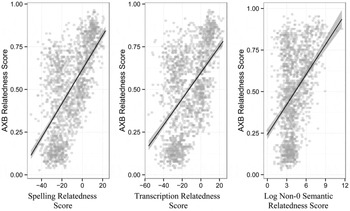
Each of these three measures is, as expected, positively correlated with the probability of a particular comparison word being chosen when it is a choice. Figure 2 shows these correlations; the graph on the left shows orthographic similarity, that in the middle shows phonological similarity, and the graph on the right shows semantic similarity. Note that because the semantic similarity scores are exponential, the log of the scores is taken here to produce a relatively linear relation.

Figure 2: Correlations between individual measures of similarity between individual words and their key word, and the percentage of time each individual word was selected as being “more similar” to the key in all of its trials across all participants.
Although each correlation is in the direction expected, and each is significant at p < 0.001, the correlations are not particularly strong. The adjusted R2 for orthographic similarity is 0.39; that for phonological similarity is 0.27; and for semantic similarity, 0.16. To get an actual predictor of perceived morphological relatedness, these three scores will need to be combined in a joint model.
One might expect frequency to play a role in such a model, as well. There was, however, no observed correlation between the (log) token frequency of a word's occurrence (taken from the SUBTLEX corpus; Brysbaert and New Reference Brysbaert and New2009) and its likelihood of being chosen, as shown in Figure 3; the R2 value for this correlation is < 0.001, with a non-significant p-value of 0.72. An examination of the relation between the (log) frequency ratio of word 1 to word 2 in any given triplet and the likelihood of word 1's being chosen in that triplet did show a significant correlation (p < 0.001), but the R2 value was very small (0.01), and the correlation was negative; see Figure 4 (note that for any single triplet, there are only five instances of its being evaluated in the experiment, because each triplet appeared in only one group, and each group had five participants). This negative correlation is at first surprising, in that it indicates a slight tendency for participants to select the less frequent word in any given pair. This may be due to the fact that many of the morphologically related words are in fact less frequent than the words chosen as semantically or phonologically related and the unrelated words. For example, for the keyword press, the inflected form, pressed, has a SUBTLEX frequency of 60.2 per million and the derived-1 form, pressure, has a frequency of 53.12/million, while the meaning-1 form, push, has a frequency of 70.55/million; the rhyme form, mess, has a frequency of 78.14/million; and the unrelated-1 form, table, has a frequency of 105.63/million. Thus, while there may in fact be a role for frequency, it seems to be one that is itself driven by the fact that participants are more likely to pick morphologically related words as being similar, in spite of the fact that they are in many cases less frequent. Given the very small and apparently artifactual nature of the role of frequency, we do not include any measure of frequency in the joint model; instead, we include only orthographic, phonological, and semantic similarity.

Figure 3: Lack of correlation between the percentage of the time a particular word was picked as being most similar to its key and the log of that word's token frequency in the SUBTLEX corpus.

Figure 4: Slight negative correlation between the percentage of time word 1 in any given triplet was picked as being most similar to its key and the log of the ratio of the frequency between word 1 and word 2, with frequency taken as the token frequency in the SUBTLEX corpus.
Before creating the model, however, the issue of collinearity needs to be dealt with. Orthographic and phonological similarity scores will obviously be highly collinear, and semantic scores may also be collinear with either of the other two, given that many of the word pairs in question are morphologically related and thus share both form and meaning. To eliminate collinearity, then, a principal components analysis was run on the similarity scores for each comparison-key word pair. The resulting first two principal components accounted for 95 % of the variance in these measures, and only these two components were subsequently used in the logistic regression. The first component accounted for 62 % of the total variance and was based entirely on phonological and orthographic similarity, with the loadings of these two scores within the component almost equal. The second component accounted for 33 % of the total variance and was based entirely on the (logged) semantic similarity scores. Thus, the principal components analysis provides a way of collapsing the original phonological, orthographic, and semantic similarity scores into two mutually exclusive components, one encoding the form-similarity between words and the other encoding the meaning-similarity. Details of the analysis are given in Table 4.
Table 4: Summary and loadings for the principal components analysis

These first two components were then used in a logistic regression model that attempts to predict, given the two principal components of two word pairs (i.e., the form and meaning components for key~comparison 1, along with the form and meaning components for key~comparison 2), which of the two comparison words would be chosen as being “more similar” to the key (by predicting whether word 1 will be chosen on any given trial). Model selection was done by comparing models that had varying possible interactions among these four factors, with the best fit model being chosen as the one with the lowest Akaike information criterion (AIC), a measure of the information lost when using a particular model of the data that allows for direct comparison of non-nested models and penalizes the addition of extra parameters in the model. The resulting best fit model (shown in Table 5) relied on all four factors, along with up to three-way interactions among them. As can be seen from the estimates of the single term factors, the likelihood of selecting word 1 increases as a function of the form and meaning components of word 1 and decreases as a function of the form and meaning components of word 2, as expected. The interactions compensate for over- and under-estimates of selecting word 1 on any given trial based on the combination of the components.
Table 5: Best-fit logistic regression model for predicting the likelihood of word 1 being chosen as more similar to a key word. FC1 is the form component for the comparison of the key word to word 1; MC1 is the meaning component of the comparison of the key word to word 1. FC2 and MC2 are the analogous components for the comparison of the key word to word 2.

The model was then applied to the original data to determine its classification accuracy, which was 73 %. That is, the model, which is based entirely on independently calculated scores of semantic, phonological, and orthographic similarity, correctly predicts which of two words our participants chose as being “more similar” to the key on 73 % of trials. Note that the model is not expected to be able to predict with 100 % accuracy, as different participants could have made different choices from each other on identical trials.
5.2 Testing the model against new words
Even more usefully, however, the model can be used to generate predicted “perceived morphological relatedness” scores. This is done by entering a new key word + comparison word pair into the model, using calculated orthographic, transcription, and semantic similarity scores (transformed by the same principal component loadings as the original data). Predicted perceived morphological relatedness, then, is the model's calculated probability that this comparison word would be chosen as being more similar to the key, as compared to the average probability that a known unrelated word would have been chosen.
For example, consider a novel key-comparison pair, table ~ tabulate. The raw orthographic similarity score for this pair is −9.644; the transcription similarity score is −29.672; and the semantic similarity score is 87. These scores are then subjected to the same loadings as the original principal components analysis (first taking the log of the semantic score),Footnote 9 leading to a score of −0.565 for the “form” component and 0.152 for the “meaning” component.
We can then compare these values to the mean values for unrelated key-comparison pairs from the original dataset, which are -1.208 for the form component and -0.420 for the meaning component. These four components are entered as new values into the best-fit logistic regression model from Table 5 above, to produce the probability that table~tabulate would be chosen as being “more similar” than table vs. an unrelated word. This last step is done automatically by using the predict() function of the stats software package in R (R Core Team 2014), with the “type” argument set to “response,” so that probabilities are returned instead of log-odds. A score of 50 % would indicate that tabulate is just as likely to be chosen as more similar to table as an average unrelated word (i.e., there is a 50–50 chance that either will be chosen), while a score of 100 % would indicate that tabulate is always going to be chosen over an unrelated word. Thus, a score of 50 % is indicative of a novel word's being an unrelated form, while a score of 100 % is indicative of its being highly related to the key. The actual value in this case is 71 %, which seems to line up with native-speaker intuitions, in that tabulate is clearly more related to table than an unrelated word would be, but is not as related as an inflected form like tables would be.
Less anecdotally, the model can be tested on an entire set of new key + comparison pairs. 11 novel key words with each of their 9 comparison forms were selected, using the same guidelines as the stimuli used in the behavioural study. Table 6 shows the predicted probability that each class of comparison word will be chosen, as compared to the average unrelated form from the original study.
Table 6: Probabilities for novel words to be selected as more similar to their key word, as compared to an average unrelated word.

The word classes in Table 6 are listed in the order in which they emerged in the original study. Most of the classes emerge in the predictions in the same order, with the novel unrelated forms being selected at chance (48.45 %, 52.78 %) as compared to the original unrelated forms, and inflected forms being highly likely to be chosen, at 91.30 %. At the same time, the model over-predicts rhymes, predicting that they will be chosen over an unrelated form 81.80 % of the time, which would put them between transparent and opaque derivationally related forms.
As in the original model, derived-2 forms are not significantly different from meaning-1 forms [t(20) < 0.001, p > 0.99], with both being predicted to be chosen over an unrelated form around 73 % of the time. However, there is also no difference in this model between the two types of semantically related forms [t(20) = 0.0765, p = 0.94]. Meaning-2 forms are also predicted to be chosen over unrelated forms approximately 73 % of the time. One possible explanation for this anomaly is that the extended Lesk semantic similarity scores are simply based on shared meaning, while the difference between the two semantic forms in the stimuli – “primary” vs. “secondary” meanings – is based on the frequency of use of the two meanings. That is, what is here referred to as the “primary meaning” of the word is simply the most common conventional meaning of the word, and the “secondary meaning” is a less common conventional meaning; the Lesk scores do not take frequency of use into account. Thus, it is quite possible that human participants were less able or less likely to see the relation between, say, press and media, than the model was, since the more frequent meaning of press is something more like push.
5.3 Implications
Based on the predictive results in §5.2, there does seem to be a relatively clear distinction between the first two types of morphologically related forms – that is, inflected forms and transparently derived forms – and all other potentially “related” forms. Specifically, words that are predicted to be chosen at least 82 % of the time as being more similar to a key word than an unrelated word could be considered to be perceived as morphologically related to the key word (or, given a slightly more conservative estimate, those predicted to be chosen at least 86 % of the time). Taking the average of these two potential cut-off values gives us a cut-off value of 84 %. Thus, if one were interested in knowing whether a particular alternation is psychologically “real” to naïve English speakers, and thus whether it could be counted as an actual alternation for the purposes of determining the relative frequency of different alternations in the language, one could simply calculate the semantic, orthographic, and transcription similarities of the words potentially involved in the alternation and put them into the model; scores above 84 % would count as being viable alternations, while scores below this cut-off would be excluded.
As an example, we return to the issue of [s]~[ʃ] alternations in English. Recall that Johnson and Babel (Reference Johnson and Babel2010) claim that the frequency of this alternation is low enough as to not have an impact on their phonological relationship, with the two sounds simply being considered as contrastive. To calculate the actual frequency of this alternation, then, we need to count the number of words that participate in alternations between [s] and [ʃ] and compare that to the number of words that have only [s] or [ʃ], with no alternation. To determine whether any particular word, such as facial or superficial, should belong to the first (alternating) set or the second (non-alternating) set, we can use their predicted perceived morphological relatedness score. Table 7 provides the calculations based on the logistic regression model in Table 5.
Table 7: Predicted perceived morphological relatedness scores for a set of words that are etymologically related to face. Predicted scores of 84 % or greater are treated as being “morphologically related.”

Thus, using 84 % as the cut-off between being morphologically related and not, only type-face and facial would be considered to be related to face, while face-lift, facet, façade, and superficial would not.
Turning to the entire lexicon of English, we can similarly estimate the overall frequency of the [s]~[ʃ] alternation by first extracting all pairs of words from a dictionary (in this case, the Irvine Phonotactic Online Dictionary; Vaden et al. Reference Vaden, Halpin and Hickok2009) where one of the words contains [s] and the other contains [ʃ]; there are 66,097,250 such pairs in total. We then calculated the phonetic, orthographic, and semantic similarity of each of these pairs, subjected them to the z-score normalization and principal components analysis as described above, and applied the logistic regression algorithm to them to calculate the predicted perceived morphological relatedness of each pair. We then used the cut-off of 84 % to determine categorically whether each pair should be considered to be perceived to be morphologically related (and thus a possible alternation) or not. This procedure determines that 9,991 of the total pairs are predicted to be perceived to be morphologically related. Many of these pairs, however, do contain [s] and [ʃ] but are clearly not eligible to be counted as alternations, simply because the two sounds are not aligned with each other (e.g., it predicts that mustache is related to mustaches and that cite is related to citation, both of which are indubitably true but not representative of actual [s]~[ʃ] alternations). Thus, we subjected this set of pairs to a phonological alignment algorithm (again, found in Phonological CorpusTools; Hall et al. Reference Hall, Allen, Fry, Mackie and McAuliffe2015) to exclude all pairs where [s] and [ʃ] are not aligned. The algorithm first calculates the Levenshtein edit distance alignment between the two words, except that it assigns no penalty to [s]~[ʃ] substitutions. The algorithm then tests each pair to see whether the two words contain a common “core” of at least two segments, and specifically checks to see whether the aligned cores between the two words are either identical or have a difference only in [s] vs. [ʃ], with cores that don't have an [s]~[ʃ] substitution being excluded as not a potential alternation. This alignment algorithm narrows the original list of “related” word pairs from 9,991 to 251.
Finally, we count the number of unique [s]- or [ʃ]-containing words that occur in those 251 pairs (373), and compare that to the number of unique [s]- or [ʃ]-containing words in the entire corpus (20,126), for a “frequency of alternation” of 1.85 %.Footnote 10
This procedure does still somewhat overestimate the frequency of alternation (e.g., it predicts that class and clash are related and have an aligned alternation of [s]~[ʃ], presumably because of the relatively high form similarity between the two, other than the difference between [s] and [ʃ]). Most of the words on the final list do, however, seem to accord with our intuitions of alternating forms (e.g., oppress ~ oppression; prejudice ~ prejudicial), with the advantage being that they are arrived at entirely objectively on the basis of their shared phonetic, orthographic, and semantic characteristics. Thus, this method does give us an upper bound on the frequency of the alternation, and in this case, the absolute value of less than 2 % seems intuitively “low.” Without doing similar calculations in other languages, or on other alternations within English, however, it is hard to know whether this is a relatively “frequent” or “infrequent” alternation. That said, one can certainly imagine that in a language where all instances of [ʃ] are derived from /s/, the frequency would be higher. That is, the claim of Johnson and Babel (Reference Johnson and Babel2010) that the [s]~[ʃ] alternation is infrequent in English cannot be verified or denied by this measure, but we now have a way of actually quantifying the degree of perceived alternation. This can in turn be used to determine the extent to which two sounds must alternate in order to be considered meaningful by speakers in determining phonological relations.
6. Conclusions
In conclusion, we have shown that an explicit similarity judgement task can reveal perceived morphological similarity on the part of English speakers; the judgements of such speakers do tend to line up with the intuitions of linguists. Specifically, similarity reveals the relations shown in Figure 5. Morphologically related words tend to be judged as more similar than semantically related words, which in turn are judged as more similar than phonologically related words. Within morphologically related words, inflected forms are more similar to base words than derived forms are, and within derived forms, more transparent forms are more similar to base forms than more opaque forms are. Within semantically related words, more frequently used conventional meanings are treated as being more similar to base words than less frequently used meanings. And within phonologically related words, rhyming words are treated as more similar to base words than cohort words are. All of these types of relations are recognized as resulting in more similarity than is present with intentionally unrelated words.

Figure 5: Overall perceived morphological relatedness
It is still somewhat unclear what the difference between opaque derivationally related forms and semantically related forms might be. While there is some evidence that these two classes of words are treated the same way by speakers, there is also some evidence of at least slight recognition of derived forms as being more similar than semantically related forms. Prior studies have similarly found that derived forms are not processed the same way as semantically related forms, though the results of these studies are not entirely consistent. Indeed, there may be variation even in terms of individual forms. As Gonnerman et al. (Reference Gonnerman, Seidenberg and Andersen2007) found, morphologically complex words may or may not prime each other, depending on how phonologically and semantically related they actually are. There also seems to be cross-linguistic variation; Smolka et al. (Reference Smolka, Preller and Eulitz2014), for instance, found that German speakers treated opaque derivationally related forms the same as transparently derived forms, but not like semantically related forms.
In addition to these general findings about the rated similarity of pairs of words, we have attempted to show that the perceived morphological relatedness of novel words can be estimated from measures of orthographic, phonological, and semantic similarity. This measure can in turn be used to determine whether particular words might constitute psychologically realistic alternations, thus allowing for the calculation of the frequency with which particular pairs of sounds alternate in a language.
While we think that the measures developed here are a good first step, we would like to see future research develop even stronger measures. For example, a measure of the frequency with which different conventional meanings of a word are used could help tease apart the behavioural differences between primary vs. secondary meaning forms. It is also possible that other measures of semantic, orthographic, or phonological similarity might result in a higher classification accuracy for the original logistic regression, in turn yielding stronger results for the predicted perceived morphological relatedness measures. Furthermore, the model proposed here is quite obviously language-dependent; in order to usefully compare frequency of alternations across multiple languages, for example, one would need to conduct similar studies on the perceived morphological relatedness of words within those languages. Furthermore, we would not anticipate that even the order of results would be the same across languages; Smolka et al. (Reference Smolka, Preller and Eulitz2014), for example, find that the patterns of semantic and morphological priming in German are quite different from that in other Indo-European languages, such as the results for Dutch found in Zwitserlood et al. (Reference Zwitserlood, Bolwiender and Drews2004).
In the meantime, though, it is our hope that the proposed metric can be used to develop a more psychologically plausible picture of phonological alternations, based on the perceived morphological relatedness of potential alternations.
Appendix
Part A: Stimuli for Experiment

Part B: Novel Words Used for Model Testing