


1. Introduction
Fluid–structure interaction (FSI) problems often occur in engineering (aircraft and automotive industries, wind turbines) as well as in medical applications (cardiovascular systems, artificial organs, artificial valves, medical devices, etc.). Today, the design of such systems usually requires advanced studies, and high-fidelity (HF) numerical simulations become an essential tool of computed-aided analysis. However, computational FSI is known to be very time-consuming even when using high-performance computing facilities. Usually, engineering problems are parametrized, and the search for suitable designs requires numerous computer experiments leading to prohibitive computational times. For particular applications, such as the tracking of drug-carrier capsules flowing in blood vessels, it would be ideal to have real-time simulations for a better understanding of the behaviour of the dynamics and for efficiency assessment. Unfortunately, today HF real-time FSI simulations are far from being reached with current high-performance computing facilities.
A current trend is to use machine learning (ML) or artificial intelligence tools such as artificial neural networks (ANNs). Such tools learn numerical simulations from HF solvers and try to map entry parameters with output criteria in an efficient way, with response times far less than HF ones, say three or four orders of magnitude smaller. In some sense, heavy HF computations and the training stage are done in an offline stage, and learned ANNs can be used online for real-time evaluations and analysis. However, ML and ANNs today are not fully satisfactory for dynamical problems, and/or the training stage itself may be time-consuming, thus requiring more central processing unit (CPU) time. Another option is the use of model-order reduction (MOR). Reduced-order models (ROMs) can be seen as a ‘grey-box’ supervised ML methodology, taking advantage of the expected low-order dimensionality of the FSI mechanical problem. By ‘grey-box’ we mean that the low-dimensional encoding of the ML process is based on mechanical principles and a manmade preliminary dimensionality reduction study. This allows better control of the ROM accuracy and behaviour. There are two families of MOR: intrusive and non-intrusive approaches. The intrusive approaches use physical equations. The low-order model is derived by setting the physical problem on a suitable low-dimensional space. The accuracy can be very good, but the price to pay is the generation of new code, which can be a tedious and long task. The non-intrusive approach does not require heavy code development. It is based on HF simulation results used as entry data. Although it is not based on HF physical equations, a non-intrusive approach can include a priori physical information, such as e.g. meaningful physical features, prototypes of systems of equations, pre-computed principal components, or consistency with physical principles.
In the recent literature, efficient intrusive ROMs for FSI have been proposed, e.g. in Quarteroni, Manzoni & Negri (Reference Quarteroni, Manzoni and Negri2016). But to our knowledge there are far fewer contributions in non-intrusive ROMs dedicated to FSI.
In this paper, we propose a data-driven MOR approach for FSI problems that is consistent with the equations of kinematics and is designed from a low-order meaningful system of equations. As a case study, we focus on the motion of a microcapsule – a droplet surrounded by a membrane – subjected to confined and unconfined Stokes flow.
Artificial microcapsules can be used in various industrial applications, such as in cosmetics (Miyazawa et al. Reference Miyazawa, Yajima, Kaneda and Yanaki2000; Casanova & Santos Reference Casanova and Santos2016), the food industry (Yun, Devahastin & Chiewchan Reference Yun, Devahastin and Chiewchan2021) and biotechnology, where drug targeting is a high-potential application (Ma & Su Reference Ma and Su2013; Abuhamdan et al. Reference Abuhamdan, Al-Anati, Al Thaher, Shraideh, Alkawareek and Abulateefeh2021; Ghiman et al. Reference Ghiman, Pop, Rugina and Focsan2022). Once in suspension in an external fluid, capsules are subjected to hydrodynamics forces, which may lead to large membrane deformation, wrinkle formation or damage. The numerical model must be able to capture the time evolution of the nonlinear three-dimensional (3-D) large deformations of the capsule membrane. Different numerical strategies are possible to solve the resulting large systems of equations (Lefebvre & Barthès-Biesel Reference Lefebvre and Barthès-Biesel2007; Hu, Salsac & Barthès-Biesel Reference Hu, Salsac and Barthès-Biesel2012; Ye et al. Reference Ye, Shi, Peng and Li2017; Tran et al. Reference Tran, Le, Leong and Le2020). However, they all have long computational times.
Different approaches have been used over the past decade to accelerate the computations, such as high-performance computing (e.g. Zhao et al. Reference Zhao, Isfahani, Olson and Freund2010) and graphics processing units (e.g. Matsunaga et al. Reference Matsunaga, Imai, Omori, Ishikawa and Yamaguchi2014). More recently, ROMs have been proposed to predict the motion of capsules suspended in an external fluid flow. In Quesada, Villon & Salsac (Reference Quesada, Villon and Salsac2021), the authors used the large amount of data generated by numerical simulations to show how relevant it is to recycle these data to produce lower-dimensional problem using physics-based ROMs. However, their method can predict only the steady-state capsule deformed shape. Boubehziz et al. (Reference Boubehziz, Quesada-Granja, Dupont, Villon, De Vuyst and Salsac2021) show for the first time the efficiency of data-driven MOR techniques to predict the dynamics of the capsule in a microchannel. However, the method is cumbersome as it requires two bases, one to predict the velocity field, the other to capture the shape evolution over time. And then they reconstruct the solution in the parameter space thanks to a diffuse approximation strategy.
The proposed method serves different objectives. We have designed the method to be non-intrusive for practical uses of existing HF FSI solver (also referred to as the full-order model, or FOM). That means that the ROM methodology should be data-driven. We also want the ROM to be consistent with the equations of kinematics. The model must thus return the displacement  $\{\boldsymbol{u}\}$ and velocity
  $\{\boldsymbol{v}\}$ fields from a few snapshots provided by the FOM. It must otherwise be able to predict the solution for any parameter vector in a predefined admissible domain. Finally, the kinematics-consistent data-driven ROM of capsule dynamics must ideally open the way to real-time simulations. To do so, we use a coupling between methods that have been devised to analyse complex fluid problems, namely proper orthogonal decomposition (POD) (Lumley Reference Lumley1967; Sirovich Reference Sirovich1987) and dynamic mode decomposition (DMD) (Schmid Reference Schmid2010), along with a Tikhonov regularization for robustness purposes. An interpolation method is implemented to predict the solution for any values of governing parameters that are not present in the training database.
As indicated above, we consider mainly the case of an initially spherical capsule flowing in a microfluidic channel with a square cross-section. The corresponding FOM was developed by Hu et al. (Reference Hu, Salsac and Barthès-Biesel2012) and used to get a complete numerical database of the 3-D capsule dynamics as a function of the parameters of the problem: the capsule-to-tube confinement ratio, hereafter referred to as size ratio  $a/\ell$, and the capillary number
  $Ca$, which measures the ratio between the viscous forces acting onto the capsule membrane and the membrane elastic forces. For clarity reasons, different ROMs are introduced with increasing levels of generality, as detailed in table 1. First, we consider a fixed-parameter vector, and get a space–time ROM in the form of a low-order dynamical system. Next, we generate
  $N$ such ROMs for the
  $N$ parameter samples that fill the admissible parameter domain, and then assess the uniform accuracy (space–time accuracy over the whole sample set). Finally, we propose a strategy to derive a general space–time-parameter ROM for any value of the parameter vector
  $(Ca,a/\ell )$ in the admissible space. To conclude the results section, we apply the ROM to a capsule in a simple shear flow.
Table 1. Stepwise procedure for ROM construction of increasing level of generality.

The paper is organized as follows. First, we present the physics of the problem and the FOM in § 2. The strategy used to develop a non-intrusive space–time ROM is detailed in § 3. We first present the results for an initially spherical capsule flowing in a square channel. We show the results for a given configuration in § 4, generalize them in § 5 on the entire database, formed by all the cases that have reached a stationary state, and present in § 6 the methodology of the space–time parameter ROM. In § 7, we apply the ROM to a capsule in a simple shear flow, before discussing the advantages and limits of the method in § 8.
2. Full-order microcapsule model, parameters and quantities of interest
2.1. Problem description for a spherical capsule in a channel flow
An initially spherical capsule of radius  $a$ flows within a long microfluidic channel having a constant square section of side
  $2\ell$ (figure 1). The suspending fluid and capsule liquid core are incompressible Newtonian fluids with the same kinematic viscosity
  $\eta$.

Figure 1. Sketch of the model geometry showing an initially spherical capsule of radius  $a$ placed in a channel with a constant square section of side
  $2\ell$.
The capsule liquid core is enclosed by a hyperelastic isotropic membrane. Its thickness is assumed to be negligible compared to the capsule dimension. The membrane is thus modelled as a surface devoid of bending stiffness with surface shear modulus  $G_S$. The two non-dimensional governing parameters of the problem are the size ratio
  $a/\ell$ and the capillary number
 \begin{equation} Ca= \eta V/G_S, \end{equation}
where  $V$ is the mean axial velocity of the undisturbed external Poiseuille flow.
The flow Reynolds number is assumed to be very small. We solve the Stokes equations in the external ( $\beta = 1$) and internal (
 $\beta = 2$) fluids, together with the membrane equilibrium equation to determine the dynamics of the deformable capsule within the microchannel.
For the fluid problem, we denote by  $\boldsymbol {v}^{(\beta )}$,
  $\boldsymbol {\sigma }^{(\beta )}$ and
  $p^{(\beta )}$ the velocity, stress and pressure fields in the two fluids. These parameters are non-dimensionalized using
  $\ell$ as characteristic length,
  $\ell /V$ as characteristic time, and
  $G_S \ell$ as characteristic force. The non-dimensional Stokes equations
 \begin{equation} \boldsymbol{\nabla} p^{(\beta)} = Ca\, \nabla^2\boldsymbol{v}^{(\beta)},\quad\boldsymbol{\nabla}\boldsymbol{\cdot}\boldsymbol{v}^{(\beta)}=0,\quad\beta=1,2 \end{equation}
are solved in the domain bounded by the cross-sections  $S_{in}$ at the tube entrance and
  $S_{out}$ at the exit. These cross-sections are assumed to be both located far from the capsule. The reference frame
  $(O,\boldsymbol {x}, \boldsymbol {y}, \boldsymbol {z})$ is centred at each time step on the capsule centre-of-mass
  $O$ in the HF code, but the displacement of the capsule centre-of-mass along the tube axis
  $\boldsymbol {Oz}$ is computed.
The boundary conditions of the problem are as follows.
(i) The velocity field is assumed to be the unperturbed flow field on
 $S_{in}$ and $S_{out}$, i.e. the flow disturbance vanishes far from the capsule.
(ii) The pressure is uniform on
$S_{in}$ and $S_{out}$.(iii) A no-slip boundary condition is assumed at the channel wall
$W$ and on the capsule membrane $M$:
(2.3a,b)\begin{equation} \forall \boldsymbol{x}\in W, \boldsymbol{v}(\boldsymbol{x})=\boldsymbol{0};\quad \forall \boldsymbol{x} \in M,\ \boldsymbol{v}(\boldsymbol{x})=\frac{\partial \boldsymbol{u}}{\partial t}. \end{equation}(iv) The normal load
$\boldsymbol {n}$ on the capsule membrane $M$ is continuous, i.e. the non-dimensionalized external load per unit area $\boldsymbol {q}$ exerted by both fluids is due to the viscous traction jump
(2.4)where\begin{equation} (\boldsymbol{\sigma}^{(1)}-\boldsymbol{\sigma}^{(2)})\boldsymbol{\cdot}\boldsymbol{n} = \boldsymbol{q}, \end{equation}$\boldsymbol {n}$ is the unit normal vector pointing towards the suspending fluid.


To close the problem, the external load  $\boldsymbol {q}$ on the membrane is deduced from the local equilibrium equation, which, in the absence of inertia, can be written as
 \begin{equation} \boldsymbol{\nabla}_s \boldsymbol{\cdot} \boldsymbol \tau + \boldsymbol{q} = \boldsymbol 0, \end{equation}
where  $\boldsymbol {\tau }$ is the non-dimensionalized Cauchy tension tensor (forces per unit arc length in the deformed plane of the membrane), and
  $\boldsymbol {\nabla }_s \boldsymbol {\cdot }$ is the surface divergence operator. We assume that the membrane deformation is governed by the strain-softening neo-Hookean law. The principal Cauchy tensions can then be expressed as
 \begin{equation} \tau_1 = \frac{G_S}{\lambda_1 \lambda_2}\left[ \lambda_1^2 - \frac{ 1}{(\lambda_1 \lambda_2)^2}\right]\quad (\text{likewise for } \tau_2), \end{equation}
where  $\lambda _1$ and
  $\lambda _2$ are the principal extension ratios measuring the in-plane deformation.
2.2. Numerical procedure
The FSI problem is solved by coupling a finite element method that determines the capsule membrane mechanics with a boundary integral method that solves for the fluid flows (Walter et al. Reference Walter, Salsac, Barthès-Biesel and Le Tallec2010; Hu et al. Reference Hu, Salsac and Barthès-Biesel2012). Thanks to the latter, only the boundaries of the flow domain, i.e. the channel entrance  $S_{in}$ and exit
  $S_{out}$, the channel wall and the capsule membrane, have to be discretized to solve the problem. The mesh of the initially spherical capsule is generated by subdividing the faces of the icosahedron (regular polyhedron with 20 triangular faces) inscribed in the sphere until reaching the desired number of triangular elements. At the last step, nodes are added at the middle of all the element edges to obtain a capsule mesh with 1280
  $P_2$ triangular elements and 2562 nodes, which correspond to a characteristic mesh size
  $\Delta h_C= 0.075\,a$. The channel mesh of the entrance surface
  $S_{in}$ and exit surface
  $S_{out}$, and of the channel wall, is generated using Modulef (INRIA, France). The central portion of the channel, where the capsule is located, is refined. The channel mesh comprises 3768
  $P_1$ triangular elements and 1905 nodes.
At time  $t=0$, a spherical capsule is positioned with its centre-of-mass
  $O$ on the channel axis. At each time step, the in-plane stretch ratios
  $\lambda _1$ and
  $\lambda _2$ are computed from the node deformation. The elastic tension tensor
  $\boldsymbol \tau$ is then deduced from the values of
  $\lambda _1$ and
  $\lambda _2$. The finite element method is used to solve the weak form of the membrane equilibrium equation (2.5) and determine the external load
  $\boldsymbol {q}$.
Applying the boundary integral method, the velocity of the nodes on the capsule membrane reads (Pozrikidis Reference Pozrikidis1992)
 \begin{align} \boldsymbol{v}(\boldsymbol{x}) \,{=}\, \boldsymbol{v}^\infty(\boldsymbol{x}) - \frac{1}{8{\rm \pi}\mu_F} \left[ \int_M \boldsymbol{J}(\boldsymbol{r})\boldsymbol{\cdot}\boldsymbol{q} \,{\rm d}S(\boldsymbol{y}) + \int_W \boldsymbol{J}(\boldsymbol{r})\boldsymbol{\cdot} \boldsymbol{f}\, {\rm d}S(\boldsymbol{y})\,{-}\,\Delta P \int_{S_{out}} \boldsymbol{J}(\boldsymbol{r})\boldsymbol{\cdot} \boldsymbol{n}\, {\rm d}S(\boldsymbol{y})\right] \end{align}
for any  $\boldsymbol {x}$ in the spatial domain when the suspending and internal fluids have the same viscosity. The vector
  $\boldsymbol {f}$ is the disturbance wall friction due to the capsule,
  $\Delta P$ is the additional pressure drop, and
  $\boldsymbol {r}=\boldsymbol {y}-\boldsymbol {x}$.
To update the position of the membrane nodes, the nodal displacement  $\boldsymbol {u}$ is computed by integrating equation (2.3a,b) in time. The procedure is repeated until the desired non-dimensional time
  $VT/\ell$.
For later development, it is more convenient to work on the condensed abstract form of the system. The full-order semi-discrete FSI system to solve consists of the kinematics and the membrane equilibrium algebraic equations:
 $$\begin{gather} \{\dot{\boldsymbol{u}}\} = \{\boldsymbol{v}\}, \quad t\in [0,T], \end{gather}$$
 $$\begin{gather}\{\boldsymbol{v}\} = \varphi(\{\boldsymbol{u}\}), \end{gather}$$
where  $\varphi$ is a nonlinear mapping from
  $\mathbb {R}^{3d}$ to
  $\mathbb {R}^{3d}$, and
  $d$ is the number of nodes on the membrane. Regarding time discretization, a Runge–Kutta Ralston scheme is used:
 $$\begin{gather} \{\hat{\boldsymbol{u}}^{n+2/3}\} = \{\boldsymbol{u}^n\} + \tfrac{2}{3}\,\Delta t \, \{\boldsymbol{v}^{n}\}, \end{gather}$$
 $$\begin{gather}\{\hat{\boldsymbol{v}}^{n+2/3}\} = \{\varphi\}(\{\hat{\boldsymbol{u}}^{n+2/3}\}), \end{gather}$$
 $$\begin{gather}\{\boldsymbol{u}^{n+1}\} = \{\boldsymbol{u}^n\} + \Delta t \, \left(\tfrac{1}{4}\{\boldsymbol{v}^{n}\}+\tfrac{3}{4}\{\hat{\boldsymbol{v}}^{n+2/3}\}\right), \end{gather}$$
 $$\begin{gather}\{\boldsymbol{v}^{n+1}\} = \{\varphi\}(\{\boldsymbol{u}^{n+1}\}), \end{gather}$$
 $$\begin{gather}\{\boldsymbol{u}^0\} = \{\boldsymbol{0}\},\ \{\boldsymbol{v}^{0}\} = \{\varphi\}(\{\boldsymbol{0}\}), \end{gather}$$
where  $\Delta t>0$ is a constant time step, and
  $\{\boldsymbol{u}\}^n$ and
  $\{\boldsymbol{v}\}^n$ respectively represent the discrete membrane displacement field and the discrete membrane velocity field at discrete time
  $t^n=n\,\Delta t$. The initial condition is simply
  $\{\boldsymbol{u}\}^0=\{\boldsymbol{0}\}$.
The whole numerical scheme is subject to some Courant–Friedrichs–Lewy type stability condition on the time step (Walter et al. Reference Walter, Salsac, Barthès-Biesel and Le Tallec2010) because of its explicit nature. The numerical method is conditionally stable if the time step  $\Delta t$ satisfies
 \begin{equation} \frac{V}{\ell}\,\Delta t < O\left( \frac{\Delta h_C}{\ell}\,Ca\right). \end{equation}
From the computational point of view, the resolution of (2.9) at each time step requires (i) the computation of the disturbance wall friction  $\boldsymbol {f}$ at all the wall nodes, (ii) the additional pressure drop
  $\Delta P$, (iii) the traction jump
  $\boldsymbol {q}$ at the membrane nodes, and (iv) the boundary integrals for each node. The resulting numerical FOM may thus be time-consuming, depending on the membrane discretization and the number of time steps. Figure 2 shows that the evolution of the computational cost when
  $a/\ell =0.7$, considering the mesh discretization described above and a workstation equipped with two Intel
![]() Xeon
Xeon![]() Gold 6130 CPU (2.1 GHz) processors. A week of computation is sometimes necessary to simulate the dynamics of an initially spherical capsule in a microchannel over the non-dimensional time
Gold 6130 CPU (2.1 GHz) processors. A week of computation is sometimes necessary to simulate the dynamics of an initially spherical capsule in a microchannel over the non-dimensional time  $VT/\ell =10$.
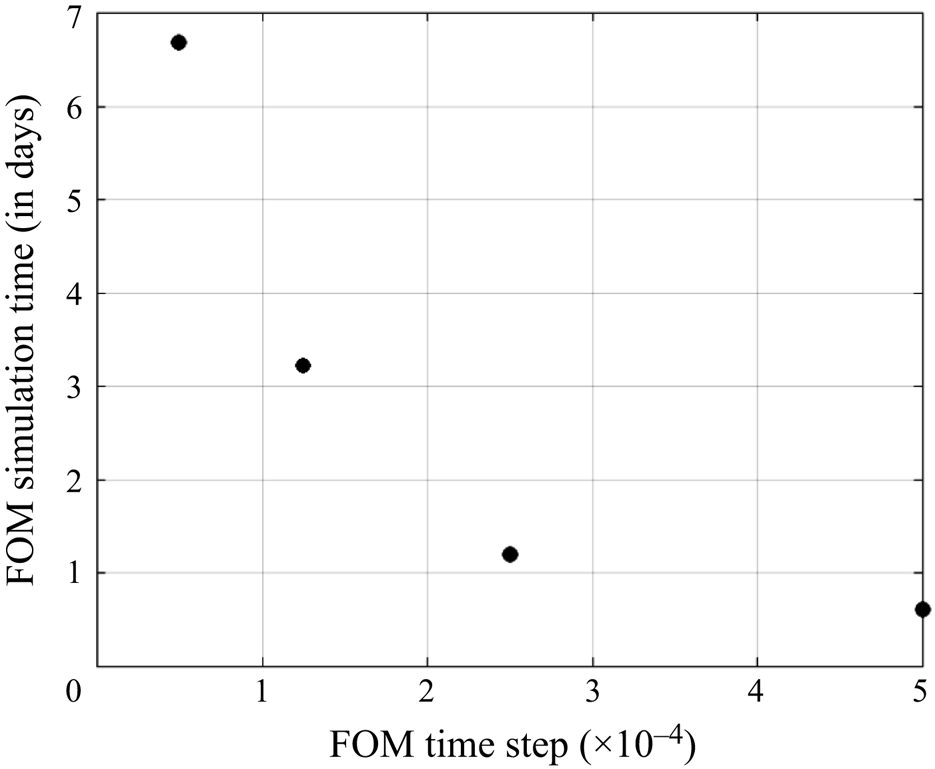
Figure 2. Simulation time of the dynamics of the capsule over a non-dimensional time  $Vt/\ell =10$ (
 $a/\ell =0.7$) according to the time step
  $\Delta t$. Simulations were performed on a workstation equipped with two Intel
![]() Xeon
Xeon![]() Gold 6130 CPU (2.1 GHz) processors.
Gold 6130 CPU (2.1 GHz) processors.
For that reason, an MOR strategy is studied in this paper, in order to reduce the computational time by several orders of magnitude. ROMs try to approximate solutions of the initial problem by strongly lowering the dimensionality of the numerical model, generally using a reduced basis of suitable functions, then derive a low-order system of equations.
In the case of differential algebraic equations (DAEs) such as (2.8)–(2.9), the reduced system of equations to find should also be of DAE nature. We remark that it is often possible to reformulate DAEs as a system of ordinary differential equations (ODEs) (Ascher & Petzold Reference Ascher and Petzold1998). In the next section, we give details on the chosen ROM methodology for the particular case and context of the FSI capsule problem.
3. Non-intrusive space–time MOR strategy
In this section, the parameter couple  $\boldsymbol {\theta }=(Ca,a/\ell )$ is fixed, thus we omit the dependency of the solutions with respect to
  $\boldsymbol {\theta }$ for the sake of simplicity. For the derivation of the ROM, we consider the semi-discrete time-continuous version of the FOM, i.e. (2.8)–(2.9).
3.1. Dimensionality reduction and reduced variables for displacements and velocities
Assume first that for any  $t\in [0,T]$, the discrete velocity field can be approximated accurately according to the expansion
 \begin{equation} \{\boldsymbol{v}\}(t) \approx \sum_{k=1}^K \beta_k(t)\, \{ \boldsymbol{\phi}_k\} \end{equation}
for some orthonormal modes  $\{ \boldsymbol{\phi}_k\} \in \mathbb {R}^d$ and real coefficients
  $\beta _k(t)$. The truncation rank
  $K\leq d$ is, of course, expected to be far less than
  $d$ as expected in a general ROM methodology. From the kinematics equations, we have
 \begin{align} \{\boldsymbol{u}\}(t) &= \int_0^t \{\boldsymbol{v}\}(s)\, {\rm d}s\nonumber\\ &\approx \int_0^t \beta_k(s)\, \{ \boldsymbol{\phi}_k\} \, {\rm d}s, \end{align}
so the displacement field can be represented accurately by
 \begin{equation} \{\boldsymbol{u}\}(t) \approx \sum_{k=1}^K\alpha_k(t)\, \{ \boldsymbol{\phi}_k\}, \end{equation}
where  ${\alpha _k(t)=\int _0^t \beta _k(s)\, {\rm d}s}$. The coefficients
  $(\alpha _k(t))_k$ and
  $(\beta _k(t))_k$ are called the reduced variables. For the sake of readability and mental correspondence between full-order unknowns and reduced ones, we will use the convenient notations
 \begin{equation} \boldsymbol{\alpha}(t)=(\alpha_1(t),\ldots,\alpha_K(t))^{\rm T},\quad \boldsymbol{\beta}(t)=(\beta_1(t),\ldots,\beta_K(t))^{\rm T}, \end{equation}
where the superscript  ${\rm T}$ denotes the transpose of the matrix. The condensed matrix forms of (3.3) and (3.1), respectively, are
 \begin{equation} \{\boldsymbol{u}\}(t) \approx \boldsymbol{\mathsf{Q}}\, \boldsymbol{\alpha}(t),\quad \{\boldsymbol{v}\}(t) \approx \boldsymbol{\mathsf{Q}}\, \boldsymbol{\beta}(t), \end{equation}
where  $\boldsymbol{\mathsf{Q}}=[\{ \boldsymbol{\phi}_1\} ,\ldots,\{ \boldsymbol{\phi}_K\} ]\in \mathscr {M}_{dK}$. Since the modes
  $\{ \boldsymbol{\phi}_k\}$ are assumed to be orthonormal (for the standard Euclidean inner product), the matrix
  $\boldsymbol{\mathsf{Q}}$ is a semi-orthogonal matrix, i.e.
  $\boldsymbol{\mathsf{Q}}^{\rm T}\boldsymbol{\mathsf{Q}}=\boldsymbol{\mathsf{I}}_K$. In particular, we have
  $\boldsymbol {\alpha }(t)\approx \boldsymbol{\mathsf{Q}}^{\rm T}\, \{\boldsymbol{u}\}(t)$ and
  $\boldsymbol {\beta }(t)=\boldsymbol{\mathsf{Q}}^{\rm T}\, \{\boldsymbol{v}\}(t)$.
Note that the modes  $\{ \boldsymbol{\phi}_k\}$ and reduced variables
  $\boldsymbol {\alpha },\boldsymbol {\beta }$ are determined for each parameter set
  $(Ca, a/\ell )$, but a common value of the truncation rank
  $K$ is chosen for all the sets. Its practical computation will be detailed in a next subsection, as well as that of the modes
  $\{ \boldsymbol{\phi}_k\}$.
3.2. ROM prototype
The expressions  $\{ \tilde {\boldsymbol{u}}\} (t)=\boldsymbol{\mathsf{Q}}\, \boldsymbol {\alpha }(t)$ and
  $\{ \tilde {\boldsymbol{v}}\} (t)=\boldsymbol{\mathsf{Q}}\, \boldsymbol {\beta }(t)$ provide low-order representations of displacement and velocity fields, respectively. We can now write equations for the reduced vectors
  $\boldsymbol {\alpha }(t)$ and
  $\boldsymbol {\beta }(t)$. In this subsection, let us consider a projection Galerkin-type approach. Let us denote by
  $\langle \cdot,\cdot \rangle$ the standard Euclidean scalar product in
  $\mathbb {R}^d$. Considering a test vector
  $\{ \boldsymbol{w}\}$ in
  $W={\rm span}(\{ \boldsymbol{\varphi}_1\} ,\ldots,\{ \boldsymbol{\varphi}_K\} )$, we look for an approximate displacement field
  $\{\tilde{\boldsymbol{u}}\}(t)$ solution of the projected kinematics equations
 \begin{equation} \left\langle \frac{{\rm d}}{{\rm d}t}\{ \tilde {\boldsymbol{u}}\} (t),\{ \boldsymbol{w}\} \right\rangle = \langle \{ \tilde {\boldsymbol{v}}\} (t),\{ \boldsymbol{w}\} \rangle, \quad \forall\, \{ \boldsymbol{w}\} \in W. \end{equation}
By considering each test vector  $\{ \boldsymbol{w}\} =\{ \boldsymbol{\varphi}_k\}$, we get the consistent reduced kinematics equation
 \begin{equation} \dot{\boldsymbol{\alpha}} = \boldsymbol{\beta}. \end{equation}
 Consider now the projected field  $\{ \tilde {\boldsymbol{v}}\} (t)$ that is a solution of the system of algebraic equations (Galerkin approach)
 \begin{equation} \langle \{ \tilde {\boldsymbol{v}}\} (t),\{ \boldsymbol{w}\} \rangle = \langle \varphi(\{ \tilde {\boldsymbol{u}}\} (t)),\{ \boldsymbol{w}\} \rangle, \quad \forall\, \{ \boldsymbol{w}\} \in W. \end{equation}
Again by taking the test vector  $\{ \boldsymbol{w}\}=\{\boldsymbol{\phi}_k\}$, we have
 \begin{equation} \{\boldsymbol{\phi}_k\}^{\rm T} \boldsymbol{\mathsf{Q}}\,\boldsymbol{\beta}(t) = \{\boldsymbol{\phi}_k\}^{\rm T} \varphi(\boldsymbol{\mathsf{Q}}\,\boldsymbol{\alpha}(t)). \end{equation}
Considering all  $k$ in
  $\{1,\ldots,K\}$, since
  $\boldsymbol{\mathsf{Q}}=[\{ \boldsymbol{\phi}_1\} ,\ldots,\{ \boldsymbol{\phi}_K\} ]$ and
  $\boldsymbol{\mathsf{Q}}^{\rm T}\boldsymbol{\mathsf{Q}}=\boldsymbol{\mathsf{I}}_K$ we get
 \begin{equation} \boldsymbol{\mathsf{Q}}^{\rm T} \boldsymbol{\mathsf{Q}}\,\boldsymbol{\beta}(t) = \boldsymbol{\beta}(t) = \boldsymbol{\mathsf{Q}}^{\rm T}\,\varphi(\boldsymbol{\mathsf{Q}}\,\boldsymbol{\alpha}(t)). \end{equation}
This is in the form
 \begin{equation} \boldsymbol{\beta}(t) = \boldsymbol{\varphi}_{rz}(\boldsymbol{\alpha}(t)), \end{equation}
with the mapping  $\boldsymbol{\varphi}_r:\mathbb {R}^K\rightarrow \mathbb {R}^K$ defined by
  $\boldsymbol{\varphi}_r(\boldsymbol {\alpha })=\boldsymbol{\mathsf{Q}}^{\rm T}\,\varphi (\boldsymbol{\mathsf{Q}}\boldsymbol {\alpha })$. We get a reduced-order algebraic equilibrium equation. Unfortunately, because of the nonlinearities in
  $\varphi$, the computation of
  $\boldsymbol{\varphi}_r(\boldsymbol {\alpha })$ requires high-dimensional
  $O(d)$ operations, making this approach irrelevant from the performance point of view. A possible solution to deal with the nonlinear terms would be to use, for example, empirical interpolation methods (Barrault et al. Reference Barrault, Maday, Nguyen and Patera2004), but from the algorithm and implementation point of view, this would lead to an intrusive approach with specific code developments. We here rather adopt a linearization strategy in the following sense: by differentiating (3.11) with respect to time, we get
 \begin{equation} \dot{\boldsymbol{\beta}}(t) = \frac{\partial\boldsymbol{\varphi}_r}{\partial \boldsymbol{\alpha}}\,(\boldsymbol{\alpha}(t)) \, \dot{\boldsymbol{\alpha}}(t). \end{equation}
Thanks to the reduced kinematics equation (3.7), we get
 \begin{equation} \dot{\boldsymbol{\beta}}(t) = \frac{\partial\boldsymbol{\varphi}_r}{\partial \boldsymbol{\alpha}}\,(\boldsymbol{\alpha}(t)) \, \boldsymbol{\beta}(t). \end{equation}
Since  $\boldsymbol{\varphi}_r$ is hard to evaluate, it is even harder to evaluate its differential. But the differential
  $({\partial \boldsymbol{\varphi}_r}/{\partial \boldsymbol {\alpha }})(\boldsymbol {\alpha }(t))$ can be approximated itself, or replaced by some matrix
  $\boldsymbol{\mathsf{A}}(t)$. Then we get a ROM structure (ROM prototype) in the form
 $$\begin{gather} \dot{\boldsymbol{\alpha}} = \boldsymbol{\beta}(t), \end{gather}$$
 $$\begin{gather}\dot{\boldsymbol{\beta}}(t) = \boldsymbol{\mathsf{A}}(t) \, \boldsymbol{\beta}(t) . \end{gather}$$
The differential system (3.14)–(3.15) is linear with variable coefficient matrix  $\boldsymbol{\mathsf{A}}(t)\in \mathscr {M}_K(\mathbb {R})$. It can be written in matrix form as
 \begin{equation} \frac{{\rm d}}{{\rm d}t}\begin{pmatrix} \boldsymbol{\alpha}(t)\\ \boldsymbol{\beta}(t) \end{pmatrix} = \underbrace{\begin{pmatrix} [0] & \boldsymbol{\mathsf{I}}_K \\ [0] & \boldsymbol{\mathsf{A}}(t) \end{pmatrix}}_{=\boldsymbol{\mathsf{A}}(t)} \begin{pmatrix} \boldsymbol{\alpha}(t)\\ \boldsymbol{\beta}(t) \end{pmatrix}. \end{equation}
The spectral properties of the differential system (3.16) are related to the spectral properties of matrix  $\boldsymbol{\mathsf{A}}(t)$. In particular, if all the (complex) eigenvalues
  $\lambda _k(t)$ of
  $\boldsymbol{\mathsf{A}}(t)$ are such that
  $\mathrm {Re}(\lambda _k(t))<0$ for all
  $k$ (uniformly distributed in time), then the system is dissipative.
3.3. Non-intrusive approach, singular value decomposition and POD modes
One of the requirements of this work is to achieve a non-intrusive ROM, meaning that the effective implementation of the ROM does not involve tedious low-level development of the FOM code. For that, a data-based approach is adopted: from the FOM code, it is possible to compute FOM solutions  $(\{\boldsymbol{u}\}^n,\{\boldsymbol{v}\}^n)$ at discrete times
  $t^n$,
  $n=0,\ldots,N$ (
 $t^N=N\,\Delta t=T$), then store some snapshot solutions (called snapshots) into a database for data analysis and later design of a ROM. Proper orthogonal decomposition (POD) (Berkooz, Holmes & Lumley Reference Berkooz, Holmes and Lumley1993) is today a well-known dimensionality reduction approach to determine the principal components from solutions of partial differential equations. The Sirovich snapshot variant approach (Sirovich Reference Sirovich1987) is based on snapshot solutions from a FOM to get a posteriori empirical POD modes
  $\{ \boldsymbol{\varphi}_k\}$. For the sake of simplicity, assume that the snapshot solutions are all the discrete FOM solution at simulation instants. Applying a singular value decomposition (SVD) to the displacement snapshot matrix
 \begin{equation} \mathbb{S}^u = [\boldsymbol{u}^1,\boldsymbol{u}^2,\ldots,\boldsymbol{u}^N] \end{equation}
of size  $d\times N$, we get the SVD decomposition
 \begin{equation} \mathbb{S}^u = \boldsymbol{\mathsf{U}} \varSigma \boldsymbol{\mathsf{V}}^{\rm T}, \end{equation}
with orthogonal matrices  $\boldsymbol{\mathsf{U}}\in \mathscr {M}_d(\mathbb {R})$,
  $\boldsymbol{\mathsf{V}}\in \mathscr {M}_N(\mathbb {R})$ and the singular value matrix
  $\varSigma ={\rm diag}(\sigma _k)\in \mathscr {M}_{d\times N}(\mathbb {R})$, with
  $\sigma _k\geq 0$ for all
  $k$ organized in decreasing order:
  $\sigma _1\geq \sigma _2\geq \cdots \geq \sigma _{\min (d,N)}\geq 0$. From SVD theory, for a given accuracy threshold
  $\varepsilon >0$, the truncation rank
  $K=K(\varepsilon )$ is computed as the smallest integer such that the inequality
 \begin{equation} \frac{\displaystyle{\sum_{k=K+1}^{\min(d,N)} \sigma_k^2}}{\displaystyle{\sum_{k=1}^{\min(d,N)}\sigma_k^2}}\leq \varepsilon \end{equation}
holds (Shawe-Taylor & Cristianini Reference Shawe-Taylor and Cristianini2004). Proceeding like that, it is shown that the relative orthogonal projection error of the snapshots  $\{\boldsymbol{v}\}^n$ onto the linear subspace
  $W$ spanned by the
  $K$ first eigenvectors of
  $\boldsymbol{\mathsf{U}}$ is controlled by
  $\varepsilon$. Denoting by
  ${\rm \pi} ^W$ the linear orthogonal projection operator over
  $W$, we have
 \begin{equation} \sum_{n=1}^N \|\{\boldsymbol{v}\}^n-{\rm \pi}^W\{\boldsymbol{v}\}^n\|^2 \leq \varepsilon \sum_{n=1}^N \|\{\boldsymbol{v}\}^n\|^2. \end{equation}
The matrix  $\boldsymbol{\mathsf{Q}}$ is obtained as the restriction of
  $\boldsymbol{\mathsf{U}}$ to its first
  $K$ columns.
3.4. Data-driven identification of coefficient matrix
The system (3.14)–(3.15) is still not closed since the coefficient matrices  $\boldsymbol{\mathsf{A}}(t)$ are unknowns. From FOM data, one can try to identify the matrices by minimizing some residual function that measures the model discrepancy. The simplest linear model corresponds to the case where
  $\boldsymbol{\mathsf{A}}(t)$ is searched as a constant-time matrix
  $\boldsymbol{\mathsf{A}}$. In this case, (3.15) becomes
  $\dot {\boldsymbol {\beta }}(t) = \boldsymbol{\mathsf{A}} \, \boldsymbol {\beta }(t)$. This is the scope of this paper. From the continuous-time problem, one could determine the matrix
  $\boldsymbol{\mathsf{A}}$ by minimizing the least squares functional
 \begin{equation} \min_{\boldsymbol{\mathsf{A}}\in\mathscr{M}_K(\mathbb{R})} \frac{1}{2}\int_0^{\rm T} \|\dot{\boldsymbol{\beta}}(t)-\boldsymbol{\mathsf{A}}\,\boldsymbol{\beta}(t)\|^2\, {\rm d}t. \end{equation}
But practically, we have velocity snapshot data only at discrete times, and we do not have access to the time derivatives of the velocity fields. So the following numerical procedure is adopted. From the velocity snapshot matrix  $\mathbb {S}^v=[\{\boldsymbol{v}\}^1,\ldots,\{\boldsymbol{v}\}^N]$, we compute first the reduced snapshot variables
 \begin{equation} \boldsymbol{\beta}^n = \boldsymbol{\mathsf{Q}}\, \{\boldsymbol{v}\}^n,\quad n=1,\ldots,N. \end{equation}
Next, we determine a matrix  $\boldsymbol{\mathsf{A}}$ that minimizes the least squares cost function
 \begin{equation} \min_{\boldsymbol{\mathsf{A}}\in\mathscr{M}_K(\mathbb{R})}\ \frac{1}{2} \sum_{n=1}^{N-1} \left\|\frac{\boldsymbol{\beta}^{n+1}-\boldsymbol{\beta}^n}{\Delta t}-\boldsymbol{\mathsf{A}}\boldsymbol{\beta}^n \right\|^2. \end{equation}
In (3.23), the finite difference  $({\boldsymbol {\beta }^{n+1}-\boldsymbol {\beta }^n})/{\Delta t}$ is a first-order approximation (in
  $\Delta t$) of
  $\dot {\boldsymbol {\beta }}$ at time
  $t^n$. In Appendix A, we provide a mathematical analysis of the effect of time discretization in (3.23) about the impact on the stability of the resulting identified differential system compared to the initial one.
The minimization problem (3.23) can be written in condensed matrix form
 \begin{equation} \min_{\boldsymbol{\mathsf{A}}\in\mathscr{M}_K(\mathbb{R})}\, \frac{1}{2}\,\|\mathbb{Y}-\boldsymbol{\mathsf{A}}\mathbb{X}\|_F^2, \end{equation}
with the two data matrices
 \begin{equation} \mathbb{X} = [\boldsymbol{\beta}^1,\boldsymbol{\beta}^2,\ldots,\boldsymbol{\beta}^{N-1}],\quad \mathbb{Y} = \left[\frac{\boldsymbol{\beta}^2-\boldsymbol{\beta}^1}{\Delta t},\ldots,\frac{\boldsymbol{\beta}^N-\boldsymbol{\beta}^{N-1}}{\Delta t} \right]. \end{equation}
Because  $\mathbb {X}$ and
  $\mathbb {Y}$ store reduced variables (of size
  $K$), for a sufficient number of discrete snapshot times, these two matrices are horizontal ones. We will assume that the rank of
  $\mathbb {X}$ is always maximal, i.e. equal to
  $K$. The least squares solution
  $\boldsymbol{\mathsf{A}}$ of (3.24) is then given by
 \begin{equation} \boldsymbol{\mathsf{A}} = \mathbb{Y}\mathbb{X}^{\dagger}, \end{equation}
where  $\mathbb {X}^{\dagger} =\mathbb {X}^{\rm T}(\mathbb {X}\mathbb {X}^{\rm T})^{-1}$ is the Moore–Penrose pseudo-inverse matrix of
  $\mathbb {X}$. This least squares approach has close connections with SVD-based DMD (Schmid Reference Schmid2010; Kutz et al. Reference Kutz, Brunton, Brunton and Proctor2016).
3.5. Tikhonov least squares regularized formulation
From standard spectral theory arguments, it is expected that the POD coefficients decay rapidly when  $k$ increases as soon as both displacement and velocity fields are smooth enough. A possible side effect is the bad condition number of the matrix
  $\mathbb {X}$, since the last rows of
  $\mathbb {X}$ have small coefficients (thus leading to row vectors close to zero ‘at the scale’ of the first row of
  $\mathbb {X}$). Even if the solution
  $\boldsymbol{\mathsf{A}}$ in (3.26) always exists, the solution may be sensitive to perturbations, noise or round-off errors. In order to get a robust identification approach, one can regularize the least squares problem (3.24) by adding a Tikhonov regularization term (see e.g. Aster, Borchers & Thurber Reference Aster, Borchers and Thurber2019)
 \begin{equation} \min_{\boldsymbol{\mathsf{A}}\in\mathscr{M}_K(\mathbb{R})}\, \frac{1}{2}\,\|\mathbb{Y}-\boldsymbol{\mathsf{A}}\mathbb{X}\|_F^2 + \frac{\mu}{2}\, \|\mathbb{X}\|_F^2\, \|\boldsymbol{\mathsf{A}}\|_F^2, \end{equation}
where the scalar  $\mu >0$ is the regularization coefficient. The factor
  $\|\mathbb {X}\|_F^2$ in the regularization term has been added for scaling purposes. The solution
  $\boldsymbol{\mathsf{A}}_\mu$ of (3.27) is given by
 \begin{equation} \boldsymbol{\mathsf{A}}_\mu = \mathbb{Y} \mathbb{X}^{\rm T}(\mathbb{X}\mathbb{X}^{\rm T}+\mu \|\mathbb{X}\|_F^2\, \boldsymbol{\mathsf{I}}_K)^{{-}1}. \end{equation}
3.5.1. Choice of optimal regularization coefficient
Of course, the solution matrix  $\boldsymbol{\mathsf{A}}_\mu$ depends on the regularization coefficient
  $\mu$, and one can ask what is the optimal choice for
  $\mu$. There is a trade-off between the approximation quality measured by the residual
  $\|\mathbb {Y}-\boldsymbol{\mathsf{A}}_\mu \mathbb {X}\|_F$ and the norm solution
  $\|\boldsymbol{\mathsf{A}}_\mu \|_F$. The minimization of
  $\|\boldsymbol{\mathsf{A}}_\mu \|_F$ should ensure that unneeded features will not appear in the regularized solution. When plotted on the log-log scale, the curve of optimal values
  $\mu \mapsto \|\boldsymbol{\mathsf{A}}_\mu \|_F$ versus the residual
 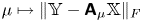 $\mu \mapsto \|\mathbb {Y}-\boldsymbol{\mathsf{A}}_\mu \mathbb {X}\|_F$ often takes on a characteristic L-shape (Aster et al. Reference Aster, Borchers and Thurber2019). A design of experiment with the test of different values of
  $\mu$ (starting, say, from
  $10^{-12}$ to
  $10^{-3}$) generally allows us to find quasi-optimal values of
  $\mu$ located at the corner of the L-curve, thus providing a good trade-off between the two criteria.
3.6. Reduced-order continuous dynamical system
Once the matrix  $\boldsymbol{\mathsf{A}}_\mu$ has been determined, we get the reduced-order continuous dynamical system
 $$\begin{gather} \dot{\boldsymbol{\alpha}} = \boldsymbol{\beta}, \end{gather}$$
 $$\begin{gather}\dot{\boldsymbol{\beta}} = \boldsymbol{\mathsf{A}}_\mu\, \boldsymbol{\beta} \end{gather}$$
with initial conditions  $\boldsymbol {\alpha }(0)=\boldsymbol {0}$,
  $\boldsymbol {v}(0)=\boldsymbol{\mathsf{Q}}^{\rm T}\,\varphi (\{\boldsymbol{0}\} )$. At any time
  $t$, one can go back to the high-dimensional physical space using the POD modes:
  $\{\boldsymbol{u}\}(t)=\boldsymbol{\mathsf{Q}}\,\boldsymbol {\alpha }(t)$,
  $\{\boldsymbol{x}\}(t)=\{ \boldsymbol{X}\} +\{\boldsymbol{u}\}(t)$,
  $\{\boldsymbol{v}\}(t)=\boldsymbol{\mathsf{Q}}\,\boldsymbol {\beta }(t)$. As already mentioned, the system can be written in condensed matrix form
 \begin{equation} \dot{\boldsymbol{w}} = \mathbb{A}_\mu\, \boldsymbol{w}, \end{equation}
where
 \begin{equation} \boldsymbol{w}(t)=(\boldsymbol{\alpha}(t),\boldsymbol{\beta}(t))^{\rm T}\quad {\rm and}\quad \mathbb{A}_\mu = \begin{pmatrix}[0]_K & \boldsymbol{\mathsf{I}}_K\\ [0]_K & \boldsymbol{\mathsf{A}}_\mu. \end{pmatrix}. \end{equation}
The exact analytical solution of (3.31) is
 \begin{equation} \boldsymbol{w}(t) = \exp(\mathbb{A}_\mu t)\,\boldsymbol{w}(0). \end{equation}
 The stability of the differential system depends on the spectral structure of  $\mathbb {A}_\mu$, or equivalently on the spectrum of
  $\boldsymbol{\mathsf{A}}_\mu$. Because of the stability of the fluid–capsule coupled system, and from accurate solutions of the FOM solver, one can hope that the solution
  $\boldsymbol{\mathsf{A}}_\mu$ of the least squares identification problem has the expected spectral properties. This will be studied and discussed in the numerical experimentation section. From the kinetic energy point of view, it is shown in Appendix B that the stability of the kinetic energy is linked to the property of the (real) spectrum of the symmetric matrix
  $(\boldsymbol{\mathsf{A}}_\mu +\boldsymbol{\mathsf{A}}_\mu ^{\rm T})/2$.
3.6.1. Model consistency with steady states
A steady state in our context is defined by a capsule that reaches a constant velocity  $\{\boldsymbol{v}\}_\infty$, so that the motion becomes a translation flow in time in the direction
  $\{\boldsymbol{v}\}_\infty$. From (3.1), this shows that
  $\boldsymbol {\beta }(t)$ also reaches a constant vector
  $\boldsymbol {\beta }_\infty$, and
  $\dot {\boldsymbol {\beta }} = 0$ at steady state. As a consequence, from (3.30), we get
  $\boldsymbol{\mathsf{A}}_\mu \boldsymbol {\beta }_\infty =0$, meaning that
  $0$ is an eigenvalue of
  $\boldsymbol{\mathsf{A}}_\mu$, with
  $\boldsymbol {\beta }_\infty$ as eigenvector. As a conclusion, the matrix
  $\boldsymbol{\mathsf{A}}_\mu$ must have zero in its spectrum in order to be consistent with the existence of steady states.
3.7. Reduced-order discrete dynamical system
Of course, it is also possible to derive a discrete dynamical system from the continuous one by using a standard time advance scheme. For example, the explicit forward Euler scheme with a constant time step  $\Delta t$ gives
 $$\begin{gather} \boldsymbol{\alpha}^{n+1} = \boldsymbol{\alpha}^n + \Delta t\, \boldsymbol{\beta}^n, \end{gather}$$
 $$\begin{gather}\boldsymbol{\beta}^{n+1} = \boldsymbol{\beta}^n + \Delta t\, \boldsymbol{\mathsf{A}}_\mu \boldsymbol{\beta}^n. \end{gather}$$
By multiplying (3.34) by  $\boldsymbol{\mathsf{Q}}$, we get the space–time approximate solution
 \begin{equation} \{\boldsymbol{u}\}^{n+1} = \{\boldsymbol{u}\}^n + \Delta t\, \{\boldsymbol{v}\}^n, \end{equation}
so the ROM is completely consistent with the kinematics equation. Stability properties of the discrete system are linked to the spectral properties of the matrix
 \begin{equation} \boldsymbol{\mathsf{A}}_\mu^\Delta = \begin{pmatrix} \boldsymbol{\mathsf{I}}_K & \Delta t\, \boldsymbol{\mathsf{I}}_K \\ [0]_K & (\boldsymbol{\mathsf{I}}_K+\Delta t\, \boldsymbol{\mathsf{A}}_\mu) \end{pmatrix}. \end{equation}
For unconditional stability in time, it is required for the eigenvalues of  $\boldsymbol{\mathsf{I}}_K+\Delta t\,\boldsymbol{\mathsf{A}}_\mu$ to stay in the unit disk of the complex plane.
More generally, it is possible to use any other time advance scheme, according to the expected order of accuracy or stability domain.
3.8. Accuracy criteria and similarity distances between ROM and FOM solutions
In order to quantify the error induced by approximations, we introduce three accuracy criteria. The first accuracy criterion is the relative information content (RIC), defined by
 \begin{equation} {RIC}(K) = \frac{\displaystyle{\sum_{k=K+1}^{\min(d,N)} \sigma_k^2}}{\displaystyle{\sum_{k=1}^{\min(d,N)}\sigma_k^2}}, \end{equation}
which quantifies the relative amount of neglected information when truncating the number of modes at rank  $K$. The truncation rank is determined such that the RIC is inferior to the accuracy threshold
  $\varepsilon$. The accuracy threshold
  $\varepsilon$ is fixed at
  $10^{-6}$.
The second accuracy criterion is the relative time residual  $\mathcal {R}$. It quantifies the relative error induced by the minimization of the least squares cost function (3.23) using
  $\boldsymbol{\mathsf{A}}_{\mu }$, and is given by
 \begin{equation} \mathcal{R}(j)=\frac{\Vert \boldsymbol{\mathsf{A}}_{\mu} \mathbb{X}_j-\mathbb{Y}_j \Vert^2}{\Vert \mathbb{Y}_j \Vert^2}, \end{equation}
where  $\mathbb {X}_j$ represents the
  $j$th column of
  $\mathbb {X}$, and
  $\mathbb {Y}_j$ the
  $j$th column of
  $\mathbb {Y}$. The index
  $j$ is thus linked to the snapshots (
 $j\in \{1,\ldots, N\}$). To better draw a parallel between the evolution of this parameter and the capsule dynamics, this parameter will be represented as a function of the non-dimensional time
  $Vt/\ell$ hereafter.
The third accuracy criterion,  $\varepsilon _{{Shape}}(Vt/\ell )$, measures the difference between the 3-D reference capsule shape given by the FOM (
 $\mathcal {S}_{{FOM}}$) and the 3-D shape predicted by the ROM (
 $\mathcal {S}_{{ROM}}$). It is defined at a given non-dimensional time
  $Vt/\ell$ as the ratio between the modified Hausdorff distance (MHD) computed between
  $\mathcal {S}_{FOM}$ and
  $\mathcal {S}_{ROM}$, and non-dimensionalized by
  $\ell$:
 \begin{equation} \varepsilon_{{Shape}}(Vt/\ell) =\frac{{MHD}(\mathcal{S}_{{FOM}}(Vt/\ell), \mathcal{S}_{{ROM}}(Vt/\ell))}{\ell}. \end{equation}
The MHD is the maximum value of the mean distance between  $\mathcal {S}_{{FOM}}$ and
  $\mathcal {S}_{{ROM}}$, and the mean distance between
  $\mathcal {S}_{{ROM}}$ and
  $\mathcal {S}_{{FOM}}$ (Dubuisson & Jain Reference Dubuisson and Jain1994).
4. Numerical experimentation on a given configuration
The method is first applied to a given configuration, in order to set the model parameters and to study its stability and precision. We consider the dynamics of an initially spherical capsule flowing in a microchannel when  $Ca=0.13$ and
  $a/\ell =0.8$. The time step between each snapshot
  $\Delta t$ equals 0.04. The dynamics predicted by the FOM is illustrated in figure 3 up to a non-dimensional time
  $VT/\ell =10$. As the capsule flows, its membrane is gradually deformed by the hydrodynamic forces inside the channel during a temporary time until a steady state is reached. We assume that the capsule has reached its steady-state shape when the surface area of the capsule varies by less than
  $5\times 10^{-4}\times (4 {\rm \pi}a^2)$ over a non-dimensional time
  $Vt/\ell =1$. For
  $Ca=0.13$,
  $a/\ell =0.8$, the steady state is reached at
  $VT_{SS}/\ell =6.2$ and is characterized by a parachute capsule shape (figure 3).
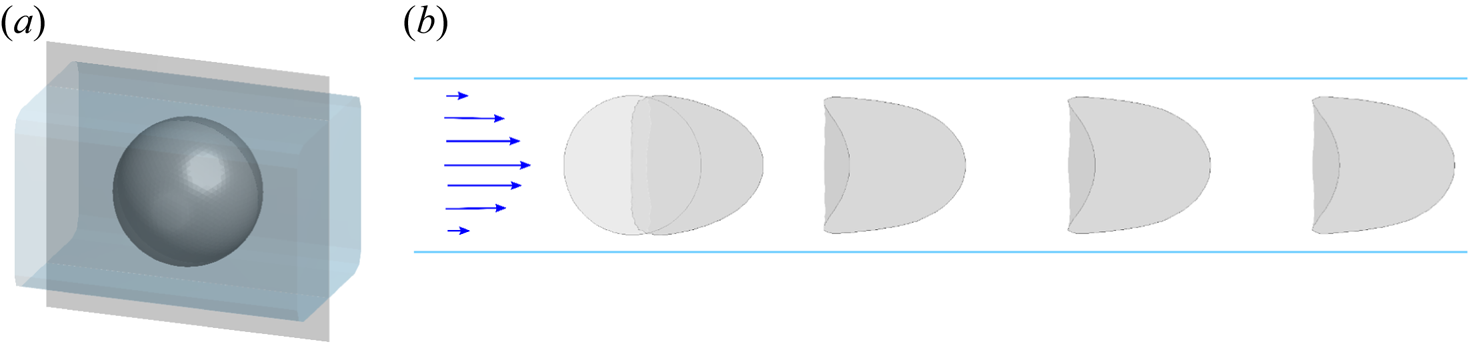
Figure 3. Dynamics of a microcapsule flowing in a microchannel with a square cross-section predicted by FOM in the vertical cutting plane represented in grey in (a). The in-plane capsule profiles are shown for  $Ca=0.13$ and
  $a/\ell =0.8$ at the non-dimensional times
  $Vt/\ell =$ 0, 0.4, 2, 4, 6 in (b). The horizontal lines in (b) represent the channel borders. The capsule will always be represented flowing from left to right.
4.1. Proper orthogonal decomposition, truncation and modes
The SVD is first applied to the displacement snapshot matrix. To determine the truncation rank, the evolution of  $1- RIC$ is illustrated in figure 4 as a function of number of modes considered. The RIC is approximately 1 % only with one mode. The more modes kept, the less information is neglected. In the following, we fix the number of modes to 20. The accuracy threshold
  $\varepsilon$ is thus equal to
  $10^{-6}$.
Figure 4. Evolution of the relative amount of neglected information  $1-RIC$, as a function of the number of modes (
 $Ca=0.13$,
  $a/\ell =0.8$).
The modes are determined from the displacement snapshot matrix. They are added to the sphere of radius 1 and amplified by a factor 2 to be visualized. The first six modes are represented in figure 5 for  $Ca=0.13$,
  $a/\ell =0.8$.

Figure 5. Representation of the first six modes of the capsule dynamics when  $a/\ell =0.80$ and
  $Ca=0.13$. To be visualized, the modes of displacement were added to the sphere of radius 1 and amplified by a factor 2.
The first six modes are mostly dedicated to changing the shape of the rear of the capsule. The following modes appear to become noisy (not shown). However, these modes are not negligible if one wants to get an accuracy of  $10^{-6}$.
4.2. Dynamic mode decomposition: empirical regularization
Before determining the matrix  $\boldsymbol{\mathsf{A}}$, we check the condition numbers of the matrices
  $\mathbb {X}$ and
  $\mathbb {XX}^{\rm T}$. They are respectively equal to
  $6.5\times 10^4$ and
  $4.3 \times 10^9$. The condition numbers of these matrices are very high, and the matrix
  $\boldsymbol{\mathsf{A}}$, determined by solving (3.26), may be sensitive to perturbations or noise. To improve the robustness, a Tikhonov regularization is applied to solve the least squares problem (3.23), and the matrix
  $\boldsymbol{\mathsf{A}}_{\mu }$ is computed using (3.28), which depends on the regularization coefficient
  $\mu$. To determine the optimal value of
  $\mu$, the relative least squares error
  $\Vert \boldsymbol{\mathsf{A}}_{\mu }\mathbb {X}-\mathbb {Y}\Vert _F/\Vert \mathbb {Y}\Vert _F$ is represented according to the norm solution
  $\Vert \boldsymbol{\mathsf{A}}_{\mu }\Vert _F$ when 20 modes are considered and when
  $\mu$ is varied between
  $10^{-12}$ and
  $10^{-3}$ (figure 6). The least squares error
  $\Vert \boldsymbol{\mathsf{A}}_{\mu }\mathbb {X}-\mathbb {Y}\Vert _F$ and the norm solution
  $\Vert \boldsymbol{\mathsf{A}}_{\mu }\Vert _F$ are minimal when
  $\mu =10^{-9}$. In the following,
  $\mu$ is thus fixed to
  $\mu =10^{-9}$ and the number of modes to 20.

Figure 6. Evolution of the norm solution  $\Vert \boldsymbol{\mathsf{A}}_{\mu }\Vert _F$ as a function of the least squares error
  $\Vert \boldsymbol{\mathsf{A}}_{\mu }\mathbb {X}-\mathbb {Y}\Vert _F / \Vert \mathbb {Y}\Vert _F$ when the number of modes is fixed to 20 and
  $(Ca=0.13, a/\ell =0.8)$.
4.3. Validity check of the ROM: spectral study of the resulting matrix
In order to detect anomalies, a spectral analysis of the ROM learned by the DMD method is carried out. The spectrum of the matrix  $\boldsymbol{\mathsf{A}}_{\mu }$ is represented in figure 7. All the eigenvalues
  $\lambda _k$ of the matrix
  $\boldsymbol{\mathsf{A}}_{\mu }$ have non-positive real parts. The resulting linear ROM is thus stable.

Figure 7. Eigenvalues  $\lambda _k$ of
  $\boldsymbol{\mathsf{A}}_{\mu }$ (
 $Ca=0.13$,
  $a/\ell =0.8$, 20 modes,
  $\mu =10^{-9}$). Note that the maximum real part of the eigenvalues is exactly equal to zero.
The temporal evolution of the residual  $\mathcal {R}$ (figure 8) shows that the error is less than 0.7 %. The maximal value is reached at the beginning of the simulation (
 $Vt/\ell < 0.3$), and
  $\mathcal {R}$ decreases afterwards. When
  $Vt/\ell \lesssim 6$, i.e. before the capsule has reached its steady state, high-frequency oscillations are observed. This probably means that a high-frequency mode is neglected, even if 20 modes are considered. For
  $Vt/\ell >6$,
  $\mathcal{R}$ is of order
  $10^{-7}$. The stationary state is thus well predicted by the model, and the error during the transient stage is more than acceptable.

Figure 8. Temporal evolution of the normalized time residual with  $Ca=0.13$,
  $a/\ell =0.8$, 20 modes and
  $\mu =10^{-9}$.
4.4. ROM online stage and accuracy assessment
The displacement of all the nodes of the capsule mesh estimated by the ROM is then added to the corresponding node of the sphere of radius 1 to visualize the temporal evolution of the capsule shape in three dimensions. Figure 9 shows the capsule dynamics for the reference case ( $Ca=0.13$,
  $a/\ell =0.8$). The ROM allows us to reproduce the capsule deformation from the initial state up to the parachute-shaped steady state. For the FOM and the ROM, the capsule profile is then determined in the cutting plane passing through the middle of the microchannel. Figure 10 shows that the two capsule profiles overlap perfectly at
  $Vt/\ell =0, 0.4, 2, 4, 6$. The temporal evolution of
  $\varepsilon _{{Shape}}$ is shown in figure 11(a). The maximum value of the error committed on the 3-D shape
  $\varepsilon _{{Shape}}$ equals 0.004 %. The error on the capsule shape
  $\varepsilon _{{Shape}}$ is thus negligible. The deformation of the capsule from its initially spherical shape to its steady state over a non-dimensional time
  $Vt/\ell =10$ can thus be estimated very precisely with the developed ROM.

Figure 9. Dynamics of a microcapsule flowing in microchannel with a square cross-section predicted by the ROM at the non-dimensional times  $Vt/\ell = 0.4$, 2.8, 5.2, 7.6, 10, with
  $Ca=0.13$,
  $a/\ell =0.8$, 20 modes and
  $\mu =10^{-9}$. The initial spherical capsule is shown on the left by transparency.

Figure 10. Comparison of the capsule contours given by the FOM (dotted line) and estimated by the ROM (orange line). The capsule is shown for  $Ca=0.13$,
  $a/\ell =0.8$ at the non-dimensional times
  $Vt/\ell = 0$, 0.4, 2, 4, 6. The horizontal lines represent the channel borders. The number of modes is fixed at 20, and
  $\mu =10^{-9}$.

Figure 11. (a) Comparison of the capsule contours given by the FOM (dotted line) and estimated by the ROM (orange line) for the different learning times  $VT_{L}/\ell$. (b) Evolution of
  $\varepsilon _{{Shape}}$ measured at
  $Vt/\ell =10$ as a function of the learning time
  $VT_{L}/\ell$. (c) Influence of the learning time
  $VT_{L}/\ell$ on the temporal evolution of the error on the capsule shape
  $\varepsilon _{{Shape}}$. The error during the learning time is shown with a solid line. For this case, the parameters are 20 modes,
  $\mu =10^{-9}$,
  $Ca = 0.13$ and
  $a/\ell =0.8$.
The DMD method predicts the capsule displacement at time  $t^{n+1}$ from that at time
  $t^n$. The model has been constructed until now by considering the dynamics of the capsule over a non-dimensional time
  $Vt/\ell =10$.
In order to study the sensitivity of the ROM to the learning time  $VT_{L}/\ell$, i.e. the non-dimensional time over which the model is trained, we modify it with values between 2 and 8, knowing that the time to reach the steady state is in this case
  $VT_{SS}/\ell =6.2$. We estimate the capsule dynamics using the ROM up to a non-dimensional time
  $Vt/\ell =10$. The number of modes is always equal to 20, and
  $\mu =10^{-9}$. The comparison of the estimated shape at
  $Vt/\ell =10$ with the one simulated with the FOM (figure 11a) shows that
  $VT_{L}/\ell \geq 4$ is sufficient to predict very well the capsule dynamics. Figure 11(b) confirms that the error on the capsule shape is negligible when
  $VT_{L}/\ell \geq 4$. It is interesting that the ROM could predict the steady state even when
  $T_L < T_{SS}$. This could be due to the fact that the maximum real part of the eigenvalues is exactly equal to zero from
  $VT_{L}/\ell \geq 4$. The maximum real part of the eigenvalues is negative and close to zero for
  $VT_{L}/\ell =2$. Figure 11(c) shows that in the worst case (
 $VT_{L}/\ell =2$), the error on the capsule shape increases with time but reaches a plateau from time
  $Vt/\ell =8$. The system is thus stable without exponential drift, as proven by the negative value of the maximum real eigenvalue. In the inset, the error also increases for the other learning times but remains very small (below 0.2 %).
5. Space–time ROM accuracy assessment over the full parameter sample set
The capillary number  $Ca$ and the size ratio
  $a/\ell$ are now considered as variable parameters. A database of 119 simulations of the deformation of an initially spherical capsule in a microchannel has been generated using the FOM with the same time step and mesh size as in § 4. Figure 12(a) shows the different values of
  $Ca$ and
  $a/\ell$ for which the simulations have been computed to create the training database. When the capsule initial radius is close to or larger than the microchannel cross-dimension (
 $a/\ell \geq 0.90$), the capsule is pre-deformed into a prolate spheroid to fit in the channel. For a given
  $a/\ell$, a limit value of
  $Ca$ exists beyond which a capsule does not reach a steady state (figure 12). This is due to the softening behaviour of the neo-Hookean law.

Figure 12. (a) Values of  $Ca$ and
  $a/\ell$ included in the training database. (b) Evolution of the time
  $VT_{SS}/\ell$ needed to reach the steady state, on the training database. The dashed line delimits the domain where a steady-state capsule deformation exists for capsules following the neo-Hookean law.
For the following, we have considered a learning time  $VT_L/\ell =10$. The evolution of the time
  $VT_{SS}/\ell$ needed to reach the steady state is illustrated in figure 12(b) on the whole training database. The steady state is reached on average at a time
  $VT_{SS}/\ell =6.2$. However, we notice that for the cases close to the steady-state limit,
  $VT_{SS}/\ell$ increases and exceeds the considered learning time.
For all the couples  $(Ca, a/\ell )$ of the training database, the capsule shape is reconstructed from the ROM results at given non-dimensional times, and compared to the shape predicted by the FOM at the same non-dimensional time. The evolution of the error committed on the capsule shape
  $\varepsilon _{Shape}$ on the full database is illustrated in figure 13 at
  $Vt/\ell =0, 0.4, 1, 2, 5, 10$. Here,
  $\varepsilon _{Shape}$ is null at
  $Vt/\ell =0$. The ROM is therefore able to predict the initial capsule shape correctly, whether it is spherical or slightly ellipsoidal. Until
  $Vt/\ell \leq 2$,
  $\varepsilon _{Shape}$ essentially remains zero on the majority of the database. Otherwise, it is equal to 0.15 % at maximum. At
  $Vt/\ell = 5$ and 10, the error
  $\varepsilon _{Shape}$ increases slightly for most of the couples
  $(Ca, a/\ell )$ of the database. It remains fully acceptable since it is equal to 0.35 % at maximum. When considering 20 modes and
  $\mu = 10^{-9}$, the developed ROM allows us to estimate with great precision the dynamics of an initially spherical capsule in a microchannel with a square cross-section.

Figure 13. Heat maps of  $\varepsilon _{Shape}$ on the training database as functions of
  $Ca$ and
  $a/\ell$ at
  $Vt/\ell$ values (a) 0, (b) 0.4, (c) 1, (d) 2, (e) 5, ( f) 10 (obtained with 20 modes and
  $\mu =10^{-9}$). The dashed line delimits the domain where a steady-state capsule deformation exists.
To respect the stability condition (see (2.15)), the time step imposed to simulate the capsule dynamics with the FOM decreases, when  $Ca$ decreases. The lower
  $Ca$, the longer the simulation lasts (figure 2). The time needed to calculate the capsule shape and write the results was estimated on the same workstation used to simulate and generate the result files with the FOM (2-CPU Intel
![]() Xeon
Xeon![]() Gold 6130, 2.1 GHz). The speedup is the ratio between the FOM runtime and the ROM runtime. Its evolution according to the FOM time step is illustrated in figure 14. It was estimated from the ROM and FOM simulation time obtained when
Gold 6130, 2.1 GHz). The speedup is the ratio between the FOM runtime and the ROM runtime. Its evolution according to the FOM time step is illustrated in figure 14. It was estimated from the ROM and FOM simulation time obtained when  $a/\ell =0.7$. The speedup varies between 52106 for a FOM time step
  $10^{-4}$ (i.e for the lowest value of
  $Ca$ tested) and 4200 for
  $5 \times 10^{-4}$ (i.e
  $Ca\geq 0.05$). It is thus possible to estimate the capsule dynamics very precisely with the developed ROM, while reducing the computational time considerably.

Figure 14. Evolution of the speedup as function to the time step imposed to simulate the capsule dynamics with the FOM ( $a/\ell =0.7$).
Another significant advantage is the gain in storage of the simulation results. By storing only the reduced variables  $\boldsymbol {\alpha },\boldsymbol {\beta }$, the modes
  $\{ \boldsymbol{\phi}_k\}$ and the initial position of the nodes of each couple
  $\boldsymbol{\theta} =(Ca,a/\ell )$, the training database is reduced from 1.9 GB, when computed with the FOM, to 0.15 GB with the ROM. It can therefore be shared more easily.
6. Full space–time parameter ROM (for any admissible parameter value)
6.1. General methodology
It is here again assumed that a training database of  $N$ pre-computed FOM results is available. Now we would like to derive a ROM for any parameter couple
  $\boldsymbol {\theta }=(Ca,a/\ell )$ in the admissible parameter domain. The proposed space–time-parameter ROM is made of two steps. The first step consists in predicting the space–time solution
  $\{\boldsymbol {u}\}(t;\boldsymbol {\theta })$ by means of a robust interpolation procedure. The second step consists in deriving a ROM in the form of a low-order dynamical system by using the predicted solutions of the first step as training data. Then we apply the former procedure detailed in § 3. Below, we give a detailed explanation of the two steps.
6.1.1. Step 1: predictor step
Considering a parameter couple  $\boldsymbol {\theta }$, we first search the three nearest neighbour parameters in the sample set that form a non-degenerate triangle in the plane
  $(Ca,a/\ell )$. Let us denote them by
  $\boldsymbol {\theta }_1$,
  $\boldsymbol {\theta }_2$ and
  $\boldsymbol {\theta }_3$. We will define a linear operator in the triangle
  $(\boldsymbol {\theta }_1,\boldsymbol {\theta }_2,\boldsymbol {\theta }_3)$. For that, let us introduce the barycentric coordinates
  $(\lambda _1,\lambda _2,\lambda _3)$,
  $\lambda \in [0,1]$,
  $i=1,2,3$, such that
 $$\begin{gather} \lambda_1 + \lambda_2 + \lambda_3 = 1, \end{gather}$$
 $$\begin{gather}\boldsymbol{\theta}_1 \lambda_1 + \boldsymbol{\theta}_2 \lambda_2 + \boldsymbol{\theta}_3\lambda_3 = \boldsymbol{\theta}. \end{gather}$$
The  $3\times 3$ linear system (6.1) and (6.2) is invertible as soon as the triangle
  $(\boldsymbol {\theta }_1,\boldsymbol {\theta }_2,\boldsymbol {\theta }_3)$ is non-degenerate. Notice that the
  $\lambda _i$ (
 $i=1,2,3$) are actually functions of
  $\boldsymbol {\theta }$. Let us now denote by
  $\{\boldsymbol{u}_1\}$,
  $\{\boldsymbol{u}_2\}$ and
  $\{\boldsymbol{u}_3\}$ the displacement fields for the parameter vectors
  $\boldsymbol {\theta }_1$,
  $\boldsymbol {\theta }_2$ and
  $\boldsymbol {\theta }_3$, respectively. Then we can consider the predicted velocity field
  $\hat {\boldsymbol {u}}(t;\boldsymbol {\theta })$ defined by
 \begin{equation} \{\hat{\boldsymbol{u}}\}(t,\boldsymbol{\theta}) = \lambda_1 \{\boldsymbol{u}_1\}(t) + \lambda_2 \{\boldsymbol{u}_2\}(t) + \lambda_3 \{\boldsymbol{u}_3\}(t). \end{equation}
6.1.2. Step 2: low-order dynamical system ROM
Expression (6.3) can be evaluated at some discrete instants in order to generate new training data. Then the SVD-DMD ROM methodology presented in § 3 can be applied to these data to get a reduced dynamical system in the form
 $$\begin{gather} \dot{\boldsymbol{\alpha}}(\boldsymbol{\theta}) = \boldsymbol{\beta}(\boldsymbol{\theta}), \end{gather}$$
 $$\begin{gather}\dot{\boldsymbol{\beta}}(\boldsymbol{\theta}) = \boldsymbol{\mathsf{A}}_\mu(\boldsymbol{\theta})\, \boldsymbol{\beta}(\boldsymbol{\theta}). \end{gather}$$
 We also have a matrix  $\boldsymbol{\mathsf{Q}}(\boldsymbol {\theta })$ of orthogonal POD modes, and we can go back to the high-dimensional physical space by the standard operations
 \begin{equation} \{\hat{\boldsymbol{u}}\}(t,\boldsymbol{\theta}) \approx \boldsymbol{\mathsf{Q}}(\boldsymbol{\theta})\, \boldsymbol{\alpha}(t,\boldsymbol{\theta}),\quad \{\hat{\boldsymbol{v}}\}(t,\boldsymbol{\theta}) \approx \boldsymbol{\mathsf{Q}}(\boldsymbol{\theta})\, \boldsymbol{\beta}(t,\boldsymbol{\theta}). \end{equation}
Notice that the capsule position field  $\{\boldsymbol {x}\}(t,\boldsymbol {\theta })$ is given by
 \begin{equation} \{ \boldsymbol{x}\}(t;\boldsymbol{\theta}) = \{\boldsymbol{X}\}(\boldsymbol{\theta}) + \{\hat {\boldsymbol{u}}\}(t,\boldsymbol{\theta}), \end{equation}
with an initial capsule position  $\{\boldsymbol{X}\}(\boldsymbol {\theta })$ that may depend on
  $\boldsymbol {\theta }$ because of the pre-deformation pre-processing if
  $a/\ell \geq 0.90$.
A testing database is created using the FOM as in § 5 and considering  $(Ca,a/\ell )$ couples that are not in the training database. A set of 110
  $(Ca,a/\ell )$ couples are included in this database (figure 15). For all the
  $(Ca,a/\ell )$ couples of the testing database, the capsule dynamics is interpolated from the dynamics of the three closest neighbours at a given non-dimensional time. Capsule shapes obtained by the ROM are compared to the ones predicted by the FOM at the same non-dimensional time. Figure 16 represents the evolution of the error committed on the capsule shape
  $\varepsilon _{Shape}$ on the training database at
  $Vt/\ell =0, 0.4, 1, 2, 5, 10$. At the initial time,
  $\varepsilon _{{Shape}}$ is zero. The interpolation method is therefore able to capture the initial capsule shape. When the time increases,
  $\varepsilon _{{Shape}}$ increases and is greater than if we apply directly the POD-DMD method on the FOM results and reconstruct the dynamics. However,
  $\varepsilon _{{Shape}}$ remains less than 0.3 % on the majority of the testing database. It remains fully acceptable. Here,
  $\varepsilon _{{Shape}}$ is more important near the steady-state limit and when we approach the lowest values of
  $Ca$ because we are close to the limits of the training base.

Figure 15. Values of  $Ca$ and
  $a/\ell$ included in the testing database (open circles). The filled squares represent the cases in the training database. The dashed line delimits the domain where a steady-state capsule deformation exists for capsules following the neo-Hookean law.

Figure 16. Heat maps of  $\varepsilon _{{Shape}}$ on the testing database as functions of
  $Ca$ and
  $a/\ell$ at
  $Vt/\ell$ values (a) 0, (b) 0.4, (c) 1, (d) 2, (e) 5, ( f) 10. The dashed line delimits the domain for which a steady-state capsule deformation exists.
7. Application of the ROM to a capsule in simple shear flow
To prove the generality of the proposed approach, we additionally apply the ROM to a capsule in simple shear flow. This classical case has been studied extensively over the past years (Ramanujan & Pozrikidis Reference Ramanujan and Pozrikidis1998; Lac & Barthès-Biesel Reference Lac and Barthès-Biesel2005; Li & Sarkar Reference Li and Sarkar2008; Barthès-Biesel, Walter & Salsac Reference Barthès-Biesel, Walter and Salsac2010; Walter et al. Reference Walter, Salsac, Barthès-Biesel and Le Tallec2010; Foessel et al. Reference Foessel, Walter, Salsac and Barthès-Biesel2011; Dupont et al. Reference Dupont, Salsac, Barthès-Biesel, Vidrascu and Le Tallec2015). The FOM results of an initially spherical capsule subjected to a shear rate  $\dot {\gamma }$ are simulated using the unconfined version of the boundary integral/finite element method presented in § 2 (see Walter et al. (Reference Walter, Salsac, Barthès-Biesel and Le Tallec2010) for a detailed description of the method). The time step
  $\Delta t$ between each snapshot is equal to 0.04.
We first build a ROM that predicts the capsule dynamics until  $\dot {\gamma }t=10$ with 15 modes, learning time
  $\dot {\gamma }T_L=10$ and
  $\mu =10^{-6}$. We retrieve that the initial spherical capsule elongates under the effect of the external flow in the straining direction and that the membrane rotates around the deformed shape due to the flow vorticity (figure 17). The ROM is thus able to recover the tank-treading motion. Very good agreement between the ROM and FOM is seen in figure 18 for the capsule profiles in the shear and perpendicular planes. Figure 19 shows the evolution of the maximum error on the capsule shape for different values of
  $Ca$. At
  $Ca=0.1$, the ROM predicts well the time evolution of the global capsule shape but not precisely the wrinkle formation, leading to 2 % error on average. But from
  $Ca\geq 0.3$, the error is reduced by an order of magnitude and is below 0.2 %.

Figure 17. Snapshots of a capsule subjected to a simple shear flow estimated by the ROM ( $Ca=0.3$, 15 modes and
  $\mu =10^{-6}$), for
  $\dot {\gamma }t$ values (a) 0, (b) 1.6, (c) 4.8, (d) 6.4. A red point is placed on the membrane to visualize the tank-treading motion.

Figure 18. Capsule subjected to a simple shear flow for  $Ca=0.3$: comparison of the contours in the shear and cross planes given by the FOM (dotted line) and estimated by the ROM (orange line, obtained with 15 modes and
  $\mu =10^{-6}$).

Figure 19. Evolution of the maximum error committed on the shape of a capsule subjected to a simple shear flow as a function of the capillary number  $Ca$ (obtained with 15 modes and
  $\mu =10^{-6}$). The capsule dynamics was simulated up to a non-dimensional time
  $\dot {\gamma } t=10$.
We then perform some tests to be sure that the model is able to predict the tank-treading motion correctly after the learning time. Since the period is equal to 17.6 for  $Ca=0.3$, the learning time
  $T_L=10$ appears to be too short to capture the periodical motion. We consider a (safe) learning time
  $T_L=20$ and increase the number of modes to 60 to capture the Lagrangian motion of the mesh along the capsule (Eulerian) steady shape. This convection-dominated motion of the capsule is known to be an unfavourable condition for dimensionality reduction, and this is the reason why it is adequate to increase the number of modes. We have obtained the best trade-off between accuracy, numerical conditioning and complexity using 60 modes.
The error on the 3-D shape  $\varepsilon _{{Shape}}$, represented in figure 20(a), does not exceed 2 %. Indeed, after a quasi-monotonic increase, it reaches value 1.7 at the end of the learning time (
 $\dot {\gamma }t\leq 20$) and remains almost constant during the extended prediction time (
 $20< \dot {\gamma }t\leq 30$). This is very comforting for long-time stability and accuracy of the simulation. Furthermore, we study the spectral structure of the matrix
  $\boldsymbol{\mathsf{A}}_{\mu }$ and plot its eigenvalues in the complex plane in figure 20(b). All the eigenvalues have non-positive real parts, showing the asymptotic stability property of the dynamical system.

Figure 20. (a) Evolution of the error committed on the shape of a capsule subjected to a simple shear flow during the learning time (solid line) and the extended prediction time (dotted line). (b) Representation of the eigenvalues of  $\boldsymbol{\mathsf{A}}_{\mu }$ when 60 modes,
  $\mu =10^{-6}$ and
  $Ca=0.3$ are considered.
One may still wonder whether the DMD ROM is accurate only for capsule flows that converge towards a steady state. To answer the question, we have investigated the feasibility of applying the method to an initially ellipsoidal capsule in simple shear flow. Depending on the parameters, such a capsule exhibits a variety of dynamical regimes, which are periodical in many cases (Walter, Salsac & Barthès-Biesel Reference Walter, Salsac and Barthès-Biesel2011; Dupont, Salsac & Barthès-Biesel Reference Dupont, Salsac and Barthès-Biesel2013; Dupont et al. Reference Dupont, Delahaye, Barthès-Biesel and Salsac2016). We apply the ROM to the full dataset of FOM simulations for the same initial capsule. It is thus a case where the ergodicity hypothesis cannot be applied to improve the filling of the state space (see Tu et al. Reference Tu, Rowley, Luchtenburg, Brunton and Kutz2014).
At large  $Ca$, when the capsule exhibits a fluid-like behaviour, a large number of modes are required to capture the membrane rotation around the deformed shape. When the capsule behaves like a solid particle at low
  $Ca$ and exhibits a tumbling motion, it is preferable to place the capsule within its own reference frame before applying the ROM method. The error is typically of a few per cent, and the capsule motion is well reproduced. An example of the tumbling dynamics predicted by the ROM is compared to that simulated by the FOM in figure 21. The ROM is able to reproduce more complex capsule dynamics (e.g. with periodical motion) and to capture deformation features, including wrinkles, all this with a speedup of approximately 35 000.

Figure 21. Tumbling motion of a prolate capsule ( $\text {aspect ratio}=2$) subjected to a simple shear flow (
 $Ca=0.1$). (a) Comparison of the 3-D shape given by the FOM (in grey) and estimated by the ROM (in orange, obtained with 50 modes and
  $\mu =10^{-6}$). Comparison of the two-dimensional profile (b) in the shear plane, and (c) in the cross plane. The time step
  $\Delta t$ between each snapshot is equal to 0.04.
8. Discussion and conclusion
As a summary, in this paper we have considered a  $\boldsymbol {\theta }$-parametrized ROM of microcapsule dynamics in the form
 $$\begin{gather} \dot{\boldsymbol{\alpha}}(\boldsymbol{\theta}) = \boldsymbol{\beta}(\boldsymbol{\theta}), \end{gather}$$
 $$\begin{gather}\dot{\boldsymbol{\beta}}(\boldsymbol{\theta}) = \boldsymbol{\mathsf{A}}_\mu(\boldsymbol{\theta})\, \boldsymbol{\beta}(\boldsymbol{\theta}). \end{gather}$$
The vector  $\boldsymbol {\theta }=(Ca,a/\ell )$ contains the governing parameters, the coefficients
  $\alpha _k(t,\boldsymbol {\theta })$ and
  $\beta _k(t,\boldsymbol {\theta })$ are spectral coefficients of POD decomposition for the displacement and velocity fields, respectively, and the matrix
  $\boldsymbol{\mathsf{A}}_\mu (\boldsymbol {\theta })$ is identified from data using a dynamic mode decomposition least squares procedure. We have proven numerically for a broad range of capillary numbers
  $Ca$ and size ratios
  $a/\ell$ that it is able to capture the dynamics up to the steady state of a capsule flowing in a channel and its large deformations. As a first approach, we have presently chosen to use a DMD method that is linear in time to build the ROM. Still, the ROM captures spatial nonlinearity by means of the POD modes. The resulting ROM is of great fidelity, weak discrepancies being observed only in the early transient stage. We have also shown that the learning time needs to be larger than the transient stage duration, and that we can go beyond the FOM time window used for the training of the ROM.
For generalization, we have computed the capsule dynamics for any parameter set. The generalization algorithm is based on interpolation: we first pre-calculate the ROM dynamic model at a finite number of points in the parameter space domain, and determine  $\alpha$,
  $\beta$ and
  $\boldsymbol{\phi}_k$ (and thus the capsule displacement) at these points. For any other value of the parameters, we first predict the time evolution of the capsule node displacements using a linear interpolation procedure in the parameter space, and then build a dynamical system based on the DMD methodology. The error is mostly below 0.3 % over the entire domain, which proves the precision and utility of the ROM approach.
Like any other data-driven model, the model requires a certain number of HF simulations to provide accurate predictions. By discretizing the parameter space in a regular and homogeneous way (figure 12), we have not presently tried to optimize the number of FOM simulations. But sampling strategies like Latin hypercube sampling exist and result in a net reduction in FOM simulation number. The empirical law, conventional among the data-driven model community, is that one needs between  $10\times D$ and
  $50 \times D$ points, where
  $D$ is the dimension of the problem (
 $D = 2$ in our case). This law shows that the number of HF simulations does not explode with the problem dimension, owing to the linear dependence of the law.
The linear differential model is stable as soon as the eigenvalues of  $\boldsymbol{\mathsf{A}}_\mu$ have non-positive real parts, and is consistent with steady states as soon as zero is an eigenvalue. Numerical experiments show that identified matrices
  $\boldsymbol{\mathsf{A}}_\mu$ from data have eigenvalues with negative real parts, and one of the eigenvalues is very close to zero.
As is often the case with spectral-like methods, there is a trade-off between accuracy and ill-conditioning effects: when a large number of POD modes are used ( $K>20$), the data matrix
  $\mathbb {X}$ of snapshot POD coefficients is ill-conditioned. For the determination of
  $\boldsymbol{\mathsf{A}}_\mu$, we have used a Tikhonov regularization in the least squares cost function (see (3.27)) in order to have a better-conditioned problem and an L-curve procedure to determine the best regularization coefficient
  $\mu$. Unfortunately, we observe some limitations in the accuracy. A perspective would be to use a proximal approach: within an iterative procedure, at iteration
  $(p+1)$, compute the matrix
  $\boldsymbol{\mathsf{A}}_\mu ^{(p+1)}$ solution of
 \begin{equation} \boldsymbol{\mathsf{A}}_\mu^{(p+1)} = \arg \min_{A\in\mathscr{M}_K(\mathbb{R})}\ \frac{1}{2}\, \|\mathbb{Y}-\boldsymbol{\mathsf{A}}\mathbb{X}\|_F^2 + \frac{\mu}{2}\,\|\mathbb{X}\|_F^2\, \|\boldsymbol{\mathsf{A}}-\boldsymbol{\mathsf{A}}_\mu^{(p)}\|_F^2 \end{equation}
using  $\boldsymbol{\mathsf{A}}_\mu ^{(0)}=0$. At convergence, one can observe that the regularization term vanishes, so that one can expect better accuracy with this approach. This will be investigated in a future work.
We have proposed a successful and very efficient ROM for FSI problems. It is an alternative to the use of high-performance computing. It must be seen as a complementary (and non-competing) approach to full-order models, and has many advantages. Among them, one can mention the ease of implementation. It leads to a very handy set of ODEs that are easy to determine from an algorithmic point of view. Furthermore, the system can be run on any computer. The size of the matrices is, indeed, reduced from ( $3 \times 2562 \text { nodes} \times 250 \text { snapshots}$) to approximately (
 $3 \times 2562 \text { nodes} \times (K+1)$), where the number of modes is
  $K = 20$. The computation required time is a few milliseconds for one parameter set. The current speedups are between 5000 and 52 000, which out-performs any full-order model approach. We believe that this work is an encouraging milestone to move towards real-time simulation of general coupled problems and to deal with high-level parametric studies, sensitivity analysis, optimization and uncertainty quantification.
The next milestone following this work would be to go towards nonlinear differential dynamical systems as ROMs. There are three natural ways to do that. The first is to use kernel dynamic model decomposition rather than DMD. But we have shown recently in De Vuyst, Dupont & Salsac (Reference De Vuyst, Dupont and Salsac2022) that a nonlinear low-order dynamical model does not provide significant improvement. The second way is to use extended dynamic model decomposition (EDMD) (Williams, Kevrekidis & Rowley Reference Williams, Kevrekidis and Rowley2015). The EDMD method adds some suitable nonlinear observables (or features) in the data, so that a linear ‘augmented’ dynamical system is searched for. A third option would be to use artificial neural networks directly, in particular recurrent neural networks (RNNs) (Trischler & D'Euleuterio Reference Trischler and D'Euleuterio2016). The RNN training would replace the DMD procedure, and would be trained with the same POD coefficient matrices  $\mathbb {X}$ and
  $\mathbb {Y}$. As shown in the recent study by Lin et al. (Reference Lin, Wang, Wang and Sui2021), artificial intelligence may prove to be efficient and precise to predict capsule deformation.
Acknowledgements
The authors warmly thank Professor P. Villon for fruitful discussions on model-order reduction and related topics.
Funding
This project has received funding from the European Research Council (ERC) under the European Union's Horizon 2020 research and innovation programme (grant agreement no. ERC-2017-COG – MultiphysMicroCaps).
Declaration of interests
The authors report no conflict of interest.
Author contributions
A.-V.S. and F.D.V. created the research plan and formulated the numerical problem. C.D. implemented the numerical method and performed the tests. All authors contributed to analysing data and reaching conclusions, and in writing the paper.
Appendix A. Effects of time derivative discretization on matrix estimation
In § 3.4, we explain how to identify the coefficient matrix  $\boldsymbol{\mathsf{A}}$ from a least squares problem that tries to minimize the squared residual
  ${\int _0^{T}\|\dot {\boldsymbol {\beta }}(t)-\boldsymbol{\mathsf{A}}\, \boldsymbol {\beta }(t)\|^2\,{\rm d}t}$. For practical reasons and because of a finite amount of data, we have to discretize the functional and in particular the time derivatives by means of finite differences. This section is dedicated to the analysis of the effect of discretization on the estimation on
  $\boldsymbol{\mathsf{A}}$, and in particular on the effect on the spectrum of
  $\boldsymbol{\mathsf{A}}$ and the impact on the stability of the identified model.
The notations here are specific to this appendix. Suppose that we have a reference linear dynamical system whose equations and initial data are
 \begin{equation} \dot {\boldsymbol{v}} = \boldsymbol{\mathsf{A}}^{ref}\boldsymbol{v},\ t\in[0,T],\quad \boldsymbol{v}(0)=\boldsymbol{v}^0\in\mathbb{R}^K, \end{equation}
where  $\boldsymbol{\mathsf{A}}^{ref}\in \mathscr {M}_K(\mathbb {R})$. The solution to the differential problem is given by
  $\boldsymbol {v}(t)=\exp (\boldsymbol{\mathsf{A}}^{ref}t)\,\boldsymbol {v}^0$,
  $t\in [0,T]$. Suppose that we do not know
  $\boldsymbol{\mathsf{A}}^{ref}$ but we have access to the exact solutions
  $\boldsymbol {v}^n=\boldsymbol {v}(t^n)$ at discrete times
  $t^n=n\,\Delta t$,
  $n\in \{ 0,\ldots,N\}$, where
  $\Delta t=T/N$. The
  $(\boldsymbol {v}^n)_n$ will be used as data for the identification (estimation) of the matrix
  $\boldsymbol{\mathsf{A}}^{ref}$. Consider the least squares minimization problem
 \begin{equation} \min_{\boldsymbol{\mathsf{A}}\in\mathscr{M}_K(\mathbb{R})} \frac{1}{2}\sum_{i=0}^{N-1} \left\|\frac{\boldsymbol{v}^{n+1}-\boldsymbol{v}^n}{\Delta t}-\boldsymbol{\mathsf{A}} \boldsymbol{v}^n\right\|^2. \end{equation}
Since  $\boldsymbol {v}^n=\exp (\boldsymbol{\mathsf{A}}^{ref}n\Delta t)\boldsymbol {v}^0$ for all
  $n$, we have also
  $\boldsymbol {v}^{n+1}-\boldsymbol {v}^n = \exp (\boldsymbol{\mathsf{A}}^{ref}\Delta t)\,\boldsymbol {v}^n$. So (A2) is equivalent to
 \begin{align} \min_{\boldsymbol{\mathsf{A}}\in\mathscr{M}_K(\mathbb{R})} \frac{1}{2}\sum_{i=0}^{N-1} \left\| \left( \frac{\exp(\boldsymbol{\mathsf{A}}^{ref}\Delta t)-I}{\Delta t}-\boldsymbol{\mathsf{A}} \right)\boldsymbol{v}^n \right\|^2 = \min_{\boldsymbol{\mathsf{A}}\in\mathscr{M}_K(\mathbb{R})} \frac{1}{2} \left\| \left( \frac{\exp(\boldsymbol{\mathsf{A}}^{ref}\Delta t)-I}{\Delta t}-\boldsymbol{\mathsf{A}} \right)\mathbb{X}\right\|_F^2, \end{align}
with  $\mathbb {X}=[\boldsymbol {v}^0,\boldsymbol {v}^1,\ldots,\boldsymbol {v}^{N-1}]\in \mathscr {M}_{KN}(\mathbb {R})$. The first-order optimality conditions are
 \begin{equation} \boldsymbol{\mathsf{A}}\, \mathbb{X}\mathbb{X}^{\rm T} = \left(\frac{\exp(\boldsymbol{\mathsf{A}}^{ref}\Delta t)-I}{\Delta t}\right)\,\mathbb{X}\mathbb{X}^{\rm T}. \end{equation}
As soon as  $\mathbb {X}$ is a full-rank matrix (meaning that
  $N\geq K$ and we reasonably have
  $K$ linearly independent measurements of
  $\boldsymbol {v}^n$), the matrix
  $\mathbb {X}\mathbb {X}^{\rm T}$ is invertible and we get the estimate
 \begin{equation} \boldsymbol{\mathsf{A}} = \frac{\exp(\boldsymbol{\mathsf{A}}^{ref}\Delta t)-I}{\Delta t}. \end{equation}
Let us denote by  $\lambda _k^{ref}$ (resp.
  $\lambda _k$) the (complex) eigenvalues of
  $\boldsymbol{\mathsf{A}}^{ref}$ (resp.
  $\boldsymbol{\mathsf{A}}$). We have
  $\lambda _k = ({\exp ({\lambda _k^{ref}\Delta t})-1})/{\Delta t}$. Suppose now that we use a small time step
  $\Delta t$. From a Taylor expansion, we observe that
 \begin{equation} \lambda_k = \lambda_k^{ref}+\frac{\Delta t}{2}\,(\lambda_k^{ref})^2+o(\Delta t). \end{equation}
We would like to study the effect of the first-order error term  $({\Delta t}/{2})(\lambda _k^{ref})^2$ on the stability of the reconstructed dynamical system
  $\dot {\boldsymbol {v}}=\boldsymbol{\mathsf{A}}\boldsymbol {v}$. Suppose that the complex number
  $\lambda _k^{ref}$ has real and imaginary parts
  $a$ and
  $b$, respectively. Then
 \begin{equation} \lambda_k = \left(a+\frac{\Delta t}{2}\,(a^2-b^2)\right) + {\rm i}\, b(1+a\,\Delta t)+o(\Delta t). \end{equation}
If  $a=\mathrm {Re}(\lambda _k^{ref})\leq 0$, what are the conditions to keep
  $\mathrm {Re}(\lambda _k)\leq 0$? We consider two cases.
(i) If
$a=0$ (with $b\neq 0$), then $\lambda _k^{ref}$ is pure imaginary, meaning that the $k$th field is a centre for the reference dynamical system. In this case, $\lambda _k = -({\Delta t}/{2})b^2+o(\Delta t)<0$ for a small enough $\Delta t$.(ii) Consider now the case
$a\neq 0$. There are two sub-cases. If $a^2\leq b^2$, then $\mathrm {Re}(\lambda _k)\leq 0$ for a small enough $\Delta t$. If $a^2< b^2$, then the condition $\mathrm {Re}(\lambda _k)\leq 0$ gives
(A8)So there is again a time step\begin{equation} \Delta t + o(\Delta t) ={-}\frac{2a}{a^2-b^2}. \end{equation}$\Delta t^\star >0$ for which, for any $\Delta t<\Delta t^\star$, we have $\mathrm {Re}(\lambda _k)\leq 0$.


As a conclusion, starting from a stable linear dynamical system (in the sense that  $\mathrm {Re}(\lambda _k^{ref})\leq 0$ for all
  $k$), using a small enough time step
  $\Delta t$ and the forward Euler time discretization, the identification method leads to an estimated dynamical system that is also stable.
Let us underline that this could not be the case using another time discretization as e.g. for the backward Euler time discretization and the associated least squares problem,
 \begin{equation} \min_{\boldsymbol{\mathsf{A}}\in\mathscr{M}_K(\mathbb{R})} \frac{1}{2}\sum_{i=0}^{N-1} \left\|\frac{\boldsymbol{v}^{n+1}-\boldsymbol{v}^n}{\Delta t}-\boldsymbol{\mathsf{A}} \boldsymbol{v}^{n+1}\right\|^2. \end{equation}
Using identical developments, we would get in this case  $\boldsymbol{\mathsf{A}}=({I-\exp (-\boldsymbol{\mathsf{A}}^{ref}\Delta t)})/{\Delta t}$ and
 \begin{equation} \lambda_k = \left(a-\frac{\Delta t}{2}\,(a^2-b^2)\right) + {\rm i} b(1-a\,\Delta t)+o(\Delta t). \end{equation}
We observe that for a centre with a pure imaginary eigenvalue  $\lambda _k^{ref}={\rm i}b$,
  $b\neq 0$, one gets
  $\lambda _k=({\Delta t}/{2})b^2+o(\Delta t)$, therefore
  $\lambda _k>0$ for a small enough
  $\Delta t$. This is a counter-intuitive result: for numerical simulations, it is known that the backward Euler scheme s more stability than the forward one. For system identification with time discretization of the residual term, it is safer to use the forward Euler scheme for stability of the estimated dynamical model.
Appendix B. Kinetic energy dissipation
Another quantity of interest is the capsule kinetic energy  $\|\{\boldsymbol{v}\}\|^2$. Since the capsules are expected to reach a steady state after a transient stage in the Stokes pipe flow, the kinetic energy should also reach a constant value. From the differential equations, semi-orthogonality of
  $\boldsymbol{\mathsf{Q}}$ and the symmetry property of the scalar product, we successively have
 \begin{align} \frac{{\rm d}}{{\rm d}t}\left(\frac{1}{2}\,\|\{\boldsymbol{v}\}\|^2\right) &= \frac{{\rm d}}{{\rm d}t}\left(\frac{1}{2}\,\langle \boldsymbol{\mathsf{Q}}\boldsymbol{\beta},\boldsymbol{\mathsf{Q}}\boldsymbol{\beta} \rangle\right)\nonumber\\ & = \frac{{\rm d}}{{\rm d}t}\left(\frac{1}{2}\,\|\boldsymbol{\beta}\|^2\right) \nonumber\\ & = \langle \boldsymbol{\beta},\dot{\boldsymbol{\beta}}\rangle \nonumber\\ & = \langle \boldsymbol{\beta}, \boldsymbol{\mathsf{A}}_\mu \boldsymbol{\beta} \rangle \nonumber\\ & = \frac{1}{2}\,\langle \boldsymbol{\beta}, \boldsymbol{\mathsf{A}}_\mu \boldsymbol{\beta} \rangle + \frac{1}{2}\, \langle \boldsymbol{\beta}, \boldsymbol{\mathsf{A}}_\mu^{\rm T} \boldsymbol{\beta} \rangle \nonumber\\ & = \left\langle \boldsymbol{\beta}, \frac{\boldsymbol{\mathsf{A}}_\mu+\boldsymbol{\mathsf{A}}_\mu^{\rm T}}{2}\,\boldsymbol{\beta} \right\rangle. \end{align}
So stability properties on the kinetic energy are related to the spectral nature of the (symmetric) matrix  $\boldsymbol{\mathsf{A}}_\mu ^S=({\boldsymbol{\mathsf{A}}_\mu +\boldsymbol{\mathsf{A}}_\mu ^{\rm T}})/{2}$. The dissipation property is linked to the non-positiveness of the (real) eigenvalues of
  $\boldsymbol{\mathsf{A}}_\mu ^S$.
Appendix C. Practical computation of the pseudo-inverse matrix
The Moore–Penrose pseudo-inverse  $\mathbb {X}^{\dagger}$ of a matrix
  $\mathbb {X}$ of size
  $d\times K$,
  $d\geq K$, with
  $\text {rank}(\mathbb {X})=K$, is defined by
 \begin{equation} \mathbb{X}^{\dagger}{=} \mathbb{X}^{\rm T} (\mathbb{X}\mathbb{X}^{\rm T})^{{-}1}. \end{equation}
For an ill-conditioned matrix  $\mathbb {X}$, the direct computation of
  $\mathbb {X}^{\dagger}$ by (C1) is unsuitable because the condition number of
  $\mathbb {X}\mathbb {X}^{\rm T}$ is the square of that of
  $\mathbb {X}$. A more robust procedure can be derived by help of the
  $QR$ factorization. There exists a semi-orthogonal matrix
  $\hat{\boldsymbol{\mathsf{Q}}}$ of size
  $d\times K$, and an upper triangular square matrix
  $\boldsymbol{\mathsf{R}}$ of size
  $K\times K$, such that
  $\mathbb {X}^{\rm T} = \hat{\boldsymbol{\mathsf{Q}}} \boldsymbol{\mathsf{R}}$. Moreover,
  $\boldsymbol{\mathsf{R}}$ is invertible because
  $\mathbb {X}$ is assumed to be a full-rank matrix. Since
  $\mathbb {X}^{\dagger}$ is the solution of the matrix system
 \begin{equation} \mathbb{X}^{\dagger} \, (\mathbb{X}\mathbb{X}^{\rm T})= \mathbb{X}^{\rm T}, \end{equation}
we get
 \begin{equation} \mathbb{X}^{\dagger} \, \boldsymbol{\mathsf{R}}^{\rm T} \hat{\boldsymbol{\mathsf{Q}}}^{\rm T} \hat{\boldsymbol{\mathsf{Q}}} \boldsymbol{\mathsf{R}} = \hat{\boldsymbol{\mathsf{Q}}} \boldsymbol{\mathsf{R}}. \end{equation}
By multiplying by  $\boldsymbol{\mathsf{R}}^{-1}$ on the right, since
  $\hat{\boldsymbol{\mathsf{Q}}}^{\rm T} \hat{\boldsymbol{\mathsf{Q}}}=\boldsymbol{\mathsf{I}}_K$, we get
 \begin{equation} \mathbb{X}^{\dagger}{=} \hat{\boldsymbol{\mathsf{Q}}}\, (\boldsymbol{\mathsf{R}}^{\rm T})^{{-}1} . \end{equation}


 Open access