


1. Introduction
The objective of this work is to reconstruct the glacier retreat observed in Glaciar Coronas, Spain, during the 20th century. This small glacier is located at 42°38′00″ N, 0°39′20″ E in the Maladeta Range, in a southwest-facing cirque eroded into the granodiorites of Pico de Aneto (3404 m a.s.l.), the highest peak of the Pyrenees (Fig. 1). The glacierization of the Pyrenees is of particular interest in the context of climatic change in European mountain regions, due to its situation in middle, temperate latitudes. In the Pyrenees, as in most other parts of the Northern Hemisphere, glaciers began to recede from their Little Ice Age (LIA) maximum positions around the mid-19th century (Reference Chueca, Peña, Lampre, García-Ruiz and Martí BonoChueca and others, 1998). The climatic trends registered in the area during the 20th century have enhanced this process, and the shrinkage of Glaciar Coronas is an excellent example.
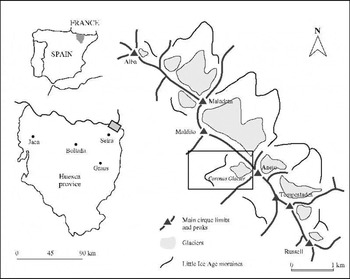
Fig. 1. Location of Glaciar Coronas in the study area, Maladeta Range, central Spanish Pyrenees.
The Maladeta Range has the best-preserved and largest ice masses in the whole Pyrenean Range. Almost all of them are small north-northeast-facing cirque glaciers, covering a total area of around 200 ha, the three most extensive being Glaciares Aneto (100 ha), Maladeta del Este (52 ha) and Tempestades (28 ha) (Reference Julián, Chueca, Peña, López and LapeñaJulián and others, 2001). The ice masses are situated at 2800–3300 m a.s.l. on northern slopes, with a few in south-facing cirques 3000–3200 m a.s.l. Ice depths vary across each cirque, the maximum thickness, measured by geophysical methods, being 40–50 m in Glaciares Aneto and Maladeta (Reference Martínez, García, Macheret, Navarro and BisbalMartínez and others, 1997). The equilibrium-line altitude (ELA) in the zone is about 3000–3100 m a.s.l. (Reference Chueca and JuliánChueca and Julián, 1994). Glaciar Coronas is the most extensive ice mass on the southern slopes of the Maladeta Range (Fig. 2). It has recently separated into several bodies, of which the largest is a glacieret with a surface of 2.4 ha located at 3065–3220 m a.s.l. Today, the sum of its five largest fragments slightly surpasses 3 ha; during the LIA maximum the ice extent was 37 ha. These data illustrate the ice depletion of the area during the last century.

Fig. 2. Geomorphological map of Coronas cirque.
Glaciar Coronas has traditionally been used as a direct route to the summit of the Pyrenees, the Pico de Aneto. Consequently, there is a relatively abundant graphical documentation (photographs, aerial photographs, cartography) of the state and recent evolution of the glacier. Once compiled and analyzed, the record has served to accomplish our main objective: to reconstruct and map the ice mass during five stages (1928; 1957; 1980–81; 1990; 1998), to which we have added an initial phase, the LIA maximum, dated in the moraine deposits of the area around 1820–30 (Chueca and Julián, 1996). In section 3 of our study, this information, ofa qualitativerather than quantitative nature, is compared with some basic climatic data (temperature and precipitation) recorded at the nearby Seira weather station since 1921. This comparison allows us to detect the influence of the climate on the dynamics of Glaciar Coronas, explaining the phases of glacier recession, stabilization and accelerated downwasting.
2. Documentation of Ice Extent: Glaciar Coronas Fluctuations
The evolution of glaciers since the LIA in the Pyrenees has been studied in more detail in the French (northern) sector of the range than in the Spanish (southern) sector (Reference DegrangeDegrange, 1882; Reference BonaparteBonaparte, 1890, Reference Bonaparte1891; Reference SchraderSchrader, 1894; Reference RussellRussell, 1908; Reference GaurierGaurier, 1912, Reference Gaurier1921, Reference Gaurier1934; Reference GalibertGalibert, 1956; Reference BarréreBarrère, 1963; Reference CamenaCamena, 1969; Reference SerratSerrat, 1980; Reference Martínez de Pisón and ArenillasMartínez de Pisón and Arenillas, 1988; Reference Gellatly, Grove, Bücher, Latham and WhalleyGellatly and others, 1995; Reference Chueca, Peña, Lampre, García-Ruiz and Martí BonoChueca and others, 1998), and these glaciers have attracted relatively little attention compared with those in the European Alps. In the Maladeta Range, this evolution has been outlined in several works (Reference Copons, Bordonau, Martí Bono and García-RuizCopons and Bordonau, 1994; Reference Lampre, Martí Bono and García-RuizLampre, 1994, Reference Lampre, Pérez Alberti, Martini, Chesworth and Martinez Cortizas1996; Reference Chueca, Julián, Pérez Alberti, Martini, Chesworth and Martinez CortizasChueca and Julián, 1996, Reference Chueca, Julián, Raso and Martin-Vide1999).
Two main sources of documentary evidence were used to map the glacier extent at each stage: (1) Aerial photographs are generally highly reliable, especially the 1957 aerial survey. The 1981 survey offers greater detail, but the snow cover is extensive, so it has only been used to support the interpretations of the second type of documents. (2) Terrestrial photographs are very useful if taken from similar places, and if the images are extensive (i.e. they include the whole or a major part of the glacier). Correct dating, especially of the oldest documents, is a serious problem, so the only photographs used in our study are those for which a trustworthy chronology can be established: 1928, 1980, 1990 and 1998.
This evidence has been used to construct the cartography of the Glaciar Coronas evolution presented in Figure 3 and Table 1. The area-extent data correspond with the values of planimetric surface area; therefore, the actual surface area is likely to be slightly larger than cited here. A simple measure of volumetric change is also undertaken (by visual estimation of the ice thickness at several control points located on the Coronas glacial cirque walls). In this way, we have captured the apparent tendency of the glacier mass to increase, stabilize or diminish.

Fig. 3. Glaciar Coronas ice extent in 1820–30, 1928, 1957, 1980–81, 1990 and 1998.
Table 1. Glaciar Coronas changes, 1820–30, 1928, 1957, 1980–81, 1990 and 1998

-
(1) 1820–30. As a starting point of reference, we have used the maximum extent reached by Glaciar Coronas during the LIA, suggested by the prominent arcuate moraine shown in Figure 4, dated in the moraine deposits of the Maladeta Range to around 1820–30 (Reference Chueca, Julián, Pérez Alberti, Martini, Chesworth and Martinez CortizasChueca and Julián, 1996). The ice extent at that time was 37 ha, and the glacier length was slightly over 1 km. Maximum and minimum altitudinal levels of the ice mass were 3250 and 2780 m a.s.l. The ELA (estimated by the classic Kurowski method; Reference Osmaston, Peel, Chisholm and HaggettOsmaston, 1975) was at 2994 m a.s.l.

Fig. 4. Photograph showing the Glaciar Coronas LIA arcuate moraine terminal area (photograph by E. Blanchard).
-
(2) 1928. A photograph by an unknown author, released as a postcard in 1928, shows the glacier situation at that time (Fig. 5). Since the LIA maximum, considerable change has taken place: the glacier ice front is now clearly withdrawn from the moraine, and the reduction in surface area is considerable. The glacier extent is approximately 19 ha, the length 600 m, and the maximum and minimum altitudinal levels 3250 and 2910 m a.s.l.; the estimated ELA for this stage was located at 3065 m a.s.l.
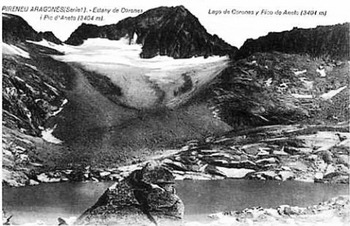
Fig. 5. View of Glaciar Coronas and its LIA moraine taken from Ibones de Coronas in 1928. The highest elevation in the centre of the postcard is Pico de Aneto; Collado de Coronas is also visible in the left distance (photographer unknown).
-
(3) 1957. The first vertical aerial photograph of the area was taken in 1957 (American flight; August 1957; photo No. 59539), providing a well-defined view of Glaciar Coronas. The recession process is extremely noticeable: between 1928 and 1957 the glacier front had retreated about 250 m, having an extent of just 8.6 ha in its main fragment. Maximum and minimum altitudinal levels are 3250 and 3020 m a.s.l. The ELA is placed at 3122 m a.s.l.
-
(4) 1980–81. For this stage we refer to the information provided by the 1981 aerial survey (south Pyrenees flight; September 1981; photo No. 8468), and a contemporary photographic document (Fig. 6) published by Reference Martínez de Pisón and ArenillasMartínez de Pisón and Arenillas (1988). For the most part, there is remarkably little difference in estimated extent and profile since 1957. The ice-mass extent of the glacier is now 7.5 ha; the maximum and minimum altitudinal levels, length, and ELA position are almost the same as the 1957 values.

Fig. 6. View of Glaciar Coronas and its LIA moraine taken from Ibones de Coronas in 1980 (photograph by E. Martínez de Pisón and M. Arenillas).
-
(5) 1990. Ten years after the previous stage, thinning and lateral shrinkage is again observed. Several photographs show this evolution (Fig. 7), which is confirmed by the fragmentation of Glaciar Coronas into several smaller bodies. The extent of the greater fragment in this phase was 3.8 ha, with a length of 325 m. Maximum and minimum altitudinal levels of the ice mass were placed at 3250 and 3060 m a.s.l.; the estimated ELA was at 3132 m a.s.l.

Fig. 7. View of Glaciar Coronas taken in the vicinity of its LIA moraine in 1990 (photograph by I. López).
-
(6) 1998. The last of the stages analyzed shows the situation of Glaciar Coronas at the present time. Photographs taken during the 1998 glaciological survey coordinated by the Spanish Consejo de Protección de los Glaciares (Reference Chueca, Peña, Julián and BlanchardChueca and others, 2000) show a noticeable degradation in the ice mass. The glacier is now a glacieret, thinned and apparently (no data on velocity are available) lacking any dynamism (Fig. 8). The extent has been reduced, in its main fragment, to 2.4 ha, with a length of 275 m. Maximum and minimum altitudinal levels are located at 3220 and 3065 m a.s.l.; the estimated ELA is positioned at 3145 m a.s.l. (Table 1).

Fig. 8. View of Glaciar Coronas and its LIA moraine taken from Ibones de Coronas in 1998. Since 1928 the withdrawal of the glacier front, its separation into several bodies and the loss in ice thickness is evident (photograph by E. Blanchard).
3. Climatic-Data Variation
3.1. Collection of climate data
The Seira weather observatory has relatively long precipitation and temperature records (temperatures: 1941–94; precipitation: 1919–94). It is located at 815 m a.s.l., around 20 km southwest of the Maladeta Range (Fig. 1). The monthly temperature and precipitation data were treated to fill incomplete months in the period 1938–39 and to extend the series until 1998 using linear regressions with data from the nearby Graus observatory (statistically significant for both temperature and precipitation values; r 2 > 0.7; significance level α = 0.01). Selected values (with dataseries average values for temperature and precipitation, and a 5 year moving average for temperature) are presented in Figures 9 and 10: data were grouped in quarterly values (first-quarter temperatures (January–March), third-quarter temperatures (July–September); fourth-quarter precipitation (October–December), first-quarter precipitation and second-quarter precipitation (April–June)) and annual values. This selection is useful as it reflects those periods of the year thought most important for understanding summer and winter glacier balances.

Fig. 9. Temperature record from Seira weather observatory.

Fig. 10. Precipitation record from Seira weather observatory.
3.2. Glaciar Coronas variations as a function of climate
Detailed analysis of the relationships between glacier fluctuations and climatic changes is hampered by the absence of mass-balance studies on Glaciar Coronas. Besides, there is an obvious mismatch between our two datasets, with continuous temperature and precipitation records from the 1920s, but intermittent records of glacier extent. Overall, as we have pointed out, ice depletion was clearly dominant during the 20th century at Glaciar Coronas, but the rate has varied and has not been continuous. The primary factors controlling glacier mass balance are undoubtedly temperature and precipitation, and the fluctuations of Glaciar Coronas during this period show good agreement with the variations of these two climatic variables, apparently much clearer in the case of temperature.
-
(1) 1920s–early 1960s: ice depletion period (glacier surface 1928–57 receded from 19 to 8.6 ha; front of the glacier withdrew 250 m). Temperatures were always above the data-series average value (annual, summer and winter quarters), with maxima in the second half of the 1940s, favouring melting processes during winter and long ablation seasons. The influence of precipitation on the glacier mass balance in this phase is not so obvious, since in the four analyzed variables (first, second and fourth quarters and annual total) fluctuations are both above and below average throughout the period. But even though no clear trend is detected, examination shows that there are more years with below-average values than humid years, favouring the incidence of ablation processes in the glacier.
-
(2) Early 1960s–mid-1980s: stabilization of the deglaciation process (glacier surface 1957–81 slightly receded from 8.6 to 7.5 ha; withdrawal of the front of the glacier not evident). In this phase, both climatic factors seem to contribute to the preservation of the ice mass. Temperatures (in the three cases) show a marked reduction, which culminates in the first half of the 1970s, and almost throughout this period the precipitation (in the four cases) is around or above average values.
-
(3) Mid-1980s–1998: marked ice depletion period (glacier surface 1981–98 receded from 7.5 to 2.4 ha; front of the glacier withdrew about 75 m). The two studied climatic variables continue to have a strong influence on the glacier evolution. In the case of temperatures, the three considered values are scarce but constantly above the data-series average (with summer temperatures peaking in the early 1990s, and winter temperatures in the second half of the 1990s). In addition, precipitation was almost always well below average in the three studied quarters (particularly in the winter months) and in the annual total accumulation.
In general, periods during which the climate favoured positive mass balances saw only slight stabilization in ice volume and surface area, and this was insufficient to interrupt the general recessional trend. The sensitivity to regional climate of Glaciar Coronas is reflected in the rapid response and adjustment of the glacier fluctuations (evidenced in the ice-front recession or in volume losses) to mass-balance changes. The fact that the glacier lacks a debris cover on its surface, which would reduce ablation, contributes to the process. A minimal time lag (of very few years) seems to exist between temperature and precipitation evolution and responses at the ice front, but lack of continuous glacier-extent data makes this impossible to confirm.
Glaciar Coronas shows the same tendency as other alpine Mediterranean glaciers, which experienced a constant rise in ELAs during the 20th century (particularly in recent decades), as well as an almost continuous sequence of negative mass balances. This has been true of the small glaciers of the Southern Maritime Alps (Reference Gellatly, Smiraglia, Grove and LathamGellatly and others, 1994b; Reference PappalardoPappalardo, 1999); Ghiacciaio del Calderone, central Apennines, Italy (Reference Gellatly, Grove, Latham and ParkinsonGellatly and others, 1994a; Reference D’Orefice, Pecci, Smiraglia and VenturaD’Orefice and others, 2000); Glaciar Corral del Veleta, Sierra Nevada, southern Spain (Reference MesserliMesserli, 1980; Reference Gómez Ortiz, Salvador, Gómez Ortiz and Pérez AlbertiGómez Ortiz and Salvador, 1997); and the other glaciated areas in the southern Pyrenees (Reference Chueca, Peña, Julián and BlanchardChueca and others, 2000; Reference Julián, Chueca, Peña, López and LapeñaJulián and others, 2001). In the northern, more humid Pyrenees, the recession in surface area has also been significant, but less marked. The study by Reference Gellatly, Grove, Bücher, Latham and WhalleyGellatly and others (1995) of Glacier du Taillon, French Pyrenees, showed a decrease in its area from 31 ha in 1924 to 20 ha in 1994 (35.5%), while Glaciar Coronas decreased from 19 ha in 1928 to 2.4 ha in 1998 (87.4%); and a recession in its length by about 150 m from 1928 to 1994, whereas Glaciar Coronas decreased by 325 m from 1928 to 1998.
The timing of this deglaciation process is not the same in all alpine Mediterranean areas, due to the importance of local factors such as topography, shading, presence of debris-cover accumulations or particular topoclimatic conditions; but the general trend towards reduction of the surface area and thickness, or even glacier extinction, is consistent throughout the region.
4. Conclusions
Glacier fluctuations have frequently been used as indicators of climatic change, with changes marked by movement of the glacier front positions or by losses in ice mass. Glaciar Coronas is a good example of the relationship between climate and glacier fluctuations in a mid-latitude Mediterranean alpine context. Recession has dominated the 20th-century history of Glaciar Coronas, with rapid ice depletion occurring since the mid-1980s. Wastage has been interrupted by stationary periods, but the separation of the glacier into several parts during the last two decades indicates the possibility of very rapid depletion of the small ice fragments of this ice mass. Future minor changes in temperatures or precipitation in this Pyrenean area should cause a quick response in the evolution of these fragile ice remnants.
Acknowledgements
This study was supported by the Gobierno de Aragón (project H-9007 Estudio de la dinámica de los glaciares del Pirineo aragonés) and the ECLIPSE program (Environnement et climat du passé: histoire et évolution). N. F. Glasser, Scientific Editor for the paper, and I. Owens provided many useful comments that improved the manuscript.


