


Introduction
Cover crops are increasingly being incorporated into rainfed agroecosystems because they can protect and improve soil health and water quality (Conservation Technology Information Center, 2017). There is also considerable interest in their use as a management tool for weed suppression in rainfed agroecosystems (Brust et al., Reference Brust, Claupein and Gerhards2014; Bietila et al., Reference Bietila, Silva, Pfeiffer and Colquhoun2016; Koehler-Cole et al., Reference Koehler-Cole, Proctor, Elmore and Wedin2021). In arid agricultural regions, the adoption of cover crops has not been as rapid as in rainfed areas. This is because cover crops are considered potential risks that might reduce soil moisture and jeopardize the productivity of the subsequent primary crop (Robinson and Nielsen, Reference Robinson and Nielsen2015; Sharma et al., Reference Sharma, Irmak, Djaman and Odhiambo2017). Producer interest in adopting cover crops has also been tempered by concerns about providing water to a crop that will not provide income (Mitchell et al., Reference Mitchell, Shrestha and Irmak2015). ‘Non-thirsty’ cover crops with low water use requirements could play a larger role in increasingly water-scarce regions – especially if they provide economic value or easily recognizable agroecosystem services (Schipanski et al., Reference Schipanski, Barbercheck, Douglas, Finney, Haider, Kaye, Kemanian, Mortensen, Ryan, Tooker and White2014).
Annual cover crops can be grown in either the warm season (spring- planted) or cool season (planted in late summer or fall). Production of cover crops during the colder winter season, when evapotranspiration rates are lowest, might also be a more tenable scenario in arid regions. In these regions, fields are often fallow and subject to wind erosion during the winter. Cover crops could reduce the hazards due to dust storm events and particulate air pollution (Munda et al., Reference Munda, Knowles, Meen, Wakimoto and Worthy1998). Previous studies demonstrated the impacts of cool season cover crops on soil aggregate stability (Kong et al., Reference Kong, Six, Bryant, Denison and Van Kessel2005); biologically active carbon (Wander et al., Reference Wander, Traina, Stinner and Peters1994); crop yields (Snapp et al., Reference Snapp, Swinton, Labarta, Mutch, Black, Leep, Nyiraneza and O'Neil2005) and weed suppression (Bond and Grundy, Reference Bond and Grundy2001).
Species selection is a challenge for many producers who might be considering the adoption of cover crops (Plastina et al., Reference Plastina, Liu, Miguez and Carlson2018). For fall-planting in areas with mild winters, small grains are readily available options because they do not require specialized equipment as they are commonly utilized for grain, forage, hay and silage production. The potential of small grains as cover crops is now the subject of considerable interest (Conservation Technology Information Center, 2017), although the ability of ‘multi-purpose’ small grains to suppress weeds and conserve water is poorly understood for irrigated cropping systems on arid lands. The purpose of our study was to examine the potential of several small grain species as a fall-sown cover crop in an irrigated, organic agroecosystem in the southwestern United States.
Our first objective was to compare several species of small grains for their abilities to suppress winter weeds in an irrigated, organic transition field in southern New Mexico. Small grains evaluated included cereal rye (Secale cereale L), winter wheat (Triticum aestivum L.), barley (Hordeum vulgare L.) and oat (Avena sativa L.). Based on the results of those comparisons, we then focused on barley as the most promising small grain species for use as a winter cover-crop.
Barley is a fast-growing annual grass that competes with weeds by shading and absorbing nutrients and water from the soil. It also discourages weed seed germination by producing allelopathic chemicals (chemicals that are toxic to other plants) (Jacobs, Reference Jacobs2016). Barley cover crops can suppress weeds with annual lifecycles such as annual sowthistle (Sonchus oleraceus), barnyardgrass (Echinochloa crus-galli), common groundsel (Senecio vulgaris) and yellow foxtail (Setaria glauca) (Alonso-Ayuso et al., Reference Alonso-Ayuso, Gabriel, García-González, Del Monte and Quemada2018; Creamer et al., Reference Creamer, Bennett, Stinner, Cardina and Regnier1996; Dhima et al., Reference Dhima, Vasilakoglou, Eleftherohorinos and Lithourgidis2006), as well as weeds with perennial lifecycles including bermudagrass (Cynodon dactylon) (Valencia-Gredilla et al., Reference Valencia-Gredilla, Royo-Esnal, Juárez-Escario and Recasens2020). Fall-sown barley cover crops generally outcompete winter weeds, resulting in very little weed biomass at the time of cover crop termination (Silva, Reference Silva2014; Wayman et al., Reference Wayman, Cogger, Benedict, Burke, Collins and Bary2014), although weed suppression ability can differ among barley varieties (Christensen, Reference Christensen1995).
Our second objective was to determine if certain varieties of barley available as certified organic seed from suppliers in the western USA would be more suitable as a cover crop than others in a semi-arid, organic production environment. We examined the impact of seven organically certified barley varieties on winter weed densities and soil moisture during the 2016–2017 season. We then re-examined the three most promising varieties during the following season by determining weed densities and soil moisture status in each variety block approximately one month before termination.
Materials and methods
Site
The field study was established at the Student Research and Education Gardens, on the campus of New Mexico State University, Las Cruces, NM (32⁰ 28′04.39″ N, 106⁰ 75′88.71″ W, 1200 m altitude). Las Cruces is located in USDA hardiness zone 8a (‒12.2 to ‒9.4°C). The average annual precipitation for Las Cruces, NM, is 24.7 cm (U.S. Climate Data, 2021) with the majority falling during a summer monsoon season (July to September). Weather data were compiled during the 2016–2017 growing season from a weather station (NMSU main campus) located about 1 km away from the trial site.
The soil at the study site is a Belen clay [Clayey over loamy, smectitic over mixed, superactive, calcareous, thermic Vertic Torrifluvents]. Analysis of bulk soil samples in February 2012 (prior to field preparation) showed organic matter content was 2.4% and pH 7.3. Macronutrient levels were NO3-N (1:5 soil:water extract) = 7 ppm; Olsen P (NaHCO3 extracted) = 21 ppm and K (1:5 soil:water extract) = 56 ppm. Composted equestrian manure (NO3-N (1:5 soil:water extract = 197 ppm) was applied during field preparation. Subsequent analysis demonstrated soil nitrate levels reached 59 ppm. A similar application was made in 2013.
The Student Research and Education Gardens received organic certification on 10 October 2014. Prior to certification, the Student Research and Education Gardens underwent a three-year transition period in which only organic production methods were employed.
Plot management
Small grains cover crop studies were initiated in Fall 2012 and continued through Spring 2018. The selected field was initially planted with sesbania (Sesbania exaltata (Raf.) Rydb. ex A.W. Hill; variety not specified) in Spring 2012 for nitrogen fixation and soil quality improvement. Sesbania was again planted during the subsequent summer of 2013. The seeding rate was 78 kg ha‒1. During subsequent years, the field was in a multi-yr rotation with maize and vegetable crops. Each Spring and Fall, prior to planting, the field was prepared by discing the previous crop residue and then plowing it down. Approximately two weeks later, a second discing was performed and the field was then harrowed for final seedbed preparation. Applications of composted sheep manure (10 to 30 Mg h‒1) were made in Spring, prior to the second discing operation, during the period 2014–2016 and 4.5 Mg h‒1 dried, pelleted, composted chicken manure (6-4-2) was applied in Spring 2017. No additional soil amendment was applied prior to fall-planting of the small grain cover crop plots.
Experimental design
Objective 1: Comparing small grains for winter weed suppression
In Fall 2012 and Fall 2013, wheat var. ‘Russian Beardless’, oat var. ‘Monida’, rye var. ‘Elbon’, and barley var. ‘Tambar 500’ were planted with a grain drill (Model 450; John Deere, Moline, IL) at seeding rates of 90 kg ha‒1 at 10 mm depth in rows spaced 20 cm apart. In addition to these cover crop treatments, the study included a treatment that was not planted but prepared in the same manner as cover crop treatments (control treatment). The experimental design was a randomized complete block with four replicates. Experimental units (herein ‘plots’) were 27.4 × 4.0 m (109.6 m2). Plot units were maintained in the same treatments for the duration of the two-yr study.
The planting date of cover crops in the 2012–2013 season was 2 November 2012. For the 2013–2014 season the planting date was 11 November 2013. Irrigation (to saturation by flood) was provided at planting to initiate germination and two additional irrigations were provided in early and late Spring, as needed. Cover crops were terminated using a rear-mounted roller crimper featuring a cylindrical drum that generally conformed to the technical standards developed by the Rodale Institute (Rodale, 2022). Cover crops were terminated on 3 May 2013 and 1 May 2014. The timing of cover crop termination was determined by the phenological development of the cover crop species with the most rapid maturation. Specifically, all cover crops were terminated when rye reached the soft dough growth stage (Feekes' Scale 11.2). Cover crops other than rye were at anthesis at the time of termination. Small grains at anthesis or the soft dough stage are well suited for termination with a roller-crimper (Ashford and Reeves, Reference Ashford and Reeves2003), and a roller crimper creates a mat that suppresses summer annual weeds (Davis, Reference Davis2010).
On 23 April 2013 and 25 April 2014, population densities for weed species were determined in three 0.25-m2 square quadrats positioned along a transect that spanned the longitudinal axis within each plot. Neighboring quadrats along transects were approximately 7 m apart. Immediately after determining weed population densities, aboveground biomass combined across weed species and aboveground biomass for cover crops were collected by clipping plants at the soil surface. Weed and cover crop biomass samples were bagged separately. Bagged samples were dried for three days at 65°C and then weighed. Aboveground biomass and population density data were summed across the three 0.25-m2 square quadrats. Prior to subsequent analyses, density and biomass data were scaled to 1 m2.
Weed biomass and cover crop biomass data were used to determine the Cover Crop Weed Index (CCWI) for each plot (Linares et al., Reference Linares, Scholberg, Boote, Chase, Ferguson and McSorley2008):

where CCdw is the dry weight of cover crop biomass, and Weeddw is the dry weight of weed biomass. CCWI values increase with increasing degrees of weed suppression. CCWI values can be used to compare different cover crops for their relative weed suppression potentials when the cover crops are grown under specific conditions. For example, Mesbah et al. (Reference Mesbah, Nilahyane, Ghimire, Beck and Ghimire2019) used the CCWI to determine that oat provided more weed suppression than canola (Brassica napus L.), pea (Pisum sativum L.), a mixture of canola and pea, and a six species mixture comprised of barley, canola, forage radish (Raphanus sativus L.), hairy vetch (Vicia villosa L.), oat and pea in a winter wheat-sorghum (Sorghum bicolor L.)-fallow system in the southern Great Plains of the United States. That study was undertaken on the idea that CCWI values increase with increasing degrees of weed suppression, Linares et al. (Reference Linares, Scholberg, Boote, Chase, Ferguson and McSorley2008) used CCWI values to develop six ranked categories of weed suppression by cover crops. These categories range from CCWI less than 0.5 to CCWI greater than 15. CCWI values less than 0.5 indicate ‘very poor weed control’, reflecting conditions where cover crops are not competitive, and weeds dominate. CCWI values greater than 15 indicate ‘outstanding weed control’ and are consequences of cover crop dominance over weeds (Linares et al., Reference Linares, Scholberg, Boote, Chase, Ferguson and McSorley2008).
Objective 2: Evaluating barley varieties as cover crops in a semi-arid, organic production environment
For the 2016–2017 season, we sought only barley varieties developed west of the Mississippi River that were also available regionally as certified organic seed. We obtained seven diverse varieties. Their type and states of origin are as follows: ‘UC937’ (six-row, semi-smooth awns, spring feed, CA), ‘Arivat’ (six-row, semi-smooth awns, spring feed, AZ), ‘Robust’ (six-row, semi-smooth awns, spring malting, MN), ‘P919’ (six-row, awnless, winter graze, NE), ‘Hayes Beardless’ (two-row, awnless, graze/forage, MT), ‘UC603’ (six-row, semi-smooth awns, spring feed, CA) and ‘Washford Beardless’ (six-row, semi-dwarf, awnless, hooded, spring feed/hay, WA.). Spring varieties are commonly planted in the fall in areas with mild winters and it was assumed that these varieties would be winter-hardy in Las Cruces. For the 2017–2018 season, those barley varieties considered most amenable to the cropping system requirements – ‘Robust’, ‘UC603’, and ‘P919’ – were selected for further study at the same site.
The entries were planted on 21 November 2016 and on 27 November 2017 in strips 57.9 × 4.0 m (231.6 m2) in four replicate blocks in 2016 and two replicate blocks in 2017. A 2.4 m wide strip was left unplanted (control treatment) in each block. The seedbed was prepared, and seeds were sown, as described above under objective 1, but at an increased seeding rate of 112 kg ha‒1. Plots received irrigation (to saturation by flood) at planting to initiate germination. Additional irrigation was provided two weeks after planting in 2016, and no additional irrigation was provided in the 2017–2018 season. On 25 March 2017, plant inflorescence development was determined by measuring 10 randomly selected plants within each of two variety blocks. This was accomplished by visually assessing inflorescences and expressing inflorescence development as percentages, with 100% indicating full elongation of the spike from the flag leaf sheath. Before statistical analyses, inflorescence development data were averaged across the 10 subsamples per block. Weed density data were collected from four 0.25-m2 square quadrats positioned at four even intervals across the longitudinal axis of the study plots. Weed densities were averaged across the four sub-samples and mean weed densities (scaled to 1 m2) were used in statistical analyses.
The volumetric soil moisture content of the surface soil (5.1 cm depth) in each plot was measured using a Hydra Probe sensor (Stevens Water Monitoring Systems Inc. Portland, OR, USA) on 16 December 2016, 23 December 2016, 16 January 2017 and 2 March 2017. For the 2017–2018 season, volumetric soil moisture content at 5.1 cm depth and the 30.5 cm depth was determined on 2 April 2018 and 9 April 2018. Soil moisture readings were taken at three locations within each plot and averaged to estimate the volumetric moisture content for each plot.
Weather data were compiled during the 2016–2017 growing season from a weather station (NMSU main campus) located about 1 km away from the trial site. The average annual precipitation for Las Cruces, NM, is 24.7 cm (U.S. Climate Data, 2021) with the majority falling during a summer monsoon season (July to September).
Statistical Analyses
Statistical analyses were performed using the open-source statistical software program R version 3.6.2 (R Foundation for Statistical Computing, Vienna, Austria).
For objective 1, Levene's test for homogeneity of variances indicated that variance in cover crop biomass, weed biomass, and weed density did not differ between years. Thus, data for the two years (2013 and 2014) were combined. Cover crop species effects on cover crop biomass, weed biomass, and weed density were determined with linear mixed-effects models developed with the R library nlme. Cover crop species were fixed effect, blocks within year, and year were treated as random effects. Model fits were examined with visual inspections of residuals plotted against fitted values. After model fitting, means were compared among cover crop treatments with Tukey's post-hoc tests using the R library multcomp. For weed density and weed biomass data, two linear mixed-effects models were assessed sequentially. The first model included weed density data or weed biomass data from cover crop plots and unplanted control plots. The second model did not include data from unplanted control plots. This sequential analysis of weed density and weed biomass data facilitated comparisons against the unplanted control and detection of possible differences in weed biomass or weed density among cover crop species. CCWI values were compared among cover crop species using a linear mixed-effects model featuring blocks within year, year as a random effect, and cover crop species as the fixed effect. After model fitting, means were compared among cover crop species with a Tukey's post-hoc test. CCWI values were also analyzed separately for each cover crop species by performing single sample t-tests for the null hypothesis CCWI ≤ 15.
For objective 2, the variety effects on inflorescence development at termination were determined with linear mixed-effects models developed with the R library nlme. These models treated variety as the fixed effect, and replicate as the random effect. Visual inspection of residuals plotted against fitted values indicated that the square root transformation of the response variable improved model fit. Thus, inflorescence development data were subjected to square root transformations before the final statistical modeling. For presentation in this paper, square root-transformed data were back-transformed after statistical analyses. After model fitting, varietal means were compared with Tukey's post-hoc tests using the R library multcomp. For each barley variety, weed suppression was assessed with single sample t-tests for the null hypothesis that weed density was greater than or equal to the mean weed density for the unplanted control. Barley and barley variety effects on volumetric soil moisture averaged over the cover crop growing season were determined with a linear mixed-effects model developed using the R library nlme. In this model, the fixed effect was cover crop treatment including barley variety and unplanted control. Random effects were sampling date and replicate. After model fitting, means in volumetric moisture were compared among treatments with a Tukey's post-hoc test using the R library multcomp.
Results
Objective 1: comparing small grains for winter weed suppression
Cover crops were terminated when rye reached the soft dough stage and all other cover crops reached anthesis. At the time of cover crop termination, abundant weed species included Avena fatua L., Capsella bursa-pastoris (L.) Medik., Convolvulus arvensis L., Lolium perenne L., Melilotus officinalis (L.) Lam, Medicago lupulina L. and Polygonum arenastrum Boreau. Weed communities were generally consistent across cover crop species, with P. arenastrum dominant in all cover crops (Table 1).
Table 1. Densities of weed species at cover crop termination
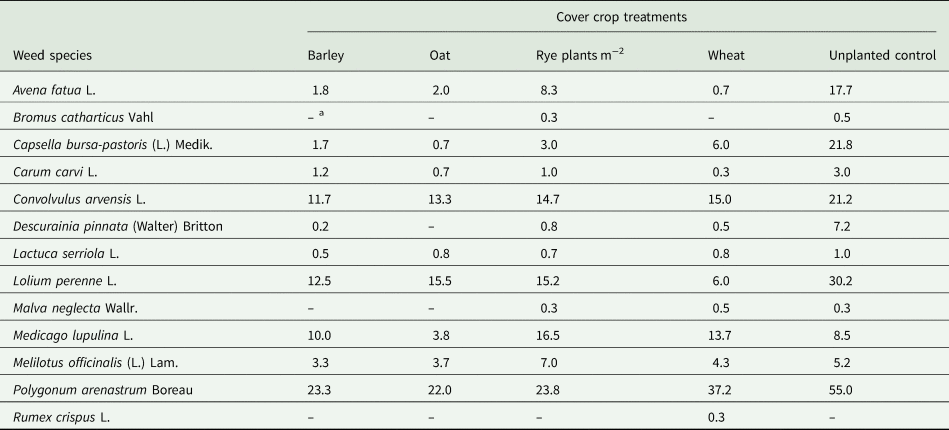
Cover crops were grown at the New Mexico State University, Student Research and Education Gardens at Las Cruces, NM. Data are means across two growing seasons.
a Dashes indicate species not detected in a specific cover crop treatment.
Aboveground dry weed biomass in the unplanted control was 512.5 ± standard error of the mean (sem) 92.6 g m−2. Weed density in the unplanted control was 172 ± sem 21.7 weeds m−2. Compared to unplanted controls, all four cover crop species reduced aboveground weed biomass (P < 0.001) and weed density (P < 0.001). Dry biomass yields were similar among wheat, oat and barley; however, the dry biomass yield for rye was less than the other cover crops (Table 2). In addition to low aboveground biomass, rye featured the maximum value for aboveground weed biomass among the cover crops. CCWI values for rye and wheat were not statistically different, whereas the CCWI for rye was less than the CCWI values for barley and oat. The CCWI for rye was not greater than 15, indicating that rye did not provide outstanding control of winter weeds. The CCWI for wheat was also not statistically different than 15 (the benchmark value) because plot-to-plot differences in cover crop biomass led to high variation in CCWI for this cover crop. CCWI values for barley and oat were greater than 15, which indicated that these cover crops provided outstanding control of winter weeds.
Table 2. Weed density and above-ground biomass for winter cereal cover crops and weeds at the time of cover crop termination during two seasonsa at the New Mexico State University, Student Research and Education Gardens at Las Cruces, NM

a Cover crops were grown in an organic transition field from 2 November 2012 to 3 May 2013 and 11 November 2013 to 1 May 2014. Data were combined across years. The table presents means with standard errors of means (N = 8).
b The Cover Crop Weed Index (CCWI) is the quotient of cover crop biomass by weed biomass, with CCWI values greater than 15 indicates ‘outstanding weed control’ (Linares et al., Reference Linares, Scholberg, Boote, Chase, Ferguson and McSorley2008).
c For weed density, cover crop biomass, weed biomass and CCWI, means within a column that share the same letter are not different according to post-hoc Tukey tests at P < 0.05.
d Asterisks following CCWI values for barley and oat indicate statistical significance of single sample t-tests for the null hypothesis that CCWI < 15. CCWI > 15 is indicated by * (null hypothesis rejected at the 0.05 level) and ** (null hypothesis rejected at the 0.01 level). For rye and wheat, single sample t-tests indicated that CCWI values were less than 15.
e Weed density and biomass for the control plots are included for information only. Statistical significance levels shown between cover crop treatments are from the second model that did not include the control.
Objective 2: Evaluating barley varieties as cover crops in a semi-arid, organic transition production environment
All barley varieties, except ‘UC937’, caused a marked reduction in weed density in comparison with the unplanted control in 2017 (Table 3). In 2018, weed densities remained low (≤ 5.0 weeds m−2) in plots of the three selected varieties (‘Robust’, ‘UC603’ and ‘P919’). ‘Robust’ and ‘UC603’ were the most rapidly maturing varieties (Table 2). For ‘Robust’, approximately 100% of the spike (herein ‘head’) was out of the leaf sheath for most individuals by the last week of March. For ‘UC603’, approximately 50% of the head was out of the leaf sheath by the last week of March. For all other varieties, less than 25% of the head was out of the leaf sheath by the last week of March.
Table 3. Pre-termination plant height, inflorescence development, and weed densities for seven barley varieties grown New Mexico State University, Student Research and Education Gardens during 2016–2017

Inflorescence development data are means of two replicates, with each replicate subsampled ten times. Weed density data are means of four replicates, with each replicate subsampled four times.
a Means that share the same letter are not different according to post-hoc Tukey tests at P < 0.05.
b Symbols indicate statistical significance of single sample t-tests for the null hypothesis that weed density was greater than or equal to the mean weed density for the unplanted control. Weed densities less than the unplanted control are indicated by * (null hypothesis rejected at the 0.05 level), ** (null hypothesis rejected at the 0.01 level) and *** (null hypothesis rejected at the 0.001 level). Weed densities equivalent to the unplanted control are indicated by ‘ns’ (null hypothesis not rejected).
c P values for variety effects on plant height and inflorescence development. Variety effects were determined with linear mixed effects models. Prior to statistical analyses, inflorescence development data were subjected to square root (x + 1) transformations. For presentation in this table, square root-transformed data were back-transformed.
Volumetric soil moisture averaged across observation times was greater for barley than the unplanted control (P < 0.01) (Fig. 1). Averaged across barley cultivars, the season mean soil moisture content was 27.9%, which was a 46.5% increase relative to the unplanted control (season mean soil moisture for the unplanted control was 19.0%). Soil moisture differences between barley and unplanted plots were especially pronounced on 6 January 2017, which was 15 days after a rainfall event on 24 December 2022 (Fig. 2). Among barley varieties, there was no difference in soil moisture across observation times in 2016–2017. In early April 2018, volumetric soil moisture content at the 5.1 cm depth (P = 0.521) and 30.5 cm depth (P = 0.703) was similar among the three varieties selected for further study (‘Robust’, ‘UC603’ and ‘P919’).

Fig. 1. Volumetric soil moisture contents at the 5.1 cm depth for the unplanted control and plots planted with barley varieties ‘Arivat’, ‘Hayes Beardless’, ‘P919’, ‘Robust’, ‘UC603’, ‘UC937’, ‘Washford Beardless’. For the four measurement dates, bars are means ( + standard deviations) of two replications. Season means represent volumetric soil moisture contents averaged across measurement dates. Lowercase letters above season means indicate results from a Tukey's post-hoc test that followed a linear mixed model for cover crop treatment effects on soil moisture content. Means that share a lowercase letter are not different, P < = 0.01.

Fig. 2. Daily total precipitation and daily average air temperature during barley cover crop growth in 2016–2017. Irrigation to saturation was provided at seeding (21 November 2016) and two weeks after planting.
Discussion
Our study showed that both oat and barley would likely perform well as a weed suppressive, fall-sown cover crop in southern New Mexico and similar environments. Consistent with the above results, Seavers and Wright (Reference Seavers and Wright1999) determined that oat and barley were more competitive against a specific weed (Galium aparine, bedstraw) than wheat. Silva (Reference Silva2014) determined that fall-sown rye and fall-sown barley produced equivalent amounts of biomass and resulted in equal amounts of weed biomass at cover crop termination, although fall-sown rye had fewer weeds than fall-sown barley. Differences in the performance of fall-sown rye between our study and Silva (Reference Silva2014) could have been caused by variability in soil moisture between study sites. Silva (Reference Silva2014) evaluated fall-sown cover crops under rainfed conditions in a continental humid climate (Wisconsin USA), whereas we assessed fall-sown cover crops with minimal irrigation in a semi-arid desert.
Although soil moisture at our study site may not have been sufficient for optimum growth of rye, our rye was not a failed crop because the amount of rye biomass in this study was consistent with, or greater than, aboveground dry biomass for overwintered rye in previous studies (Bavougian et al., Reference Bavougian, Sarno, Knezavic and Shapiro2019; Toom et al., Reference Toom, Talgre, Mae, Tamm, Nartis, Edesi, Haljak and Lauringson2019; Moore and Mirsky, Reference Moore and Mirsky2020; Baxter et al., Reference Baxter, West, Brown and Green2021). However, rye biomass in our study was less than the amount of rye biomass reported by Wayman et al. (Reference Wayman, Cogger, Benedict, Burke, Collins and Bary2014, Reference Wayman, Cogger, Benedict, Collins, Burke and Bary2015) who studied fall-seeded cover crops under a cool summer Mediterranean climate (western Washington, USA) at a study site that received approximately 76 cm of precipitation over 132 to 140 days during cover crop growing seasons (Washington State University, 2022). The relatively high amount of biomass for rye grown under frequent precipitation in Wayman et al. (Reference Wayman, Cogger, Benedict, Burke, Collins and Bary2014), and the relatively low amount of biomass for rye in our study, further suggests that rye cover crops are better suited for environments with plentiful moisture. This suggestion is consistent with Baxter et al. (Reference Baxter, West, Brown and Green2021) who studied five cover crops and determined that rye exhibited the greatest increase in biomass from irrigation.
We chose to examine barley further by comparing diverse western varieties. All but one of the seven varieties suppressed winter weeds, and all barley varieties lessened evaporative loss of moisture from upper soil layers. Higher levels of soil moisture for barley compared with the uncovered control were not in full agreement with a previous study that determined fallow soil was wetter than soil under a barley cover crop at termination in only one of two seasons in Central Spain (Alonso-Ayuso et al., Reference Alonso-Ayuso, Gabriel, García-González, Del Monte and Quemada2018). Inconsistent results for soil moisture between our study and Alonso-Ayuso et al. (Reference Alonso-Ayuso, Gabriel, García-González, Del Monte and Quemada2018) may have been caused by differences in barley cover crop seeding rate. We seeded barley at 112 kg ha‒1, whereas Alonso-Ayuso et al. (Reference Alonso-Ayuso, Gabriel, García-González, Del Monte and Quemada2018) seeded barley at 180 kg ha‒1. The higher seeding rate in Alonso-Ayuso et al. (Reference Alonso-Ayuso, Gabriel, García-González, Del Monte and Quemada2018) presumably increased both barley population density and barley water use compared to the lower seeding rate in our study. Barley-induced conservation of soil water is likely influenced by barley seeding rate, with lower seeding rates potentially more conducive to soil water saving than higher seeding rates. Additional research is required to determine the optimal seeding rate that would favor both weed suppression and soil moisture conservation.
A barley variety trial in Australia showed that simulated weeds (oats) reduced barley grain yields by 10–25 percent (Goss and Wheeler, Reference Goss and Wheeler2015). Varieties that showed the highest yield losses were later maturing, displayed slower early growth rates, or displayed more erect plant types. The authors speculated that varieties showing less yield loss had higher growth rates, more tillers and produced more biomass. In our study, earlier maturing varieties (‘Robust’, ‘UC603’) also displayed high levels of weed suppression. The apparent relationship between early maturity and weed suppression ability suggests that time to canopy closure is a significant cause of differences in weed suppression among barley varieties. Relationships between rates of canopy closure and weed suppression have been observed among cover crop species (Ekeleme et al., Reference Ekeleme, Akobundu, Fadayomi, Chikoye and Abayomi2003), and such associations among cover crop varieties warrant further research.
Barley is a cool season annual that is noted for its drought and salinity tolerance, and multiple agricultural uses. Because there are both spring and winter varieties, it can be grown in a wide variety of environments. Although barley varies for winter-survival, in warmer parts of the western United States spring varieties may be successfully planted in the fall if winter temperatures do not drop below ‒8.3°C. Barley is also considered to grow better than other small grains in highly alkaline soils (Reid et al., Reference Reid, Shands and Suneson1979). It can be used for grain, hay and forage production, erosion control, and as an inexpensive cover crop. Barley forage quality is also considered very good (Ditsch and Bitzer, Reference Ditsch and Bitzer2005; SARE, Reference Clark2007).
Barley haymaking breaks diseases and weed cycles in irrigated cropping systems – including alfalfa production (Cash et al., Reference Cash, Surber, Wichman and Hensleigh2008). A potential drawback to planting barley in the rotation may be allelopathic affects on certain crops if the interval between barley termination and subsequent crop planting is too short. In general, we did not observe an impact on subsequent crop germination rates; however, during one season, there appeared to be a possible reduction in germination of common bean (Phaseolus vulgaris). The potential impacts of allelopathy are not well established, and further research is warranted.
A barley cover crop could also reduce the dust hazards due to wind erosion in fallow fields. In the southwestern United States, many fields are fallow in the winter and they can be highly prone to wind erosion. Dust storms, and the concomitant particulate air pollution, are increasing problems in the southwestern United States (Munda et al., Reference Munda, Knowles, Meen, Wakimoto and Worthy1998). In this region, springtime mean dust concentrations increased over the 20-yr period from 1995 to 2014 (Hand et al., Reference Hand, White, Gebhart, Hyslop, Gill and Schichtel2016). The increase was due primarily to earlier onset of the spring dust season by one to two weeks. Fall-sown barley would be well established by that time. Barley is noted for its rapid growth in the fall in New Mexico (Marsalis, Reference Marsalis2007) and for providing good ground cover. Munda et al. (Reference Munda, Knowles, Meen, Wakimoto and Worthy1998) reported that a barley crop in southern Arizona achieved 90% groundcover on a silty clay textured soil, and 65% groundcover on a sandy textured soil, with minimal irrigation.
Adoption of cover crops may be tempered by grower concerns about the availability and cost of additional inputs when direct cash sales from the cover crop are not anticipated. In the semi-arid Southwest, cover-crop requirements for additional irrigation may also cause reluctance to incorporate them into the cropping system. Our study demonstrated that a barley cover crop did not deplete the soil moisture, and during one season (2016–2017) actually conserved it following a long dry period (Figs 1 and 2). The beneficial ecosystems services demonstrated in this study may help reduce the hesitancy to incorporate cover crops into southwestern irrigated cropping systems.
Conclusion
The U.S. National Organic Program requires three years of transition before a field can become organically certified. During the transition period, fields can be managed to enhance agroecosystem health while providing income from agricultural products. Weed suppression and improved soil quality are especially important during the transition period, and cover crops can address those needs (Smith et al., Reference Smith, Jabbour, Hulting, Barbercheck and Mortensen2009). In this study, specific small grain cover crops – barley and oat – provided outstanding control of winter weeds during the organic transition period. Following the transition, and in an organic production environment, winter weeds were suppressed by all but one western barley variety available as certified organic seed. The varieties ‘Robust’ and ‘UC603’ did an excellent job of weed suppression during two seasons. Thus, these barley varieties (‘Robust’ and ‘UC603’) are recommended for organic cropping systems in southern New Mexico and similar semi-arid environments. For higher elevations in the southwestern United States, ‘P919’ may be a better choice because it is both winter hardy and weed suppressive. These recommended barley varieties could fill the need for a ‘non-thirsty’ cover crop in the southwestern United States and play an important role in the effective management of weeds in organic production systems.
Acknowledgements
We are grateful to Mohammed Omer for conducting soil moisture determinations and to Anthony Aranda and the crew at the Fabian Garcia Science Center for the support of field activities. Additional thanks to Michael Petersen for technical support.
Financial support
College of Agricultural, Consumer and Environmental Sciences, New Mexico State University.
Conflict of interest
The authors declare none.


 Open access