


Introduction
Many large carnivores are keystone species and any population decline can lead to dramatic ecological effects if their densities are reduced below certain thresholds, resulting in oversimplified ecosystems. The snow leopard Panthera uncia is considered a typical high mountain species of the arid and semi-arid areas of central Asia, with a range that includes 12 countries (McCarthy et al., Reference McCarthy, Mallon, Jackson, Zahler and McCarthy2017). It is a flagship species for the conservation of the high-altitude ecosystems of Asia. The species is widely but thinly distributed across a range of 1,776,000–3,300,000 km2, with an estimated population size of 7,446–7,996 (McCarthy et al., Reference McCarthy, Mallon, Jackson, Zahler and McCarthy2017). However, there is a high level of uncertainty regarding these estimates as the remote and rugged mountain habitat of the species is a challenging environment in which to work. Although the snow leopard was recategorized from Endangered to Vulnerable in 2017, there is a consensus that snow leopard conservation efforts must be expanded and improved (Mallon & Jackson, Reference Mallon and Jackson2017). The species is also listed in Appendix I of CITES, which means that international trade in the species and its body parts is illegal. The species faces numerous threats, including retaliatory killing for livestock predation, prey depletion, habitat degradation and loss as a result of developmental activities, poaching and global climate change (McCarthy et al., Reference McCarthy, Mallon, Sanderson, Zahler, Fisher, McCarthy and Mallon2016, Reference McCarthy, Mallon, Jackson, Zahler and McCarthy2017; Mallon & Jackson, Reference Mallon and Jackson2017; Aishwarya & Shekhar, Reference Aishwarya and Shekhar2018; Ale & Mishra, Reference Ale and Mishra2018; Suryawanshi et al., Reference Suryawanshi, Khanyari, Sharma, Lkhagvajav and Mishra2019; Li et al., Reference Li, Weckworth, McCarthy, Liang and Beissinger2020).
Reliable information on population status is fundamental for effective conservation and management, and imperative for appropriate and effective conservation interventions. However, reliable population information can be difficult to obtain for carnivores because they often occur at low densities and may be nocturnal, elusive and range over relatively large areas (O'Connell et al., Reference O'Connell, Nichols and Karanth2011). The situation is exacerbated for snow leopards because this species occurs principally in terrain that is difficult to access and at high elevations (Jackson et al., Reference Jackson, Roe, Wangchuk and Hunter2006). As a result, < 1% of the global distribution of the species had been adequately surveyed by 2018 (Suryawanshi et al., Reference Suryawanshi, Khanyari, Sharma, Lkhagvajav and Mishra2019), although efforts since then have expanded this coverage (e.g. Suryawanshi et al., Reference Suryawanshi, Reddy, Sharma, Khanyari, Bijoor and Rathore2021). Assessments of the conservation status of the snow leopard in unsurveyed regions across its range are thus required to inform management decisions. A collaborate initiative, the Population Assessment of the World's Snow Leopards, is currently being implemented by various organizations and government agencies.
Recent habitat suitability and connectivity modelling suggests that the entire span of the Qilian Mountains, Gansu Province, China, is more important to regional and global snow leopard conservation goals than was previously recognized (Li et al., Reference Li, Weckworth, McCarthy, Liang and Beissinger2020). Comparatively high estimated snow leopard densities (3.31 snow leopards/100 km2) in the western Qilian Mountains (Alexander et al., Reference Alexander, Gopalaswamy, Kun, Philip and Antoni2015) lend support to this. In this study we investigate the population status of the snow leopard in the previously unsurveyed central and eastern Qilian Mountains. With 32,038 km2 of potentially suitable, continuous, high-quality snow leopard habitat, these mountains are one of seven snow leopard landscape conservation units identified using maximum entropy modelling that previous expert knowledge-based planning did not identify (Li et al., Reference Li, Weckworth, McCarthy, Liang and Beissinger2020). We used camera traps and spatially explicit capture–recapture methods (Borchers & Efford, Reference Borchers and Efford2008) to estimate snow leopard population density in this area.
Study area
The Qilian Mountains lie at the north-eastern margin of the Tibetan Plateau in Gansu Province, China. The 26,530 km2 Qilianshan National Nature Reserve on the northern slopes of the Qilian Mountains was established in 1988 to protect the forests and wildlife of this region. We conducted our research in the central and eastern region of the Reserve, known as Machang (Fig. 1), located at the boundary of the Hei and Shiyang river systems and characterized by high mountains, deep valleys and a dense network of rivers. Altitude is 2,420–4,933 m, with strong vertical gradients of vegetation comprising mainly grassland (Stipa przewalskii montane grassland and Bistorta vivipara alpine grassland) and shrub vegetation (Caragana spp.), with isolated areas of forest (Picea crassifolia and Sabina przewalskii forests). The study area supports a mammalian carnivore assemblage that, in addition to the snow leopard, includes the grey wolf Canis lupus, red fox Vulpes vulpes, Tibetan fox Vulpes ferrilata, Pallas's cat Otocolobus manul and Chinese mountain cat Felis bieti, and ungulates including the blue sheep Pseudois nayaur, Alpine musk deer Moschus chrysogaster, red deer Cervus elaphus and Siberian roe deer Capreolus pygargus. According to a policy issued in 2017 by the government of Gansu, livestock herding is limited in the study area, and the areas surrounding Qilianshan National Nature Reserve are used by herders to graze livestock, principally yak and sheep.
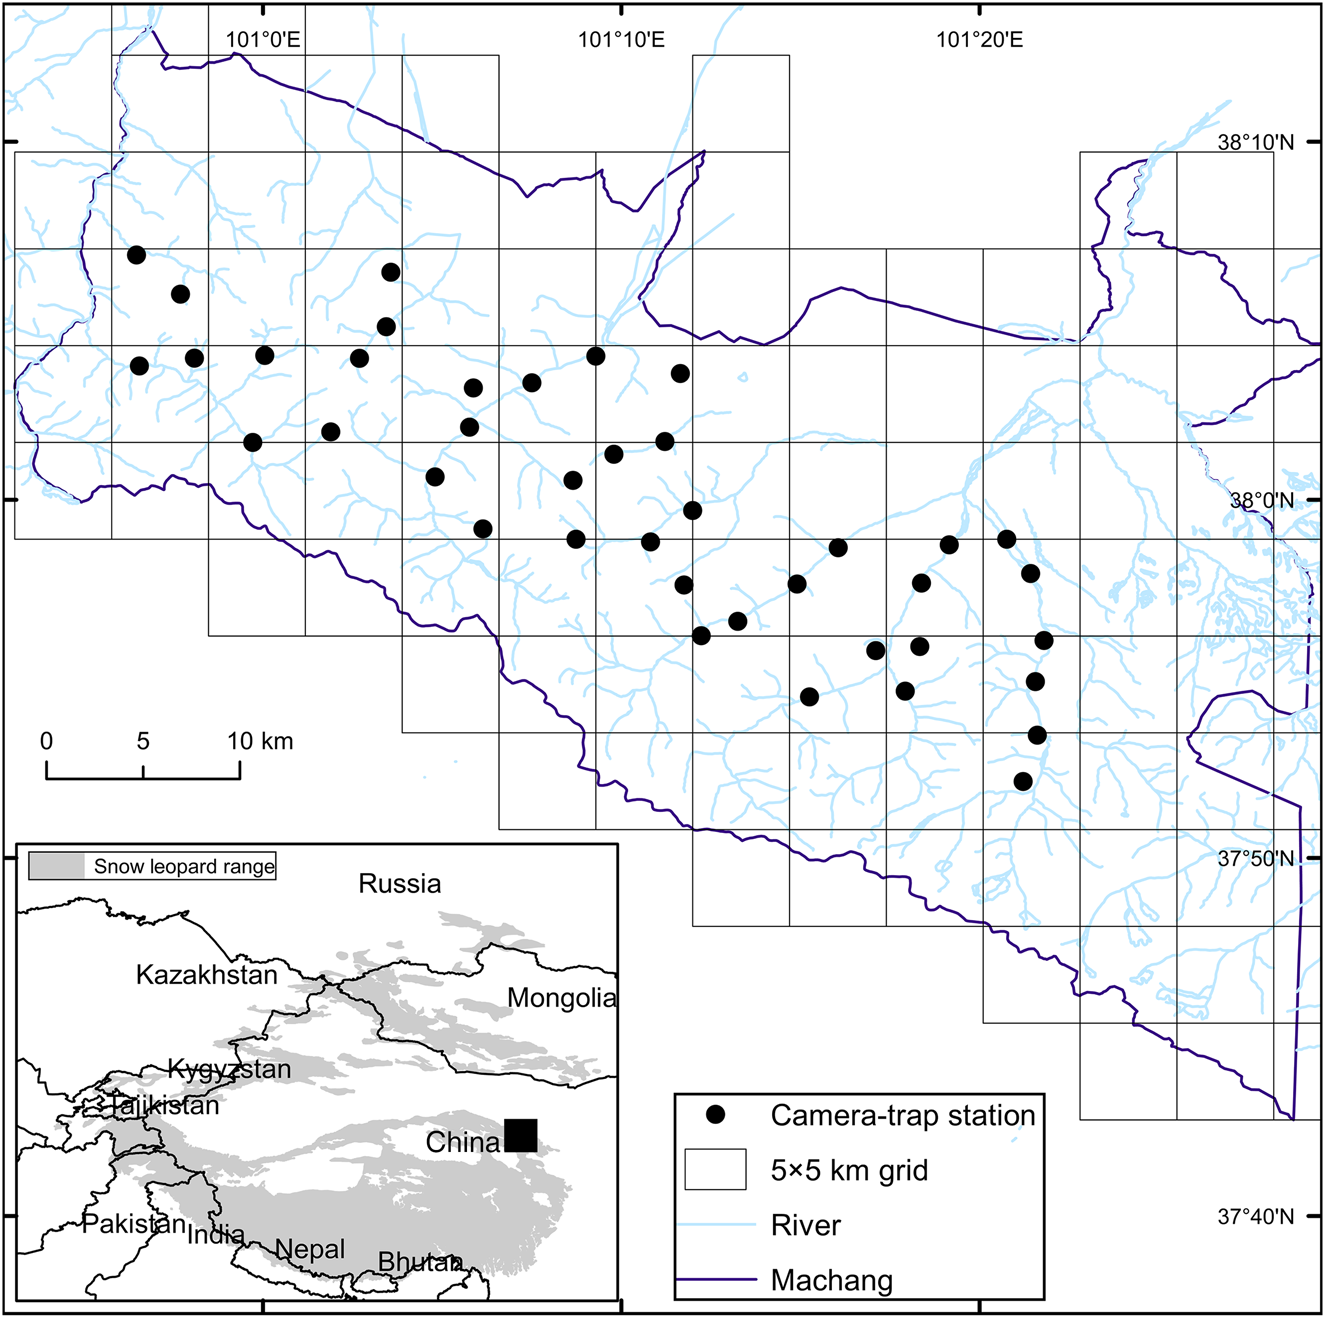
Fig. 1 The study area in Machang, central and eastern Qilian Mountains, China, showing the 5 × 5 km grid and the locations of the camera-trap stations (two per grid cell) used for surveying the snow leopard Panthera uncia. The inset map illustrates the range of the snow leopard (McCarthy et al., Reference McCarthy, Mallon, Jackson, Zahler and McCarthy2017).
Methods
Camera-trapping survey
We deployed 40 camera traps (Ereagle E1B, Shenzhen Ereagle Technology, Shenzhen, China) over an area of c. 650 km2, with a minimum spacing of 1 km between camera traps, during January–March 2019. The study area theoretically spanned multiple snow leopard home ranges as it is larger than the best available estimate of mean minimum convex polygon home range size for snow leopards (c. 500 km2; Johansson et al., Reference Johansson, Rauset, Samelius, McCarthy, Andrén, Tumursukh and Mishra2016). We assumed a temporally closed population as our sampling period was comparatively short relative to snow leopard lifespan (Karanth & Nichols, Reference Karanth and Nichols1998; Alexander et al., Reference Alexander, Gopalaswamy, Kun, Philip and Antoni2015). We placed camera traps systematically, in a 5 × 5 km grid, with two camera-trap stations, each comprising a single camera, in each grid cell. We maximized detection probability by placing cameras at sites where snow leopards were likely to travel (e.g. near snow leopard signs such as scrapes, pugmarks, scats and scent marks or around terrain features such as narrow ridgelines, bottoms, saddles and outcrops that are connection points between areas). We placed cameras in rock piles 45–50 cm above the ground. The cameras were triggered by heat in motion and programmed to capture three consecutive photographs and 10 s of video per trigger, with a 1 min delay between triggers.
Two authors (CZ and DM) independently identified individual snow leopards in photographs, aided by video records if available, and jointly reviewed any discrepancies in identification (which occurred for six capture events). A third author (TM) resolved any disagreement, to achieve final consensus on the identity of each snow leopard. Following concerns raised previously (Johansson et al., Reference Johansson, Samelius, Wikberg, Chapron, Mishra and Low2020), we assessed the accuracy level for snow leopard individual identification using the Snow Leopard Training and Evaluation Toolkit (Snow Leopard Network, 2019). The accuracy levels for our three observers were 94.48%, 89.68% and 86.78%, respectively, from 30 blind, independent trials in which each observer identified 100 photographs of known identity. We assumed this level of accuracy was adequate for abundance estimates. We defined an independent detection event as all photographs and videos of an individual that we obtained at the same camera-trap station within a 30-min period. We constructed individual capture histories using a 24-h sampling occasion length.
Data analysis
Using a maximum-likelihood spatially explicit capture–recapture framework we estimated snow leopard density using the secr package (Efford, Reference Efford2017) in R 4.2.1 (R Core Team, 2022). Spatially explicit capture–recapture is a spatially explicit hierarchical modelling process that combines a state model and an observation model. We used a half-normal detection function for the observation model. We thus assumed that capture probability declined monotonically with distance. We ignored habitat effects on snow leopard density and instead assumed a homogeneous Poisson distribution for latent individual activity centres (Borchers & Efford, Reference Borchers and Efford2008). We used a homogeneous distribution because we were primarily interested in density rather than landscape ecology, and we used a Poisson distribution because snow leopards are territorial and solitary (Darmaraj, Reference Darmaraj2012). We assumed there were no temporal effects on the detection probability of snow leopards during the 3-month survey period.
We used a 24-km buffer around a minimum convex polygon of the survey area to generate the model state space, with potential activity centres spaced at regular intervals of 1.4 km, based on previous recommendations (Alexander et al., Reference Alexander, Gopalaswamy, Kun, Philip and Antoni2015). Based on our field knowledge, we excluded areas outside nature reserves. These areas are unsuitable habitat for snow leopard because of dense human activity. We conducted a closure test (Otis et al., Reference Otis, Burnhan, White and Anderson1978), using the secr package, to evaluate whether the closed population assumption was violated. We fitted three models for the detection functions, including a learned response model (b, where snow leopard detection probability changes depending on previous captures), a site learned effectiveness model (k, where site effectiveness changes once a snow leopard is caught on camera) and a site learned response model (bk, where snow leopard detection probability changes at a particular site once a snow leopard is caught on camera). We used the best-supported model to estimate snow leopard density (D), detection probability (g0) and the spatial scale over which the detection probability declines as the distance between the activity centre of an individual and the camera-trap station increases (σ), and the 95% confidence intervals (CIs) of these parameters. We assessed relative model support using the Akaike information criterion corrected for small sample sizes (AICc; Burnham & Anderson, Reference Burnham and Anderson2002).
Results
We recorded 87 snow leopard captures, of which we discarded three because the captures were within 24 h of a previous capture. We therefore retained 84 captures over 3,024 trap-days, a mean capture success rate of 2.78 captures/100 trap-days. A total of 50 (60%) capture incidences were of insufficient quality to allow individual recognition. The remaining 34 captures were suitable for further analysis, from which we identified 18 individual snow leopards. Ten identified individuals were captured once, four captured twice, two captured three times, one captured four times and one captured six times. We detected the 18 individuals a mean of 1.89 times (range 1–6), and recorded individuals detected more than once at a mean of 2.80 locations (range 1–8). The 18 individual snow leopards captured included a group of three individuals, of which we assumed two to be subadults. We considered these as separate individuals in the analysis.
The closure test supported the assumption that the population was closed during the survey period (z = −0.28, P = 0.34). A constant capture probability (g0) model was the best-fitting model based on AICc (Table 1). The estimated snow leopard density was 2.26 snow leopards/100 km2 (95% CI 1.24–4.18) over an area of 5,484 km2. The detection probability at the activity centre (g0) was 0.04 (95% CI 0.01–0.08) and the scale parameter of the space use submodel (σ) was 5,642 (95% CI 4,835–7,058).
Table 1 Model comparison table using the Akaike information criterion adjusted for small sample sizes (AICc) for spatially explicit capture–recapture models, to estimate snow leopard Panthera uncia density in Machang, central and eastern Qilian Mountains, China (Fig. 1), during January–March 2019.

1 D, snow leopard density; g0, detection probability; σ, spatial scale over which the detection probability declines as the distance between the activity centre of an individual and the camera-trap station increases.
2 Number of model parameters.
3 Difference in AICc to the top-ranked model.
Discussion
Our study provides the first estimate of snow leopard population density in the central and eastern Qilian Mountains, China. This information will support regional and global snow leopard conservation, research and management.
Accurate population and demographic estimates are critical for snow leopard conservation. Our overall density estimate of 2.26 snow leopards/100 km2 is comparable to other published capture–recapture-based estimates for the species (range 0.12–8.49 snow leopards/100 km2; Jackson et al., Reference Jackson, Roe, Wangchuk and Hunter2006, Reference Jackson, Munkhtsong, Mallon, Naranbaatar and Gerelmaa2009; McCarthy et al., Reference McCarthy, Fuller, Ming, McCarthy and Jumabaev2008; Alexander et al., Reference Alexander, Gopalaswamy, Kun, Philip and Antoni2015; Chen et al., Reference Chen, Gao, Wang, Qiong, Cering, Hu and Shi2017; Kachel et al., Reference Kachel, McCarthy, McCarthy and Oshurmamadov2017; Suryawanshi et al., Reference Suryawanshi, Redpath, Bhatnagar, Ramakrishnan, Chaturvedi, Smout and Mishra2017; Chetri et al., Reference Chetri, Odden, Sharma, Flagstad and Wegge2019; Nawaz et al., Reference Nawaz, Khan, Mahmood, Younas, Din and Sutherland2021). This variation in density estimates amongst study sites could reflect true differences in abundance or they could be a result of the methods used, or both. At a relatively low mean altitude and with a high human population density, it would be reasonable to expect a lower snow leopard density in our study area compared to the higher-elevation landscapes of the western Qilianshan National Nature Reserve, for which the density estimate is 3.3 snow leopards/100 km2 (95% CI 1.4–5.3; Alexander et al., Reference Alexander, Gopalaswamy, Kun, Philip and Antoni2015).
Earlier estimates of density based on capture‒recapture models (e.g. McCarthy et al., Reference McCarthy, Fuller, Ming, McCarthy and Jumabaev2008) as well as spatial density estimates for small study areas might be positively biased. A meta-analysis has demonstrated that surveys in small areas and a bias towards studies in good-quality habitat could have overestimated snow leopard densities by up to five times (Suryawanshi et al., Reference Suryawanshi, Khanyari, Sharma, Lkhagvajav and Mishra2019). The spatial coverage of a survey is one of the most important factors affecting the reliability of estimates from spatially explicit capture–recapture models. It has been recommended that a minimum survey area of 573 km2 is required for estimating density reliably (Suryawanshi et al., Reference Suryawanshi, Khanyari, Sharma, Lkhagvajav and Mishra2019). Spatially explicit capture–recapture methods overcome the edge effects that are problematic in conventional capture–recapture methods (Otis et al., Reference Otis, Burnhan, White and Anderson1978), and these models performed well if the trapping arrays were similar to or larger than the mean home range of the species of concern (Sollmann et al., Reference Sollmann, Gardner and Belant2012). The mean 95% minimum convex polygon home range estimate for the snow leopard is c. 500 km2 (Johansson et al., Reference Johansson, Rauset, Samelius, McCarthy, Andrén, Tumursukh and Mishra2016). Our study area (625 km2) was larger than both this and the recommended minimum sampling area of 573 km2, and these areas are larger than those used in most previous estimations of snow leopard density (Jackson et al., Reference Jackson, Roe, Wangchuk and Hunter2006, Reference Jackson, Munkhtsong, Mallon, Naranbaatar and Gerelmaa2009; Alexander et al., Reference Alexander, Gopalaswamy, Kun, Philip and Antoni2015; Chen et al., Reference Chen, Gao, Wang, Qiong, Cering, Hu and Shi2017; Suryawanshi et al., Reference Suryawanshi, Redpath, Bhatnagar, Ramakrishnan, Chaturvedi, Smout and Mishra2017).
An adequate sample size of captured and recaptured individuals is required for analyses of the precision of spatially explicit capture–recapture estimates (Sun et al., Reference Sun, Fuller and Royle2014; Alexander et al., Reference Alexander, Gopalaswamy, Kun, Philip and Antoni2015). A minimum of 10–20 individuals has been suggested as an adequate sample size (Otis et al., Reference Otis, Burnhan, White and Anderson1978), and a minimum of 10 recaptures is required to draw reliable inferences from spatially explicit capture–recapture analysis (Efford et al., Reference Efford, Dawson and Robbins2004). Many previous snow leopard studies have identified < 10 individuals (Jackson et al., Reference Jackson, Roe, Wangchuk and Hunter2006, Reference Jackson, Munkhtsong, Mallon, Naranbaatar and Gerelmaa2009; Chen et al., Reference Chen, Gao, Wang, Qiong, Cering, Hu and Shi2017; Kachel et al., Reference Kachel, McCarthy, McCarthy and Oshurmamadov2017; Suryawanshi et al., Reference Suryawanshi, Redpath, Bhatnagar, Ramakrishnan, Chaturvedi, Smout and Mishra2017; Nawaz et al., Reference Nawaz, Khan, Mahmood, Younas, Din and Sutherland2021). Usable detections were also limited in our study (10 individuals were only captured once and four were captured twice each), highlighting the importance of optimizing captures for individual identification. To counter the main cause of low-quality images, inadequate night-time illumination (Alexander et al., Reference Alexander, Gopalaswamy, Kun, Philip and Antoni2015), we used cameras with flash. However, 60% of the photographs obtained could not be used for individual identification because individual features were washed out by the flash and/or only a part of the body was visible as the animal moved across the camera's field of view. More sensitive and higher definition cameras and lures such as castor or fish oils could be used to increase photograph quality and capture probability, respectively, in future research.
The statistical methods used in spatially explicit capture–recapture modelling are sensitive to trap configuration (Sun et al., Reference Sun, Fuller and Royle2014; Nawaz et al., Reference Nawaz, Khan, Mahmood, Younas, Din and Sutherland2021). The recommendation is that trap spacing be at most the maximum distance moved during the research period (the 2σ rule of thumb; Sun et al., Reference Sun, Fuller and Royle2014). In our study design the 1-km trap spacing was < 2σ (11 km). In addition, individuals are not reliably and accurately identified in many camera-based capture–recapture studies, potentially resulting in systematically inflated population abundance estimates by a third on average (Johansson et al., Reference Johansson, Samelius, Wikberg, Chapron, Mishra and Low2020).
The other constraints of density estimation using spatially explicit capture–recapture modelling relate to the method for determining the effective area surveyed. Following Alexander et al. (Reference Alexander, Gopalaswamy, Kun, Philip and Antoni2015) we excluded areas outside Qilianshan National Nature Reserve identified as unsuitable habitat for snow leopards, based on our field knowledge. Because a snow leopard had been previously observed in forest in Qilianshan National Nature Reserve, we included areas below 3,000 m in our study, even though it has been suggested that snow leopards do not use forest (Snow Leopard Network, 2014). We believe there is a negligible probability of snow leopard activity centres being located outside nature reserves in anthropogenic areas (villages, agricultural lands, roads and development sites) even though snow leopards might have predated on livestock in such locations in our study area.
The snow leopard is an apex predator of high-altitude mountain ecosystems and has the potential to be an iconic indicator of the ecological condition of such settings. Effective snow leopard conservation management requires that snow leopard density estimates are both accurate and precise, and determined with sufficient frequency to facilitate informed decision-making. In this study we estimated snow leopard density using a spatially explicit capture–recapture model based on camera trapping, providing a reliable baseline against which the trajectory of this population can be monitored following any future conservation interventions. Improvements in any future studies, such as increasing camera-trap capture rate and improving photograph quality, would be beneficial. We also recommend that robust study designs using optimization and simulation tools (Dupont et al., Reference Dupont, Royle, Nawaz and Sutherland2020; Durbach et al., Reference Durbach, Borchers, Sutherland and Sharma2020) are adopted.
Acknowledgements
This study was funded by WWF China. We thank the staff of Qilianshan National Nature Reserve, especially K.T. Liao and Y.P. Chen for their support; and two anonymous reviewers for their critiques.
Author contributions
Material development: CZ; fieldwork: CZ, DM; data preparation and analysis: CZ; study design: TM; writing: CZ; revision: TM, DM.
Conflicts of interest
None.
Ethical standards
This research abided by the Oryx guidelines on ethical standards and the research did not involve any human subjects, experimentation with animals and/or collection of specimens.


 Open access