


In recent decades, American household food expenditures have shifted from food at home to food away from home; by 2010, food away from home spending exceeded food at home spending and has continued to increase, particularly in fast-food restaurants(Reference Saksena, Okrant and Anekwe1). Recent estimates suggest that Americans, on average, spend 18 % of household food expenditures at fast-food restaurants(Reference Saksena, Okrant and Anekwe1) and, on a given day, 37 % frequent a fast-food restaurant(Reference Fryar, Hughes and Herrick2). Consuming fast-food meals, which are high in calories, sodium, saturated fat and sugar(Reference Vercammen, Frelier and Moran3), is associated with higher energy intake and lower diet quality among children and adults(Reference Powell and Nguyen4,Reference Nguyen and Powell5) and obesity among adults(Reference Liu, Rehm and Micha6). Further, adult fast-food consumers obtain approximately 26 % of their calories from fast food(Reference Liu, Rehm and Micha6). US studies have highlighted disparities, noting men, younger adults and non-Hispanic blacks are more likely to consume fast food(Reference Fryar, Hughes and Herrick2,Reference Liu, Rehm and Micha6) and adverse impacts of fast-food consumption on diet are larger for lower- and middle-income populations and non-Hispanic blacks(Reference Powell and Nguyen4,Reference Nguyen and Powell5) .
Fast-food consumption is also associated with greater sugar-sweetened beverage (SSB) consumption(Reference Powell and Nguyen4,Reference Sharkey, Johnson and Dean7) , which is linked to obesity, type 2 diabetes and CVD(Reference Malik, Popkin and Bray8). SSB are the leading source of added sugar in the American diet(Reference Bowman, Clemens and Friday9,Reference Bowman, Clemens and Friday10) and are widely available in fast-food restaurants. In fact, between 2003 and 2016, 14 % of SSB consumed in the USA were included with a fast-food meal purchase(Reference Liu, Rehm and Micha6). Fast-food restaurants often employ marketing strategies to encourage SSB purchases. SSB are usually bundled with meals(Reference Vercammen, Frelier and Moran3), and pricing strategies are often used to incentivise larger portion sizes; examples include reducing the price/unit as size increases (i.e. supersized pricing), offering unlimited consumption for a fixed price (e.g. free refills) and charging one price for all sizes(Reference Haws, Liu and Dallas11). These practices are likely profitable as soda, for example, is inexpensive to produce, especially when sold as a fountain drink (costing approximately 1 cent/ounce (oz))(Reference Nestle12).
To reduce SSB consumption and improve health outcomes, SSB taxes are increasingly being implemented worldwide(13). The primary channel through which SSB taxes aim to discourage consumption is by raising SSB prices. Additionally, public health campaigns associated with SSB taxes may raise awareness of the detrimental health effects of SSB, and tax revenue may fund public health initiatives. Studies evaluating tax pass-through, the extent to which prices increase as the result of a tax, have mostly examined food stores and have found variation in pass-through rates, including by store type, beverage type and package size(14). To our knowledge, only four studies have estimated pass-through to beverages sold in fast-food restaurants and none has done so outside the USA. A Boulder, Colorado, study estimated a pass-through rate of 49 and 69 % to fountain drink prices at 1- and 3-month post-tax, respectively(Reference Cawley, Crain and Frisvold15). Two Seattle, Washington, studies estimated an overall pass-through rate of 82 and 113 % to taxed beverages at 6-month and 1-year post-tax, respectively, and found no significant changes in prices of untaxed beverages(16,Reference Saelens, Rowland and Qu17) . Most recently, an Oakland, California, study estimated 82 % pass-through to bottled regular soda but found no impact for fountain drinks at 1-year post-tax(Reference Marinello, Pipito and Leider18).
This study is the first to provide longer-run evidence of SSB tax pass-through in fast-food restaurants. Specifically, we estimated price changes of bottled regular soda, bottled diet soda, bottled unsweetened beverages and fountain drinks 2 years after a 1 cent/oz excise tax on SSB (≥25 kcal/12 fluid oz) was implemented in Oakland, California, on 1 July 2017.
Methods
Study sample and measures
Study sample and measures are summarised in this section; for further details see Marinello et al. (Reference Marinello, Pipito and Leider18). Chain and non-chain fast-food restaurants were selected with geographic random sampling in Oakland, California, the intervention site, and Sacramento, California, the comparison site. Data were collected in-person 1-month pre-tax (May/June 2017) and 2-year post-tax (June 2019) using the Beverage Tax Fast-Food Restaurant Observation Form(19), which has high inter-rater reliability(Reference Li, Leider and Pipito20). The price measure was equal to each product’s posted price, defined as the regular price, unless there was a reduced-price sale (other sales were not considered because they usually do not have a constant price/unit).
Data collection and analytical sample
In both sites, baseline data were collected at sixty-five restaurants 1-month pre-tax. At 2-year post-tax, fifty-seven and fifty-four of these restaurants were audited again in Oakland and Sacramento, respectively. Restaurants were not audited 2-year post-tax if data collectors were asked to leave (n 1 Oakland; n 2 Sacramento), no audit form products were available (n 2 Oakland; n 1 Sacramento), the restaurant was closed (n 4 Oakland; n 7 Sacramento) or the restaurant no longer met fast-food restaurant criteria or became a different restaurant (n 1 Oakland; n 1 Sacramento). Analyses were conducted for four beverage types: bottled regular soda, bottled diet soda, bottled unsweetened beverages (hereafter referred to as regular soda, diet soda and unsweetened beverages) and fountain drinks. Data for regular soda, diet soda and unsweetened beverages were collected by brand and size (e.g. Coke 12 oz), while fountain drinks were collected by size (e.g. medium), where oz were restaurant-specific.
In total, 166, 128, 200 and 408 products were available for regular soda, diet soda, unsweetened beverages and fountain drinks, respectively. To obtain the analytical sample, observations were excluded if information necessary for calculating price/oz was missing. Missing price or sales data resulted in the exclusion of 44, 37, 44 and 43 observations for regular soda, diet soda, unsweetened beverages and fountain drinks, respectively; 126 (75 %) of these observations were missing because prices were not shown, and the remainder were missing for unknown reasons. For fountain drinks, information on available oz was carried over across time periods to missing values within the same restaurant and size category. Attempts to collect or confirm data were made via telephone if oz were missing in all time periods or there were inconsistencies over time. After this process, twenty-nine fountain drink observations were excluded due to missing oz.
The primary analysis used a balanced sample (restricted to products with price/oz data at baseline and 2-year post-tax within a given restaurant). Balancing eliminated differences in product composition, which could affect price/oz (see sample sizes in Table 2). A secondary analysis used the unbalanced sample (see sample sizes in Table 3). While the unbalanced, unsweetened beverage sample included water, milk, 100 % juice and unsweetened tea, the balanced sample only included water and milk. Restaurant characteristics of the balanced analytical samples are provided in Table 1.
Table 1 Mean price per ounce of beverages in fast-food restaurants in Oakland, CA, and Sacramento, CA, and characteristics of fast-food restaurants before and 2 years after implementation of the Oakland sugar-sweetened beverage tax
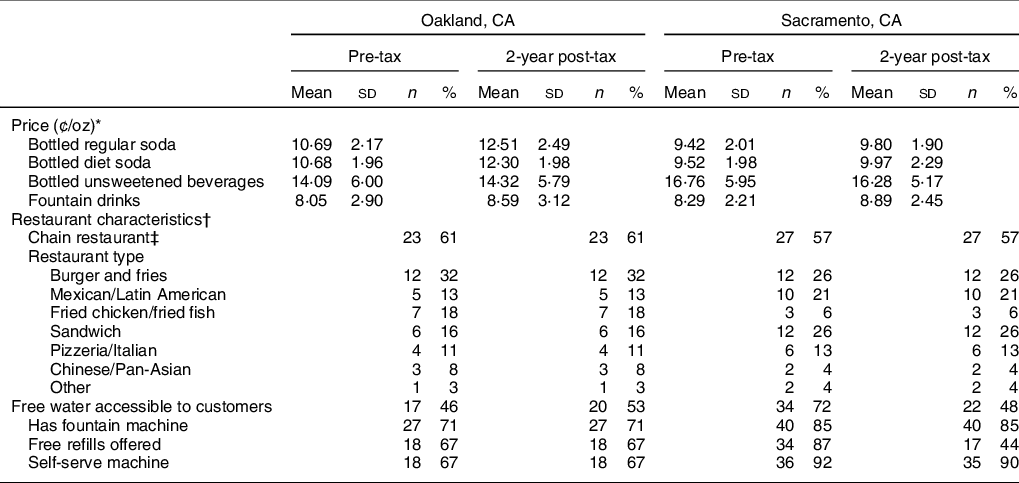
* The number of bottled regular soda products (with number of restaurants in parentheses) per time period was 20 (15) and 16 (15) in Oakland and Sacramento, respectively. The number of bottled diet soda products (with number of restaurants in parentheses) per time period was 14 (11) and 8 (8) from Oakland and Sacramento, respectively. The number of bottled unsweetened products (with number of restaurants in parentheses) per time period was 8 (6) and 27 (13) from Oakland and Sacramento, respectively. The number of fountain drink products (with number of restaurants in parentheses) per time period was 58 (26) and 88 (38) in Oakland and Sacramento, respectively.
† Due to some missing data on restaurant characteristics, denominators are lower for some items. Summary statistics on restaurant characteristics are shown for restaurants included in any of the four analyses: 38 in Oakland and 47 in Sacramento, respectively.
‡ Restaurants were defined as a chain if they offered franchise opportunities or had corporate headquarters.
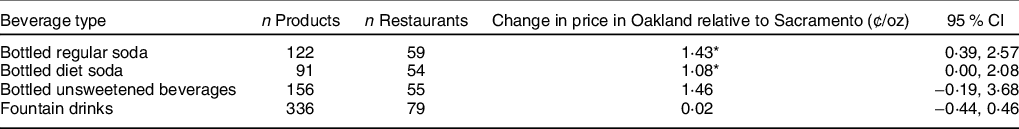
Table 2 Balanced sample difference-in-differences tax pass-through estimates 2-year post-tax in fast-food restaurants with 95 % CI†

* Estimates are significant at the P < 0·05 level.
† Each row contains results and sample sizes from separate difference-in-differences linear regressions by beverage category, controlling for restaurant and product fixed effects. Standard errors were bootstrapped and clustered on restaurant, and bias-corrected CI are shown. There are a total of 85 unique restaurants across the four analytical samples. Of these restaurants, 35 % (n 30), 22 % (n 19), 22 % (n 19) and 75 % (n 64) were included in the regular soda, diet soda, unsweetened beverage and fountain drink models, respectively.
Table 3 Unbalanced sample difference-in-differences tax pass-through estimates 2-year post-tax in fast-food restaurants with 95 % CI†
* Estimates are significant at the P < 0·05 level.
† Each row contains results and sample sizes from separate difference-in-differences linear regressions by beverage category, controlling for restaurant and product fixed effects. Standard errors were bootstrapped and clustered on restaurant, and bias-corrected CI are shown.
Statistical analysis
A difference-in-differences analysis of the intervention site (Oakland) relative to the comparison site (Sacramento) was used to estimate the causal effect of the tax on beverage prices in fast-food restaurants. The primary assumption required for an unbiased estimate is that, in the absence of the tax, the difference in beverage prices between Oakland and Sacramento would have remained constant during the post-tax period (i.e. parallel trends). Previous work assessed this assumption by testing differences in soda price trends in food stores between Oakland and Sacramento 1-year pre-tax; results revealed no statistically significant differences(Reference Marinello, Pipito and Leider18).
Separate linear regression models with bootstrapped standard errors were estimated for regular soda, diet soda, unsweetened beverages and fountain drinks. Observations were clustered at the restaurant level to account for correlations between products from the same restaurant. Models included an indicator for the treatment period (2-year post-tax) and an interaction between this indicator and an indicator for the intervention site (Oakland), as well as restaurant and product fixed effects. Inclusion of restaurant and product fixed effects eliminated potential bias from unobserved time-constant restaurant and/or product characteristics correlated with price. In the fountain drink model, product fixed effects were computed based on categories <25 oz, 25–34 oz and ≥35 oz. The data were analysed in Stata/SE 15.0 (StataCorp).
Results
Table 1 shows mean price/oz in Oakland and Sacramento at baseline and 2-year post-tax by beverage type for the balanced sample. In both sites and time periods, the mean price/oz was highest for unsweetened beverages, followed by bottled soda, and then fountain drinks.
Difference-in-differences regression estimates for the balanced analytical samples are shown in Table 2. The estimated changes in price for regular and diet soda were 1·44 (95 % CI 0·50, 2·73) and 1·17 (95 % CI 0·07, 2·13) cents/oz, respectively; the regular soda estimate represents a tax pass-through rate of 144 %. The difference in price effects between regular and diet soda was not statistically significant at the 5 % level. Results from the unsweetened beverage model suggest that prices may have increased; however, the estimate was not statistically significant. The estimated tax pass-through to fountain drinks was virtually zero and not statistically significant.
Results for the unbalanced samples, shown in Table 3, were nearly identical for regular soda, diet soda and fountain drinks. For unsweetened beverages, the estimated change in price was substantially larger than the balanced sample estimate (which may have been due to differences in product composition), but remained statistically insignificant.
Discussion
This study is the first to estimate longer-term impacts of any SSB tax on prices of beverages sold in fast-food restaurants, which are a major source of SSB. Two years following the implementation of the Oakland, California, tax, regular soda prices had increased by 1·44 cents/oz (144 % tax pass-through) and diet soda prices increased by 1·17 cents/oz. No statistically significant changes in unsweetened beverage or fountain drink prices were found; additionally, the fountain drink estimate was almost zero.
Some differences were found between this study and previous findings on tax pass-through in fast-food restaurants. Compared with our study findings for Oakland at 1-year post-tax(Reference Marinello, Pipito and Leider18), pass-through to regular soda increased substantially (82 to 144 %), the price increase of diet soda became statistically significant and pass-through to fountain drinks remained non-statistically significant. The Boulder study found partial pass-through to fountain drink prices(Reference Cawley, Crain and Frisvold15), whereas we did not. Both Seattle studies found evidence of pass-through to taxed beverages but no evidence of increases in prices of untaxed beverages, whereas we found higher prices for untaxed diet soda(16,Reference Saelens, Rowland and Qu17) . However, comparisons to the Seatttle studies are difficult because those studies did not estimate pass-through by beverage type or separately for fountain drinks. The present findings are similar to an Oakland food store evaluation, which estimated 127 % pass-through to regular soda, a price increase of 0·78 cents/oz for diet soda, and no statistically significant changes in single-serving unsweetened beverage prices(Reference Falbe, Lee and Kaplan21). However, our findings differ from another Oakland food store evaluation that only found partial pass-through to regular soda (63 %)(Reference Cawley, Frisvold and Hill22).
This study highights important considerations for understanding the effectiveness of the Oakland SSB tax in reducing SSB consumption at fast-food restaurants. First, it appears that restaurants are not price differentiating between regular and diet soda (since prices of both increased post-tax implemenatation), which eliminates any potential price incentive for consumers to substitute from calorically sweetened soda (taxed) to non-calorically sweetened soda (untaxed). However, the increase in regular and diet soda prices may encourage consumers to switch to unsweetened beverages, such as bottled water. Second, there is no indication that restaurants are increasing fountain drink prices. Given fountain drink profit margins are exceedingly high(Reference Nestle12), restaurants may be absorbing the tax. It is also possible that restaurants are spreading the tax to non-beverage menu items.
This study has a number of strengths including a long follow-up period and the use of a matched comparison site, which allowed us to account for secular trends and time-constant confounders. Nevertheless, this study is limited by small samples of (1) unsweetened beverages, preventing the examination of price effects by beverage type, and (2) diet soda, though we did find a statistically significant effect. Additionally, this study only assessed certain brands and beverage types and did not evaluate potential effects on meal prices. Finally, the study results may not be generalisable to other jurisdictions.
Conclusion
Overall, this study provides evidence on longer-term, 2-year post-tax effects of SSB taxes in fast-food restaurants. Study results suggest that the Oakland SSB tax raised the prices of regular and diet soda and had no impact on fountain drink prices. Findings highlight the importance of examining longer-term effects and suggest that SSB taxes may not effectively reduce fast-food restaurant SSB consumption. Policymakers may want to consider complementary restaurant measures to reduce consumption; examples include imposing higher taxes on fountain drink syrup, restricting fountain drink cup sizes and banning free refills.
Acknowledgements
Acknowledgements: Not applicable. Financial support: This work was supported by the Bloomberg Philanthropies’ Obesity Prevention Initiative (www.bloomberg.org) (grant number 49255). Bloomberg Philanthropies had no role in the design, analysis or writing of this article. Conflict of interest: None. Authorship: S.M.: Prepared and analysed the data, assisted with developing methods and interpreting data, and drafted the manuscript with support from all authors. A.A.P.: Assisted with the acquisition of the data and edited the manuscript. J.L.: Assisted with developing the methods, preparing and analysing the data, interpreting data and editing the manuscript. O.P.: Assisted with developing the methods, interpreting data and editing the manuscript. L.M.P.: Conceived and designed the study, acquired funding, developed the data acquisition methods, assisted with developing methods and interpreting data, and edited the manuscript. Ethics of human subject participation: Not applicable.


