Introduction
Air bubbles in polar ice sheets are formed when firn changes into ice. The gas composition included in the bubble is essentially the same as that of the atmosphere at the time of pore close-off. Analyses of the gas composition in ice cores then allow us to investigate previous climatic conditions
However, all air bubbles disappear below several hundreds of meters depth, for example, below 1200 m depth in the Byrd Station ice core, Antarctica (Reference Gow, Ueda and GarfieldGow and others, 1968). Reference MillerMiller (1969) suggested that the air-hydrate might exist in bubble-free ice. Reference Gow and WilliamsonGow and Williamson (1975) reported the detailed air-bubble characteristics of Byrd Station ice cores and they discussed the arguments for and against gas-hydrate formation. Air-hydrate inclusions had been discovered in fresh Dye-3 ice cores, Greenland, deeper than about 1100m by Reference Shoji and LangwayShoji and Langway (1982). Their discovery verified that air-hydrates had maintained previous atmospheric gases in deeper parts of the ice sheet
Air-hydrate is a small and transparent substance, whose diameter is as small as a few hundreds μm. The air-hydrate crystal is stable under conditions of high pressure and low temperature. Air-hydrate is the crystalline molecular complex formed from the mixture of water and atmospheric gases. X-ray diffraction studies of airhydrates obtained from the Dye-3 ice core (Reference Hondoh, Anzai, Goto, Mac, Higashi and LangwayHondoh and others, 1990) revealed that their crystal structure was cubic while the surrounding ice lattice was hexagonal. They also showed that water molecules formed two types of cage: 16-hedral “large cage” and 12-hedral “small cage”.
The depth distributions of both air bubbles and airhydrate crystals were studied in detail in the Vostok ice cores (Reference LipcnkovLipenkov, 1989;Reference Uchida, Hondoh, Mae Lipenkov and DuvalUchida and others, 1994 ). They revealed that the transformation of air-hydrate crystals from air bubbles progressed gradually with depth, In the Vostok ice, air-hydrate crystals began to form at about 500 m depth and air bubbles disappeared completely by 1250 m. Both air bubbles and air-hydrate crystals co-exist in this depth range, referred to here as the transition zone. This depth range corresponds to about 60000 years (Reference LoriusLorius and others, 1985). The transition zone has been observed in other deep ice cores (Reference Shoji and LangwayShoji and Langway, 1987 Reference Lipenkov, Salamatin and GrigoryevaLipenkov and others, 1989; )
As mentioned above, the air-hydrate crystal is the main storage of ancient atmospheric gases in a deeper region of the ice sheets. However, it is not well-known whether the gas compositions are the same between the air-hydrate crystal and the original air bubble. Moreover, the transformation from air bubbles to air-hydrate crystals is one of phase change. One should then examine whether the gas compositions in the air-hydrate crystals are the same as those before their transformation
The spectroscopic analysis of the natural air-hydrate crystals (Reference Nakahara, Shigesato, Higashi, Hondoh and LangwayNakahara and others, 1988) revealed that the crystals mainly included N2 and O2 molecules. It also revealed that the composition ratio of N2 and O2 in the air-hydrate, N2/O2, was about 1.7, which was markedly smaller than the ratio 4 in the present-day air. X-ray diffraction studies of air-hydrate crystals (Reference Hondoh, Anzai, Goto, Mac, Higashi and LangwayHondoh and others, 1990) revealed that the occupancy of air molecules in each cage was about 0.8. Optical microscopic observation of the transformation process of an air-hydrate crystal from an air bubble (Reference Uchida, Hondoh, Mae, Duval and LipenkovUchida and others, 1992) revealed that air-hydrate crystals observed in ice sheets were formed by pressurization of air bubbles. An air-hydrate crystal is, therefore, the main storage of ancient atmospheric gases in a deep ice core but its composition may change with a phase change
In the present study, we carried out experimental studies on the transformation process at various pressures and temperatures to find the elementary process of the transformation from an air bubble to an air-hydrate crystal. The results show that the transformation rate is determined mainly by diffusion of water molecules. The results also enable us to estimate the transformation rate at an arbitrary pressure and temperature. Then, we have estimated the transformation period of an air bubble into an air-hydrate crystal at a middle depth in the transition zone of the Vostok Station ice and we also discuss the formation of the transition zone
Experimental Methods and Results
Specimens (about 20 mm ×20 mm ×5 mm) were prepared from the Vostok Station ice core (1514m), which included secondary air bubbles. The bubbles were formed by the air-hydrate dissociation after ice recovery from the ice sheet, because no bubbles were observed in the fresh Vostok Station ice core deeper than 1250 m (Reference LipcnkovLipenkov, 1989). We expected that bubbles had maintained the structures of the clathrate hydrate and that they had had sufficient air molecules to be reconstructed under high hydrostatic pressures
The experimental apparatus was the same as that of the previous study (Reference Uchida, Hondoh, Mae, Duval and LipenkovUchida and others, 1992). Experiments were conducted at temperatures (T) that ranged from 254.7 to 269.7 K over pressures (p) ranging from 10 to 20 MPa. The excess pressure, P - Pe, ranged from about -1 to 8 MPa, wherePe was the dissociation pressure of the air-hydrate calculated by Reference MillerMiller (1969). Pressures were maintained within ± 1 MPa during each experiment which continued for more than 1 week
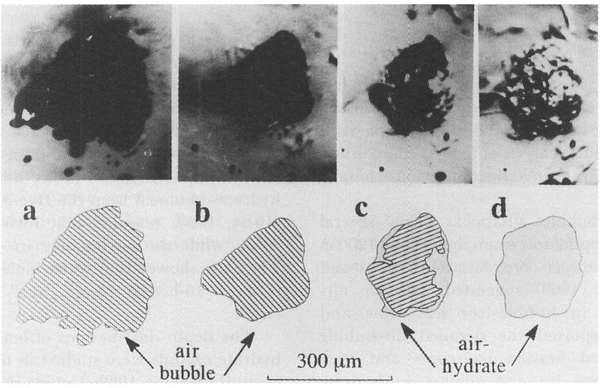
The transformation from an air-bubble to an air-hydrate crystal was observed only when P was higher than Pe, that is, P-Pe, was positive. Figure 1 shows the typical transforming process of an air bubble (opaque) into an air-hydrate (transparent). The experimental conditions were T= 269.9 K and P = 18 MPa. The rapid shrinkage of the bubble occurred just after pressurization (Fig. laandFig. lb ), and it went on for a few hours. This rapid shrinkage was caused by the plastic deformation of the surrounding ice driven by the difference between the bubble pressure and the applied one. Subsequently, the air-hydrate began to transform from the boundary between the ice and the bubble (Fig. 1c), and the boundary between air-hydrate and bubble progressed toward the center of the air bubble. The transforming process took more than 1 week to complete(Fig. ld). We observed several air bubbles in the same specimen simultaneously and recorded the change of their outlines

Fig. 1. Photographs and their illustrations of the transformation process of an air bubble into an air-hydrate at 269.9 K and 18 MPa. a. Before pressurization; bubbles were opaque; b. 1 h after pressurization; c. 78 h, air-hydrate crystal (transparent) was growing; d. 164 h, the bubble transformed into air-hydrate completely
To estimate the transformation rate of the crystal, the cross-sectional areas of both the air-hydrate and air bubble were measured on each photograph. Then the radius of the sphere which had the same cross-sectional area of either air-hydrate or the sum of air-hydrate and bubble was calculated. The changes of the radii of air-hydrate, r, and the sum of air-hydrate and air bubble,R, are illustrated in Figure 2. This figure shows that R is almost constant during the transformation after the first rapid shrinkage of the air bubble. On the other hand, r does not change at first for several hours, and then it increases almost linearly with time. The transforming rate of air-hydrate, vt, was calculated from the slope of the line in Figure 2
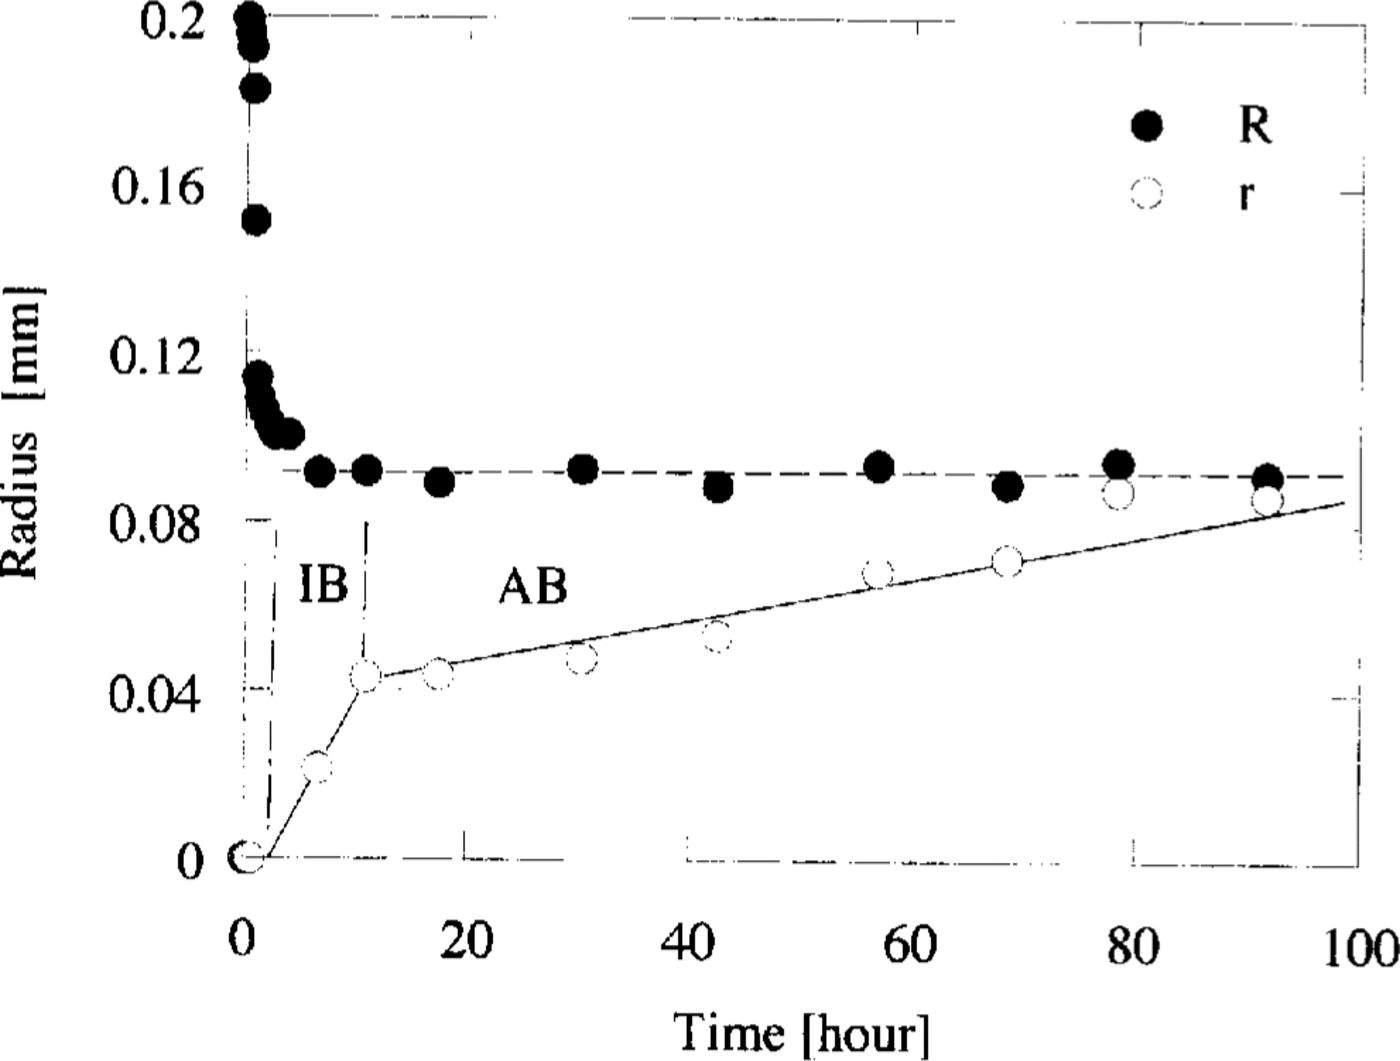
Fig. 2. The variations of radii R and r with time, where R is the radius of the equivalent sphere of the sum of air-hydrate and bubble, and r is that of air-hydrate. At the time interval of IB, the transformation of air-hydrate progressed along the boundary between ice and the bubble. Subsequently, the boundary between the air-hydrate and the bubble grew into the bubble at AB interval. The slopes of the lines represent the transforming rate of air-hydrate, v t IB and vt AB, respectively.
We distinguish two intervals in the transformation period: the IB interval for the fast transformation period and the AB interval for the subsequent period. During the time interval of IB, the transformation of air-hydrate progressed along the boundary between ice and the bubble. Subsequently, at the AB interval, the boundary between air-hydrate and the bubble grew into the air bubble. Figure 2 shows the transforming rate during the IB interval, v t IB, is larger than that during the AB interval,v t AB
Then we considered the pressure-dependence of v t. As the experiments were carried out at various temperatures, the excess pressure, P-Pe, was used instead of the experimental pressure, P. Figure 3 illustrates the relationship between v t AB andP-Pe. The relationship between v t IB and P-Pe is almost the same figure as given in Figure 3. We distinguish the data obtained from the experiments of different temperatures by the different symbols in this figure. Each data point is the mean value of v t AB obtained in the same specimen. Error bars show the maximum difference between the mean value and each experimental value. This figure shows that vt depends linearly on P-Pe and that v t=0 whenP = Pe. The dashed line at each temperature was calculated by fitting the data to the equation as follows:
where Ki is the reaction-rate constant at i interval, and i is either IB or AB.
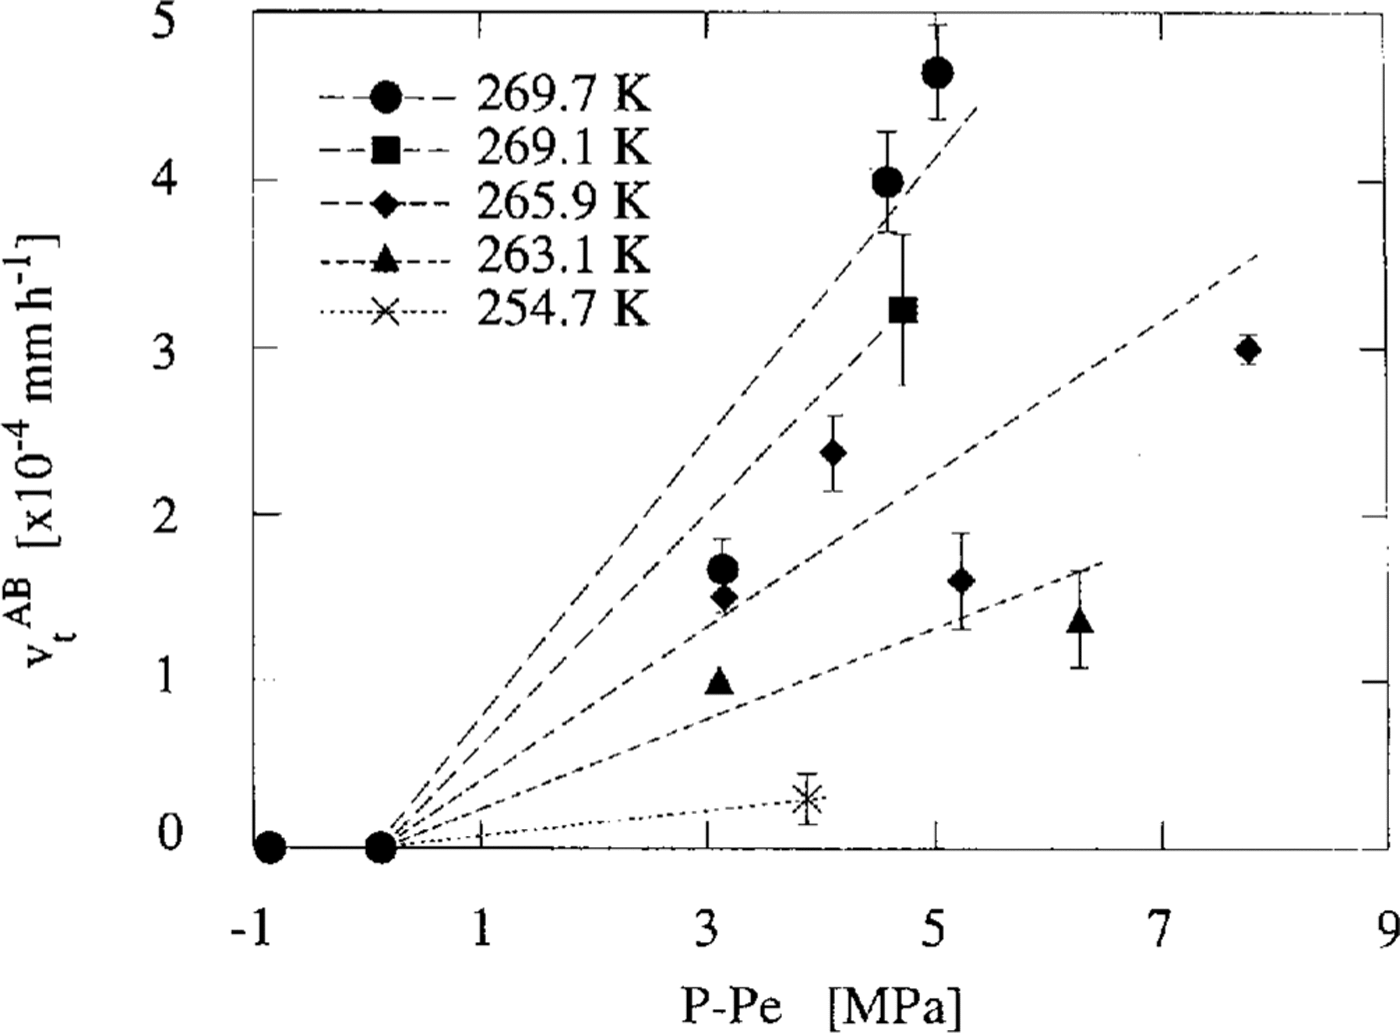
Fig. 3. Mean transforming rates of the air-hydrate vt AB against excess pressure P-Pe at 269.7 K (denoted by the solid circles), 269.1 K (square),265.9 K(diamond),263.1 K (triangle) and 254.7 K (cross). Error bars show the mean standard deviations obtained by the calculation of vt
The temperature-dependence of Ki indicates that of the transformation rate. The Ki calculated by Equation (1) are plotted in terms of the Arrhenius plot inFigure 4.The straight line in Figure 4 obtained by the least-squares method can be expressed by the following equation:

Fig. 4. Arrhenius plot of the reaction Constants KIBand KABfor the crystal growth of air-hydrate. Each data point was calculated by Equation (1)
where K 0i is a pre-exponential factor,E i is the activation energy for the reaction at i interval andk is the Boltzmann constant. The values of K 0i; and E i obtained are as follows: K 0IB= 1.1×106mm h-1 MPa-1,E IB = 0.52±0.17 eV K 0AB = 5.1×10¹²mmh-1 MPa-1,E AB = 0.90± 0.10eV
Discussion
The transformation process of air-hydrates from air bubbles
Microscopic observations showed that an air bubble transforms to an air-hydrate crystal. Figure 3 shows that higher hydrostatic pressure than the dissociation one is necessary for the transformation process and that the transformation rate v t is proportional to the excess pressure P-Pe. These results suggest that the driving force of the crystal growth of air-hydrates is P-Pe.
The observations showed that the total radius R did not change during the transformation from air bubbles to air-hydrates. This result suggests that the air molecules included in the air bubble are sufficient to reconstruct the air-hydrate crystal. Water molecules in the bubble are, on the other hand, too small to reconstruct the air-hydrate crystal if the partial pressure of water vapor is equivalent to the equilibrium vapor pressure with ice. For the reconstruction it is necessary to supply water molecules from other places. The activiation energy for the transformation rate at the AB interval, E AB, is about two times larger than E IB. This suggests that the kinetic process of the air-hydrate construction does not determine the transformation rate. It is, therefore, considered that the rate-determining process of the transformation from air bubbles to air-hydrate crystals is mainly the additional process of supplying water molecules to the transformation sites.
This additional process of supplying water molecules to the transformation site at the IB interval is considered to be that the water molecules diffuse directly from the surrounding ice lattice. This is because the transformation site is the boundary between the ice and the bubble. The activation energy of the transformation during the IB period, E IB, is about 0.52 eV. This value is well in agreement with the activation energy of the self-interstitial of the ice, E sd = 0.56eV (Reference Goto, Hondoh and HigashiGoto and others, 1986). The rate-determining process of the transform-ation during the IB interval is, therefore, considered to be the diffusion process of the self-interstitial in the ice lattice
On the other hand, during the AB interval, the water molecules have to diffuse through the hydrate lattice to reach the transformation sites, or the boundary between the air-hydrate and the bubble. The larger value of E AB than E IB indicates that there are high energy barriers for the diffusion of water molecules through the hydrate lattice. Now we assumed that water molecules diffuse through the lattice of the air-hydrate. A water molecule included in a cage can move to the next one only when the next cage includes no molecules. The cage occupancy of gas molecules in the air-hydrate crystal is about 0.8 (Reference Hondoh, Anzai, Goto, Mac, Higashi and LangwayHondoh and others, 1990), so the existence of gas molecules in cages may be an energy barrier for the diffusion of water molecules through the hydrate lattice. Moreover, Reference Hondoh and UchidaHondoh and Uchida (1992) have pointed out that a water molecule included in a small cage cannot move without substitution by another water molecule constructing the hydrate lattice. This may also make the activation energy higher
As for the value Pe, we use the equation given by Reference MillerMiller (1969). Reference Shoji and LangwayShoji and Langway (1987) have suggested that air-hydrates in some deep ice-core samples exist at a slightly greater depth than expected, which corresponds to the dissociation pressure of N2 hydrate. According to this, Peshould be the dissociation pressure of N2 hydrate. However, the difference between the dissociation pressures of air-hydrate and N2 hydrate is less than 0.65 MPa in the present study. This value is smaller than the pressure variation during each experiment, ± 1 MPa. Therefore, we cannot determine whether Pe is either the dissociation pressure of air-hydrate or that of N2 hydrate
The transformation rate of air-hydrate crystals in the ice sheet
Using Equations (1) and Equations (2) for the AB interval, we can estimate the transformation rate of air-hydrate crystals in the ice sheet at Vostok Station. At a depth of 900 m, which is about the center of the transition zone, the temperature in the borehole was about 223.1 K Reference Ritz(Ritz, 1989), and the hydrostatic pressure was about 7.8 MPa. The dissociation pressure of air-hydrate at this temperature is calculated as about 3.7 MPa; then the excess pressure P-Pe = 4 1 MPa. The estimated transformation rate of an air-hydrate from an air bubble under these conditions is vt (900m) = 9.6×10⁻⁸ mmh-l. The mean radius of an air bubble included in a 900 m ice core was measured as about 0.05 mm (Reference LipcnkovLipenkov, 1989). Then it takes about 60 years for the transformation of an air bubble into an air-hydrate crystal. This indicates that the transformation period from an air bubble to an air-hydrate crystal is sufficiently short compared with the period of the transition zone, about 60 000 years (Reference LoriusLorius and others, 1985).
The transformation process of air-hydrate crystals in the ice sheet at Vostok Station may be illustrated as follows. At a depth of about 500 m, the bubble pressure reaches the dissociation pressure of air-hydrate. An air bubble transforms into an air-hydrate soon after nucleation. Some bubbles transform into air-hydrate at the same depth, but others cannot transform because of the difficulty of nucleation of air-hydrate crystals at the boundary between the ice and the bubble. The difference of the transformation depth of each air bubble may form the transition zone.
The transition zone can be attributed to the difficulty of the nucleation of the air-hydrate crystal. Figure 2 shows that the transformation from an air bubble into an air-hydrate requires several hours after rapid shrinkage of the bubble has been completed. This may indicate the difficulty of the nucleation of air-hydrate crystals even on to the bubble formed by the dissociation of the original air-hydrate. Reference Shoji and LangwayShoji and Langway (1987) have proposed that the transformation process between air-hydrate and bubble is strongly controlled by the nucleation process. Recent experimental investigation (Reference Ikeda, Uchida and MacIkeda and others, 1993) has shown that the nucleation of air-hydrate on an air bubble was sensitive to pressure.
Acknowledgements
The authors would like to acknowledge all Russian and French participants in the drilling, the field work and ice sampling of the Vostok ice core. We are grateful to the late Professor T. Kuroda and Dr.J. Ocampo for helpful discussions. Some of the experimental apparatus for this study was supported by Mitsubishi Heavy Industries, Ltd. The present work was supported financially by the Asahi Glass Foundation and the Japanese Science and Technology Agency.