Introduction
At the bases of glaciers that rest on unlithified sediment, motion is by some combination of pervasive bed deformation, ploughing and sliding (e.g. Reference AlleyAlley, 1989). It is necessary to distinguish between these mechanisms to develop a physically based constitutive relation for basal motion and to assess the dominant mode of basal sediment transport. Since the influential geophysical work on Ice Stream B, West Antarctica (Reference Blankenship, Bentley, Rooney and AlleyAlley and others, 1986; Reference Blankenship, Bentley, Rooney and AlleyBlankenship and others, 1986), many studies have advocated bed deformation as the primary mechanism of basal motion, sediment transport or both (e.g. Reference AlleyAlley, 1989, 1991; Reference BoultonBoulton, 1996; Hooke and Reference Hooke and ElverhøiElverhøi, 1996; Reference Ho, Vela, Jenson, Clark, Sheahan and KaliakinJenson and others, 1996).
Not surprisingly, limited observations indicate that the distribution of motion in glacier beds is variable. For example, time-averaged measurements beneath the terminus of Breiðamerkurjökull, Iceland, by Reference Boulton and HindmarshBoulton and Hindmarsh (1987) suggested that pervasive bed deformation accounted for about 90% of the glacier’s motion. In contrast, subsequent continuous measurements of sliding at Trapridge Glacier, Yukon Territory, Canada (Reference Blake, Fischer and ClarkeBlake and others, 1994; Reference FischerFischer, 1995), and of bed deformation at Storglaciären, Sweden (Reference Iverson, Hanson, Hooke and JanssonIverson and others, 1995; Reference Hooke, Hanson, Iverson, Jansson and FischerHooke and others, 1997), indicated that during periods of rising basal water pressure there was significant motion at or near the glacier sole that exceeded that due to deformation of the bed. Similarly, a recent experiment at the bed of Ice Stream B, where water pressure is continuously high, suggested that 83% of the basal motion was focused within 30 mm of the glacier sole (Reference Engelhardt and KambEngelhardt and Kamb, 1998). In all cases, the extent to which these measurements reflect the typical distribution of motion beneath the ice mass in question is unknown.
A glacier can deform its bed pervasively only if the shear stress that can be supported by the ice/sediment interface exceeds the strength of the sediment. Most authors have argued that there should be such deformation if sediment is weakened sufficiently by high pore-water pressure. This might be particularly true for till beds, which are expected to have a high density of clasts at the bed surface with diameters near the controlling obstacle size of sliding theories (e.g. Reference WeertmanWeertman, 1964); the coupling between the ice and the bed, in that case, might be strong, favoring bed deformation (Reference Boulton and HindmarshBoulton and Hindmarsh, 1987; Alley. 1989). High water pressures that weaken basal till, however, should also enhance sliding Sliding may also be favored if clasts near the controlling obstacle size are driven into the bed as a result of high basal melt rates and the consequent bed-normal drag on such clasts (Reference HalletHallet, 1979; Reference IversonIverson, 1990). The partitioning of basal motion is further clouded by the effect of high pore-water pressure on ploughing (Reference Brown, Hallet and BoothBrown and others, 1987; Reference AlleyAlley, 1989), a process that may allow motion to be focused at or near the glacier sole, despite high bed roughness.
Given these uncertainties, any prediction of the dominant mechanism of basal motion is questionable without empirical constraints on the shear stress supported locally by the ice/till interface. Although the strength of till has been measured in the laboratory (Reference KambKamb, 1991; Reference Ho, Vela, Jenson, Clark, Sheahan and KaliakinHo and others, 1996; Reference Hooke, Hanson, Iverson, Jansson and FischerIverson and others, 1997, 1998) and estimated in the field (Reference Humphrey, Kamb, Fahnestock and EngelhardtHumphrey and others, 1993; Reference Blake, Fischer and ClarkeFischer and Clarke, 1994; Reference Iverson, Jansson and HookeIverson and others, 1994), the local shear stress on the bed, which may, of course, be less than the till strength, has not been measured reliably.
Herein, it is argued that the elasticity of granular materials provides an in situ record of the local shear stress on the bed. If temporal variations in this stress result in the build-up or release of elastic strain in the bed, as was recently included in a stick–slip sliding model by Reference Fischer and ClarkeFischer and Clarke (1997), and if this strain can be distinguished from permanent deformation, then records of till shear strain can be used with appropriate elastic moduli to determine the local shear stress. The till, in effect, serves as a crude load cell.
In this paper, we discuss laboratory measurements of the elasticity of till collected from beside Storglaciären, a valley glacier in northern Sweden. These results are then reconciled with those obtained by different techniques on similar materials. These measurements are used to calculate the local shear stress on the bed of Storglaciären from a record of bed shear strain obtained with a tiltmeter. Shear stresses are then compared with a simultaneous record of fluctuating basal water pressure to obtain a relation between the applied shear stress and effective pressure on the bed. In a companion paper (Reference IversonIverson, 1999), a new model of ploughing is combined with existing sliding theory (Reference NyeNye, 1969; Reference LliboutryLliboutry, 1979) to analyze the relation between shear stress and effective pressure and explore its implications for the flow mechanism of glaciers on soft beds.
Till Elasticity
Background
Figure 1 illustrates the typical stress/strain behavior of shearing sediment (Reference AtkinsonAtkinson, 1993). At small stresses, sediment undergoes primarily elastic deformation, although there may also be minor irrecoverable slip between grains (Reference HardinHardin, 1978). When the stress reaches a sufficiently large value, the yield stress, widespread slip, rolling and sometimes fracture of grains is initiated, causing permanent deformation. Actual strain/strain relations for sediment do not usually display a discrete yield stress, and thus numerous, somewhat arbitrary techniques have been developed to determine the yield stress from non-ideal curves. The yield stress is sometimes idealized as the point where elastic strain stops (e.g. Reference Ho, Vela, Jenson, Clark, Sheahan and KaliakinHo and others, 1996). In reality, elastic deformation continues at higher stresses, although it becomes a progressively smaller fraction of the total strain (Reference AtkinsonAtkinson, 1993). After yielding, stresses may either increase monotonically to a value that remains steady with increasing strain, or reach a peak before decreasing to a value that eventually becomes steady (Fig. 1). The final strength of the sediment is called the ultimate or residual strength. Whether there is a peak in stress depends upon the composition and initial porosity of the sediment. Obviously, only limited deformation is possible at stresses between the yield and ultimate strengths.

Fig. 1. Idealized stress/strain diagrams for overconsolidated (thin line) and normally consolidated (thick line) non-cohesive sediment. Unloading causes elastic relaxation along a hysteretic path. Also shown are representative ring-shear data from tests on the Storglaciären till that illustrate the contrasting behavior of densely and loosely packed specimens prior to reaching the critical state.
Once the ultimate strength is reached, the sediment is said to be in the critical state and large shear strains are possible.
Regardless of the total strain, a reduction in applied stress will cause sediment to respond elastically following hysteresis loops qualitatively like those in Figure 1 (grey lines). The strain is recovered by relaxation of elastically strained grains and grain contacts and associated slip between grains (Reference HardinHardin, 1978; Reference Boyce, Pande and ZienkiewiczBoyce, 1980). The stress path is concave-down during loading and concave-up during unloading (this indicates that the work done on the sediment during loading exceeds that done by the sediment during unloading, and thus, that energy is dissipated during a loading/unloading cycle). The sediment shear modulus, the change in stress over the change in strain for a particular hysteresis loop (Fig. 1), depends on the magnitude of the strain; at very small strains, like those caused by the passage of a shear wave, sediment may be many times stiffer than at larger strains (Reference AtkinsonAtkinson, 1993, p. 158–162). In addition, the shear modulus depends on the effective pressure and the sediment composition (Reference Lambe and WhitmanLambe and Whitman, 1979, p. 161).
Apparatus and procedure
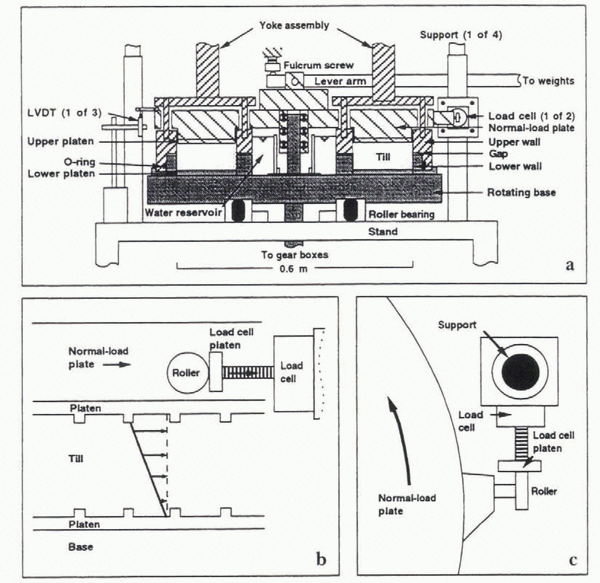
To study the deformation of till and other sediment, a ring-shear device that shears a large annular sediment specimen to high strains was constructed (Fig. 2a). Platens with teeth grip the top and bottom of the specimen. The specimen is sheared by rotating the bottom platen at a controlled rate. The upper platen is screwed to a thick plate, called the normal-load plaie, which may move freely up and down as the specimen thickness changes during shearing, but which is kept from rotating by two diametrically opposed rollers on arms that extend from the perimeter of the plate and press on load cells (Fig. 2a–c). These toad cells measure the shear force supported by the till.
A downward stress, normal to the macroscopic shearing direction, is applied to the specimen by a lever arm with dead weights that presses on the normal-load plate (Fig. 2a). The till pore water is in hydraulic communication with a reservoir that is open to the atmosphere. Thus, total stresses are equivalent to effective stresses during critical-state (steady) deformation. Other aspects of the device, not central to our measurements of till stillness, were discussed by Iverson and others (1996, 1997).

Fig. 2. (a) Cross-section of the ring-shear device. Darkly shaded components are rotated by underlying electric motor and gearboxes (not shown). (b) Flow-parallel view of the sample chamber at the site of one of the two load cells during relaxation of a till specimen. Shearing caused by rotation of the base from left to right leaves elastic strain stored in the till after shearing has stopped. This strain is incrementally reduced by screwing the load-cell platens into the load cells, which causes the normal-load plate to rotate from left to right and the force supported by the load cells to decrease. (c) A plan view of the apparatus at the site of one of the two load cells.
Measurements of till stillness are made as part of tests aimed at investigating the rheology of the basal till that underlies Storglaciären. A specimen of the till was obtained from a trench that was dug 9 m into the margin of the glacier (Reference Baker and HooyerBaker and Hooyer, 1996). The till is a sandy loam: 4% clay, 21% silt, 39% sand and 36% gravel. This is similar to the average size distribution of samples collected subglacially through boreholes at ten different locations beneath the glacier (5% clay, 26% silt, 52% sand, 17% gravel), although the borehole samples contained less gravel and more sand. The borehole samples could not be tested due to the large volume of sediment required For the ring-shear tests (0.11 m3). As is the convention in soil testing (Reference HeadHead, 1989, p. 83), all grains with diameters greater than one-tenth of the minimum dimension of the sample chamber, those greater than about 6 mm in diameter, are removed from the till. These clasts constitute, on average, 11% of the till weight or only about 8%) of the till volume. Thus, there is little reason to believe that their removal affects the stillness of the till significantly.
All tests are begun by saturating the till with water and loading the mixture as a slurry into the sample chamber. A normal stress is then applied to the specimen in one or more increments. Shearing is not initiated until resultant consolidation has essentially slopped. Tests are then run in which either the shearing rate or normal stress is stepped up or down. Tests have been run to shearing displacements that range from 0.1 m to > 1.0 m.
At the conclusion of a lest, after the rotation of the bottom platen has slopped, it is always observed that the shear stress supported by the specimen drops about 5–10%, but then remains elevated, indicating that the till is flexed elastically. To obtain a measure of the shear modulus of the till, G, defined as

where γ e is the recoverable shear strain and τ is the shear stress, the normal-load plate is allowed to rotate a few tenths of a millimeter by simultaneously screwing the two load-cell platens further into the load cells (Fig. 2b and c). The motion is measured with a micrometer to the nearest 0.002 mm, and the consequent reduction in shear stress (Fig. 3a) is recorded by the load relis. The process is then repeated until the load-cell platens lose contact with the rollers on the normal-load plate. The till continues to relax, however, causing forward motion of the normal-load plate that continues for 1–20 hours after contact with the rollers is lost (Fig. 3b). The shear modulus is calculated from the total displacement of the normal-load plate, the associated reduction in shear stress, and the specimen thickness, assuming that the recoverable shear strain was uniform from the top to the bottom of the specimen.
As in any such lest, however, the elastic compliance of the device itself must be considered. In our tests, some of the displacement of the normal-load plate during unloading arises not as a result of till relaxation, but from elastic relaxation of the rotating base and underlying gears. Thus, the displacement of the base, which averaged 46% of the total, was measured during unloading and subtracted from the displacement of the normal-load plate to obtain the true value of γ e.

Fig 3. Shear stress and displacement during a relaxation test on the Storglaciären till. (a) Results before the load cell platens lost contact with rollers on the normal-load plate. The steps reflect times when platens were screwed into the load cells (b) Results after platens lost contact with rollers on normal-load plate.
Another complication results from the walls that bound the inside and outside of the specimen (Fig. 2a). During displacement of the normal-load plate the walls do not move. Thus, as the till relaxes there is friction between the walls and the till. A torque sensor (not shown) in the axis of the yoke assembly measures the tangential force on the upper walls that arises due to this friction. This force, as expected, increased progressively with relaxation of the till, indicating that the force on the normal-load plate was transferred to the walls during unloading. Clearly, therefore, the walls inhibit the full relaxation of the till. To account approximately for this effect, the force supported by the walls was added tu the force on the normal-load plate, which reduces the magnitude of the stress reduction for a given reduction in strain. This correction results in a 17–35% reduction in the calculated shear modulus.
To investigate the sensitivity of the shear modulus to the magnitude of the shear strain recovered, dγ e, hereafter referred to as the strain increment, tests were conducted in which shearing was stopped at many different strains below that required to reach the ultimate strength. After each shearing episode, the till was incrementally relaxed as in the other tests. Tests were performed under steady normal stresses of 85 and 280 kPa.
Results
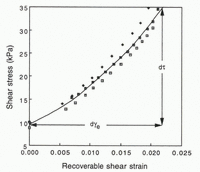
Figure 4 shows the results of three relaxation tests, conducted after the ultimate strength of the till had been reached. The normal stress was 85 kPa. The shear stresses at the ends of the relaxation tests are non-zero because, although at the ends of the tests there was no shear stress on the normal-load plate, there was shear stress on the walls that had accumulated during relaxation, as just noted. As expected, the stress paths are concave-up, indicating hysteresis during unloading. The shear modulus is taken to be equal to the average slope (secant) of the best-lit polynomial for the data.

Fig. 4. Unloading data from three relaxation tests conducted on the Storglaciären till after shearing the till sufficiently to reach its ultimate strength. The value of G is the slope of the secant of the polynomial fitted to the data (dτ/dγe). These data define hysteresis loops like the concave-up segments of those shown schematically in Figure 1.
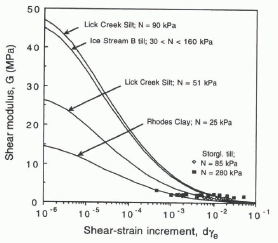
The shear modulus of the Storglaciären till varied as a function of both the strain increment and normal stress in relaxation tests conducted at total strains below that required to teach the ultimate strength (Fig. 5). For a given normal stress, shear moduli decreased non-linearly with the strain increment. Above strains of about 0.005, the decrease with strain increment was mild. It is also apparent from these data that the till is stiffer at larger normal stresses. At strains above about 0.005, the 3.2-fold difference in normal stress resulted in shear moduli that differed by nearly a factor of 2 (Fig. 5).
Comparison with other data
To assess whether these results are reasonable, the measured shear moduli and their dependence on the strain increment and normal stress are now compared with those of other granular materials obtained by different testing techniques.
Owing to interest in sediment behavior during earthquakes, many measurements of shear moduli have been made in so-called dynamic tests in which sediment specimens are vibrated at a high frequency in the laboratory. Such tests on silt , clay and silty sand typically yield moduli that are at least an order of magnitude larger than the values determined in this study (e.g. Reference Hardin and DrnevichHardin and Drnevich, 1972a, b; Reference Vrymoed, Bennet, Jafroudi, Shen, Pande and ZienkiewiczVrymoed and others, 1980). Similarly, seismic reflection studies on Ice Stream B (Reference Blankenship, Bentley, Rooney and AlleyBlankenship and others, 1986) indicate a shear modulus for the till substrate of 45 MPa (Reference FischerFischer, 1995), a value about 20–40 times larger than those determined here (Fig. 5).

Fig. 5. Shear moduli of the Storglaciären till as a function of shear-strain increment at normal stresses of 85 and 280 kPa.
It is well established, however, that shear moduli decrease significantly with increasing increments of recoverable strain (Reference Seed and IdrissSeed and Idriss, 1970; Reference Hardin and DrnevichHardin and Drnevich, 1972a, b; Reference Vucetic and DobryVucetic and Dobry, 1991; Reference AtkinsonAtkinson, 1993, p. 160). Thus, dynamic measurements cannot be compared directly with those of this study because such techniques induce strains of < 10-5 (Reference AtkinsonAtkinson, 1993, p.164), about two orders of magnitude smaller than the smallest strain increments reported here.
Data collected by Reference Seed and IdrissSeed and Idriss (1970) on different sediment types are representative of the dependence of shear modulus on strain increment emphasized subsequently by others (e. g. Reference Vucetic and DobryVucetic and Dobry, 1991; Reference AtkinsonAtkinson, 1993) and have been used to estimate shear moduli at high strains from dynamic (low-strain ) measurements (e.g. Reference Haldar, Reddy, Arockiasamy, Bobby, Pande and ZienkiewiczHaldar and others, 1980). We used these empirical relations to extrapolate data on silt, clay and sediment beneath Ice Stream B, for which only dynamic shear moduli are available. In Figure 6, the extrapolated data are compared with values obtained in this study. Measured shear moduli for the Storglaciären till are of approximately the magnitude expected, although the data indicate less non-linearity than the extrapolated values for the other materials.
The measured increase in shear modulus with normal stress is consistent with geotechnical data on similar materials. Aga in, the empirical relations of Seed and Idriss can be used to extrapolate dynamic shear moduli to low strains, in this case, for different values of effective normal stress. Shear moduli are plotted as a function of normal stress for clay and sand in Figure 7 along with the data from the Storglaciären till. Although tests on the till were run at only two normal stresses, the results of the two tests are consistent with the clay and sand data. Equating the normal stress with the effective pressure, P e, and assuming a power-law relation between normal stress and shear modulus for the till, like that of the more complete clay and silt data, yields G = 106P e 0.5 (dashed line), where units are in kPa.

Fig. 6. Shear moduli of the Storglaciären till and those of other sediment types (Reference Hardin and DrnevichHardin and Drnevich, 1972a: Reference FischerFischer, 1995) extrapolated to high strains using the empirical relations of Reference Seed and IdrissSeed and Idriss (1970).

Fig. 7. Shear moduli of the Storglaciären till at two normal loads (shear-strain increment 0.03) and more complete data for sand and kaolinitic clay (Reference Hardin and DrnevichHardin and Drnevich, 1972a; Reference Marcuson and WahlsMarcuson and Wahls, 1972). Values for the sand and clay are extrapolated to a shear strain of 0.03 using the empirical relations of Reference Seed and IdrissSeed and Idriss (1970). Consistent with the sand and clay data, a power law, G = 106 Pe 0.5, has been fitted to the till data.
In addition, Reference Atkinson and LittleAtkinson and Little (1988) haw gathered high-strain stiffness data in triaxial tests conducted on what they interpreted to be a lodgment till (20% sand and gravel, 40% silt, 40% clay). Their data from several tests conducted with normally consolidated , reconstituted specimens at a strain of 0.01, but at confining pressures different from those of this study, indicated a ratio of confining pressure to shear modulus of about 0.08–0.17, similar to values obtained here, 0.07 and 0.15 (Fig. 5).
Shear Stress on a Deformable Bed
Background
Continuous records of bed shear strain obtained at Trapridge Glacier (Reference Blake, Clarke and GérinBlake and others, 1992) and during four field seasons at Storglaciären (Reference Iverson, Hanson, Hooke and JanssonIverson and others, 1995; Reference Hooke, Hanson, Iverson, Jansson and FischerHooke and others, 1997) display periods when the sense of shearing in the till reverses. During such periods, tiltmeters that record deformation apparently rotate up-glacier, and thus, calculated rates of shear strain are negative. These periods are accompanied by increasing subglacial water pressures. Simultaneous increases in surface speed and reductions in till strength have also been observed consistently at Storglaciären. These data suggest that when increases in water pressure increase the speed of the glacier, motion is focused at or near the glacier sole, rather than deeper in the bed where the tiltmeters are located. Similarly, measurements of sliding at Trapridge Glacier indicate that slip accounts for 50–90% of the total glacier motion, and that slip events occur during periods of increasing water pressure (Reference Blake, Fischer and ClarkeBlake and others, 1994).
The negative strain rates in the bed during such periods have been interpreted in two ways. Reference Iverson, Hanson, Hooke and JanssonIverson and others (1995) suggested that till is squeezed into zones where basal ice is uplifted, locally thickening the till layer and causing tilt-meters tilted down-glacier to rotate up-glacier. A difficulty with this hypothesis, however, is that some parts of the till bed should then thin during high-water-pressure events, suggesting that some tiltmeters elsewhere should rotate down-glacier during such events. But up-glacier rotation of tiltmeters has been consistently observed at two other locations beneath Storglaciären since the initial measurements were made. Reference Fischer and ClarkeFischer and Clarke (1997) made the more appealing suggestion that up-glacier rotation might result from elastic relaxation of the bed during the slip phase of stick–slip sliding. However, the large value of the shear modulus used in their model (45 000 kPa), based on wave-propagation studies, implies unreasonably large fluctuations in shear stress on the bed (as large as 2000 kPa) if applied to the up-glacier rotation events at Storglaciären.
Now we use the much smaller shear moduli determined in our laboratory tests, together with a tiltmeter record from Storglaciären, to compute the local basal shear stress for comparison with the effective pressure on the bed.
Data from Storglaciären
Penetration tests on the bed of Storglaciären through more than 100 boreholes indicate that most of the ablation area of the glacier is underlain by a layer of till that is decimeters in thickness. Continuous records of bed deformation, basal water pressure, surface speed, bed shear strength and sliding speed were sought there during the summers of 1991–95 with the goal of investigating the ice/bed coupling (Reference Iverson, Hanson, Hooke and JanssonIverson and others, 1995) and the mechanical properties of the bed (Reference Iverson, Jansson and HookeIverson and others, 1994; Reference Hooke, Hanson, Iverson, Jansson and FischerHooke and others, 1997). Measurement techniques are described in these earlier publications. Bed deformation, water pressure and surface speed were measured simultaneously during three seasons, but only in 1993 were such measurements obtained at a location where basal water pressure varies through a large range, down-glacier from the most prominent riegel in the bed (e.g. Reference HookeHooke, 1991). The focus here, therefore, will be on the 1993 data.
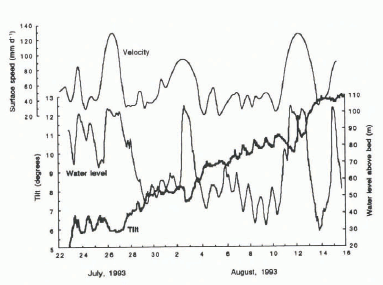
The unsmoothed record from one tiltmeter, 85 mm long and driven into the till by hammering to a depth of 0.15 m, is shown in Figure 8. The instrument may actually have been somewhat deeper if the insertion tool settled into the till layer prior to hammering. The average ice thickness in the area was 95 m. As in earlier work (Reference Blake, Clarke and GérinBlake and others, 1992), it was assumed that the direction of maximum tilt was down-glacier.
The water level above the bed and the surface velocity are shown also in Figure 8. The water level was measured in a borehole 100 m up-glacier from the site of the tiltmeter, beneath an ice thickness of 118 m. The high rate at which this borehole drained upon reaching the bed during drilling suggests that the measurement was made in or near a sub-glacial channel. Dye traces in the area indicate that flow occurs in channels at the bed (Reference Hock and HookeHock and Hooke, 1993). The corresponding effective pressure, the difference between the ice-overburden pressure and the water pressure in a channel, is referred to hereafter as the “effective channel pressure” (e.g. Reference Walder and FowlerWalder and Fowler, 1994) to acknowledge that the water pressure was most likely measured in a channel and may not necessarily have been equal to the water pressure at the site of the tiltmeter.

Fig. 8. Plot of unsmoothed record from a tiltmeter in the basal till, glacier surface velocity, and borehole water level during late July and early August 1993 on Storglaciären.
The tilt record clearly illustrates the periodic up-glacier rotation of the tiltmeter as water pressure at the bed increased due to the daily increase in meltwater input (Fig. 8). It is also evident that the basal water pressure and surface speed were, for the most part, in phase. Changes in surface speed reflect primarily changes in basal velocity (Reference Hooke, Hanson, Iverson, Jansson and FischerHooke and others, 1997). In addition to diurnal fluctuations, there were several higher-amplitude, longer-term increases in surface velocity and water pressure. These periods were caused by rainstorms and are manifested as broad minima in the tilt record.
Interpretation and analysis
The till meter rotated through 8°, indicating that the till deformed permanently over the period of measurement. However, if we take the till thickness to be 0.35 m, the depth to which penetrometers could be driven into the bed, and extrapolate the measured till linearly over that thickness, then the net rotation accounts for <5% of the glacier surface displacement. It is inferred, therefore, that most of the basal motion occurred near the glacier sole above the depth of the tiltmeter, although the unlikely possibility that there was significant motion below the tiltmeter cannot be excluded.
The central hypothesis of this paper is that the cyclic variations in tilt are caused by the build-up and release of elastic shear strain in the till, as the local shear stress applied to the bed fluctuates with the water pressure. Shear strain calculated from the tiltmeter record, and the effective channel pressure calculated from the water-pressure record are shown in Figure 9. An increase in effective pressure increases the local shear stress. The bed, therefore, deforms elastically and, if the yield stress is exceeded, permanently down-glacier during such periods. As the effective pressure begins to decrease, the applied shear stress decreases and the elastic part of the deformation is recovered as the till relaxes, probably following a hysteretic path (Fig. 1). Whenever the yield strength is exceeded during loading, not all of the strain is recovered. This seems to have been the case for most of the loading/unloading cycles displayed in the tilt record. Thus, many loading cycles result in detectable permanent deformation of the bed.

Fig. 9. Till shear strain and effective channel pressure. Permanent strain is isolated from the total strain by linearly interpolating between shear-strain minima that occur during periods of lowest effective channel pressure. It is assumed that these shear-strain minima occur when there is complete decoupling between the ice and the till, and that therefore there is no elastic strain stored in the bed at such times.
Our objective now is to use the elastic part of the tilt retord to estimate the temporal variation in shear stress on the bed. The elastic strain in the bed is equal to the difference between the total strain, γ, and the permanent strain, γ p. Thus, from Equation (1),
Therefore, to calculate τ, the permanent deformation implied by the tilt record needs to be estimated. A reasonable guiding assumption is that during major minima in the shear-strain record, which correspond to periods of extremely low effective channel pressure, specifically on 26 July and 2, 11 and 15 August, there was complete decoupling of the ice from the till. If there was no shear stress on the till during these shear-strain minima, then the elastic strain stored in the bed would have been zero during such periods, and strain would have consisted of only permanent deformation. Titus, linearly interpolating between the values of minimum strain provides tin estimate of the permanent strain over most of the record (Fig. 9). For the period prior to 26 July, there was no net increase in strain, despite three loading cycles, and thus there was no permanent deformation of the till. Although this method of estimating the permanent component of the shear strain is uncertain, we shall see that it yields a tight relation between τ and effective channel pressure, with the expected decrease in τ toward zero as the effective channel pressure approaches zero.
It should be noted that the measured strain may include some strain due to small changes in till thickness that probably occur as the effective pressure on the bed changes. This may have had an effect on the rotation of the tiltmeter. However, evaluation of the ratios between axial effective stress and recoverable strain for granular materials in repealed confined compression suggests that this effect was probably negligible (Reference Lambe and WhitmanLambe and Whitman, 1979, p. 155), particularly since the rotation of the near-vertical tiltmeter in response to vertical strain should have been considerably less than that of a passive marker.
To calculate τ from Equation (2), we next need to incorporate the variability of G. As noted, G depends on the strain increment and on the effective pressure, P e. The dependence on strain increment, however, is mild at strain increments above 0.005 (Fig. 5), and the amplitudes of the strain cycles during the period of record (Fig. 9) generally exceed that value. Thus, a reasonable approximation is that G was independent of the strain increment over the period ?f record. To account for the increase in G with P e, the power-law relation, G = 106P e 0.5 (Fig. 7) is used, where units are in kPa. Thus, Equation (2) becomes
Let us assume initially that P e = P ec, the effective channel pressure. The resulting time series of τ is shown in Figure 10a, together with the time series of P ec, which it follows closely. Plotting τ as a function of P ec every 10 min, the sampling interval of the data loggers, yields a distribution of points that is surprisingly light (Fig. 10b), given that these time series have not been smoothed or stacked. Scatter of points may be due, in large part, to uncertainly in γ p associated with its linear interpolation between points of minimum shear strain (dotted line in Fig. 9). Making the reasonable assumption that for P e = 0, τ = 0, the data are best fu with a power law:
with m = 1.68 and K = 1.1 × 10⁻³. This is more useful than Equation (3), of course, because the elastic strain (γ — γ p) is not typically known. Note from Equation (3) that this implies that (γ — γ p) = kP e n , where k = K/106 and n = m – 0.5.
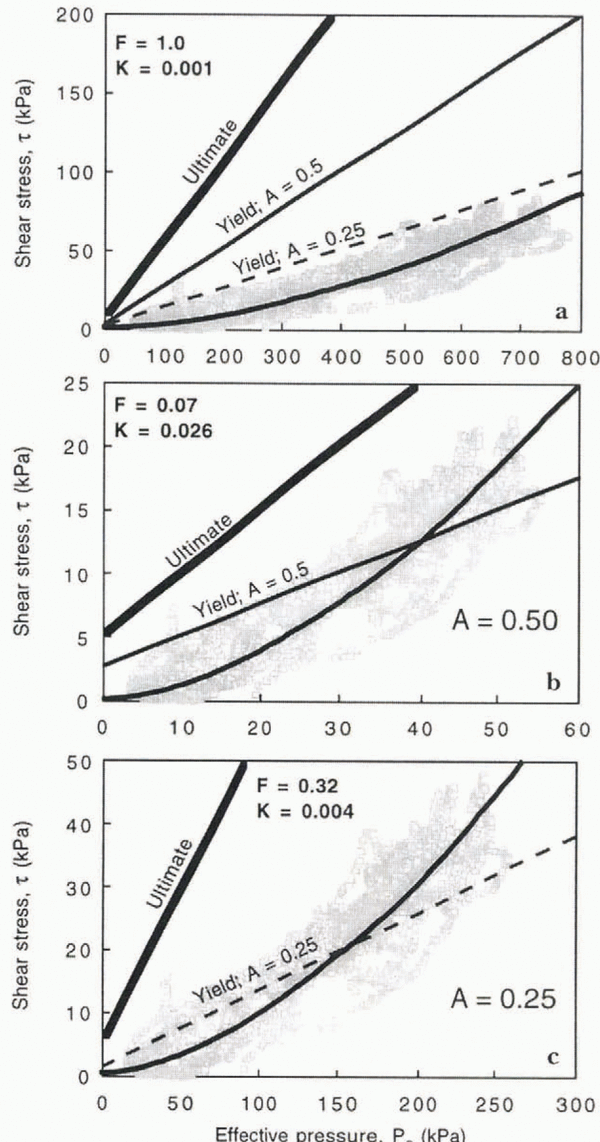
An important inconsistency becomes apparent, however, if calculated values of τ (Fig. 10b) are compared with the yield strength of the till (Fig. 11a). The yield strength, τ y, of the Storglaciären till can be estimated by noting that it is roughly a constant fraction of the measured ultimate strength, τ u. The value of τ u is virtually independent of the strain rate, but depends on the effective pressure, such that τ u = c i + P e tan φ u, where c i is the cohesion intercept (Reference Lambe and WhitmanLambe and Whitman, 1979, p. 139), equal to about 5 kPa, and φ u is the ultimate friction angle, equal to 26.3° (Reference Iverson, Hooyer and BakerIverson and others, 1998). For granular materials, determining τ y from stress/strain relations, which almost never display a discrete yield stress, is somewhat arbitrary, but a reasonable approximation for till is that τ y is typically about 50% of the ultimate strength (Reference Ho, Vela, Jenson, Clark, Sheahan and KaliakinHo and others, 1996). Some authors, however, emphasize that there may be significant permanent deformation at lower stresses (e.g. Reference HardinHardin, 1978). To acknowledge this uncertainly, yield strengths that are 25% of the ultimate strength are also considered. Thus, the yield strength is approximated as
where A = 0.5 or 0.25. In cither case, it is clear that the calculated shear stress was lower than the yield strength of the till (Fig. 11a). This, however, is not consistent with the permanent deformation that occurred during the period of record (Fig. 9).

Fig. 10. (a) ?ec and the local shear stress on the till over the period of record, calculated by assuming that Pe = Pec. (b) Shear stress as a function of Pec.

Fig. 11. (a) The local shear stress on the till (transferred from Fig. 10b), the ultimate strength of the till measured in ring-shear tests, and two limiting estimates of the till yield strength. (b) The local shear stress if Pe = 0.07 Pec; K = 0.026 (c) The local shear stress if Pe = 0.32 Pec; K = 0.004.
The most likely explanation for this discrepancy is that P e was consistently smaller than P ec and that, therefore, the yield strength of the till at the site of the tiltmeter was less than predicted. This would imply that water pressure increased away from channels, which is a necessity in a steady stale in the absence of significant elevation head. We will thus assume that P c is a constant fraction, F, of P ec, such that P e = F P ec. This is clearly an uncertain assumption, particularly beneath Storglaciären where water pressure fluctuates. Such fluctuations might, in principle, cause water sometimes to flow away from channels. Furthermore, as water pressure fluctuates, the normal stress that ice exerts on the bed may deviate from the ice-overburden pressure, thereby influencing the effective stress.
However, limited independent evidence supports this assumption to the extent that P e may, indeed, be consistently less than P ec. An experiment conducted during the 1995 field season demonstrates that water pressure was higher at the ice/till interface than in channels. A pressure transducer, inferred to have lodged ai the ice/till interface, recorded a progressively higher water pressure as it moved away from a borehole that was in good hydraulic communication with other boreholes in the area (Reference Hooke, Hanson, Iverson, Jansson and FischerHooke and others, 1997, Fig. 5). The maximum water pressure at the ice/till interface when the experiment ended was 200 kPa larger than the pressure in the closest borehole several meters away. Moreover, there was no significant lag between water-pressure variations at the ice/till interface and the borehole signal, precluding the possibility that the water pressure at the interface was controlled by lateral pore-pressure diffusion through the till. Taking into consideration the basal melt rate, the measured pressure gradient was consistent with flow along the bed toward channels in a water layer 0.1–0.2 mm thick. Thus, water pressure in interchannel regions may be higher than in channels, but may vary in phase with the channel pressure due to non-diffusive flow in a relatively continuous water layer at the bed.
Thus, we will assume that P e = F P ec, where F is between 0 and 1, keeping in mind the uncertainty but also noting that this assumption enables the observed permanent deformation of the bed to be reconciled with the large effective channel pressure. Note that this assumption reduces not only the inferred till yield strength at the site of the tiltmeter, but also the value of G (Fig. 7) and hence τ. Thus, from Equations (3) and (5),

The values of τ and τ y should be equal only at a threshold value of P ec, at which permanent deformation begins. This threshold value can be estimated from the records of P ec and shear strain (Fig. 9). Loading cycles resulted in no permanent strain when P ec was less than 400 kPa, during the period prior to 26 July. In contrast, subsequent loading cycles, when P ec was generally higher than about 500 kPa, resulted in permanent deformation of the bed. The threshold value for P ec is, thus, taken to be approximately 500 kPa. Setting τ = τ y and substituting P ec = 500 kPa and the average value of γ – γ p at P ec = 500 kPa (0.014) into Equations (6), yields F, and hence P e, for a given value of A.
Performing this procedure for A values of 0.50 and 0.25 yields limiting values of F: 0.07 or 0.32, respectively. Thus, P e had to be about 3–14 times less than P ec to account for the observed permanent deformation of the till. A more precise estimate is not possible without better constraints on the value of A. Substituting the limiting values of F into the first of Equations (6), yields a relation between τ and P e of the same form as Equation (4), but with an improved estimate of the value of K: 0.004 < K < 0.026 (Fig. 11b and c). The shear stress supported by the bed exceeds the yield strength of the till at shear stresses of 12 and 20 kPa for the two limiting values of K (Fig. 11b and c). These values define the predicted range of stress over which permanent deformation of the till began.
Discussion
Till beneath glaciers, regardless of the extent to which it has been. sheared, should respond elastically to changes in Unapplied shear stress. Our laboratory measurements indicate that this response is close to linear over the range of elastic strains inferred from the tiltmeter record at Storglaciären and depends on the effective pressure. Shear-stress fluctuations calculated from the elastic response of the till are clearly caused by changes in basal water pressure, consistent with data from Trapridge Glacier and the stick–slip sliding model of Reference Fischer and ClarkeFischer and Clarke (1997).
Such fluctuations in shear stress at the site of the tilt-meter imply that the shear stress distribution over the bed of the glacier must change as the water pressure fluctuates. For example, when the effective pressure and shear stress on the till decrease, shear stresses must increase elsewhere on the bed, such as where bedrock bumps protrude through the till, or at the glacier margin, which is frozen to the bed.
The most serious source of error in this analysis stems from the lack of water-pressure measurements at the site of the tiltmeter, which makes estimating the effective pressure then- difficult. Even if water pressure had been measured there, there would still be uncertainly since the local normal stress that ice exerted on the bed might have deviated from the ice-overburden pressure. We have assumed that the effective pressure at the site of the tiltmeter was some fixed fraction F of the effective channel pressure and then solved for the plausible range of F values by considering reasonable upper and lower bounds for the till yield strength. Although this method is clearly uncertain, it reconciles the large effective channel pressure with the small but discernible permanent shear strain in the bed that would not have occurred if the measured effective channel pressure were representative of the bed as a whole (Fig. 11a).
The basal shear stresses calculated here (Fig. 11b and c) are considerably smaller than the average basal shear stress estimated from force-balance calculations based on surface strain rates, which yielded values greater than 90 kPa at approximately this location during an earlier field season (Reference Hooke, Calla, Holmlund, Nilsson and StroevenHooke and others, 1989). The till, therefore, in a general way, seems to lubricate the bed. This is similar to the active Siple Coast (West Antarctica) ice streams, where driving stresses are apparently balanced primarily by interstream ridges and sticky spots, rather than by the deformable bed (e.g. Reference Echelmeyer, Harrison, Larsen and MitchellEchelmeyer and others, 1994; Reference MacAyeal, Bindschadler and ScambosMacAyeal and others, 1995).
The cyclic shear stress on the bed also suggests that the till at this location should seldom, if ever, be in the so-called critical or residual state, in which there is shearing at a steady stress and porosity. It is possible that rheological models based on the deformation of till in the critical state (Reference KambKamb, 1991; Reference Hooke, Hanson, Iverson, Jansson and FischerHooke and others, 1997; Reference Hooke, Hanson, Iverson, Jansson and FischerIverson and others, 1997) are not appropriate for till that is cyclically loaded. By extension, the distribution of shear strain in such till may be different from that in till beneath glaciers where deformation is relatively steady (Reference Iverson, Hooyer and BakerIverson and others, 1998). It is worth emphasizing, however, that cyclic loading of basal till like that observed in this study requires that there be both water-pressure fluctuations and sticky spots onto which shear stresses can be shifted. There may have been neither of these beneath large parts of the Laurentide ice sheet, for example, where there was an unlithified bed that may have deformed steadily (e.g. Reference Ho, Vela, Jenson, Clark, Sheahan and KaliakinJenson and others, 1996) and thus should have been in the critical state.
Our data suggest a relation of the form: τ = KP e m , where m is approximately 1.7 and K is a constant between 0.004 and 0.026 (Fig. 11b and c). This relation and the yield criterion for till (Equation (5)) determine whether there is permanent deformation of the bed. If τ < τ y, there is no permanent deformation of till at depth in the bed and motion occurs at or near the glacier sole by some combination of sliding or plowing. If τ > τ y, τ will equal the resistive stress offered by the till, and the till will deform permanently, although there cannot be significant deformation, like that required of the deforming-bed model of glacier motion, unless τ is equal to the ultimate strength. At the site of the tiltmeter in this study, τ was always less than the ultimate strength (Fig. 11b and c), and permanent deformation of the bed, therefore, was minimal.
The values of m and K are clearly important in determining the partitioning of motion at the bed. For example, because m > 1.0 at the site of the tiltmeter, permanent deformation of the bed is expected at high rather than at low effective pressures. The values of m and K may vary spatially beneath Storglaciären and almost certainly vary from glacier to glacier. Their values may depend on a number of factors, among them the bed roughness, the relation between the geometry of the hydraulic system and P e, and the relation between P e and sliding speed. In the companion paper (Reference IversonIverson, 1999), an attempt is made to account for the form of the observed relation between τ and P e using models of sliding and ploughing.
Conclusions
Fluctuations in basal water pressure drive variations in the local shear stress exerted on till beneath Storglaciären. Resultant elastic deformation of the till provides a means of estimating this stress and explains periodic up-glacier rotation of tiltmeters. Fluctuations in shear stress must be balanced elsewhere on the bed, presumably where the till is absent or where the glacier is frozen to the bed.
The shear modulus of till, like that of other granular materials, decreases with strain increment and increases with P e. At increments of shear strain larger than about 0.005, the shear modulus of the Storglaciären till is about 1000 and 1800 kPa at confining pressures of 85 and 280 kPa, respectively.
Permanent deformation of the bed beneath Storglaciären was responsible for only a minor fraction of basal motion and occurred when P e was high. This deformation was unsteady and occurred at shear stresses below the ultimate strength of the till. Thus, the till was not in the critical state.
The shear stress in kPa varied with KP e m where K is constant between 0.004 and 0.026 and m is approximately 1.7. The form of this relation, when compared with the linear relation between the till strength and P e, accounts for the lack of bed deformation at low effective pressures.
Acknowledgements
The ring-shear device could not have been constructed without the generous assistance of J. Marchetti, foreman of the electrical engineering machine shop at the University of Minnesota. We thank J. S. Walder for commenting on an early version of the manuscript and S. Tulaczyk, W. Harrison and G. K. C. Clarke for helpful comments. This work was supported by U.S. National Science Foundation grants OPP-9224209 and OPP-9530814.