Stauffer and others (1984) observed in the Greenland ice core from Dye 3 CO2 variations between low values in the range of 180-200 ppm volume and higher values in the range of 240-260 ppm volume, over a period tentatively dated to 30 000-40 000 years B.P. The low values are observed in samples with low δ18O, high particle and chemical impurity contents, representing precipitation from periods of cold climate; the higher CO2 concentrations are measured in samples which reflect warm climatic conditions because of their high δ18O and low impurity contents. The change from one climatic state to the other seems to occur within less than a century. This unexpected observation has received considerable attention from the scientific community. First, the question was posed whether the rapid CO2 variations do indeed reflect atmospheric CO2-concentration changes or whether they are caused by the interaction of gases with chemical constituents in the ice matrix. Secondly, carbon-cycle modellers searched for a mechanism in the carbon system which could produce such rapid changes in atmospheric CO2. Here we try to answer the first question.
Arguments in favour of an atmospheric origin of the CO2 variations are: CO2 measurements on an ice core from Siple Station, Antarctica, show a monotonous increase over the past 250 years, from values around 280 ppm volume to values overlapping closely with the direct atmospheric data which have been obtained since 1958 (Neftel and others 1985). Thus a consistent picture of the anthropogenic CO2 increase has been obtained which is compatible with estimates of the man-made CO2 emissions and with the carbon-cycle calculations of the airborne fraction of these emissions.
In addition, convincing CO2-concentration data have been obtained, from two ice cores from Greenland and four ice cores from Antarctica, for the transition from low (180-200 ppm volume) late-Wisconsin values to the higher (260-300 ppm volume) Holocene values. In spite of considerable differences in temperature, fabrics and chemical properties, the Wisconsin CO2-concentration values for ice cores from different locations lie in a narrow band. The Holocene values show a greater scatter; in particular, the values obtained for the Dye 3 core are significantly higher than those for the other cores. This can be explained by a relatively high temperature, which leads to melting in summer. In refrozen melt layers, CO2 is enriched in comparison with the other air gases. On the basis of these observations we conclude that melt layers are the main factor which can lead to considerable deviations in the CO2 concentration of the air occluded in ice cores from that of the atmosphere at ice formation.
To test if the melt-layer effect was the cause of the rapid changes in CO2 concentration which were observed in the Dye 3 core, increments of the Camp Century core from north Greenland were measured for CO2; they show similarly rapid Wisconsin δ18O and CO2 changes, though they are less abrupt than in the Dye 3 core. At Camp Century the present mean annual temperature is 4.5 °C lower than at Dye 3, and during the Wisconsin the temperature difference was even greater, as indicated by the δ18O values. Because even for Holocene ice in the Camp Century core the melt-layer effect on the CO2 concentration is relatively small, we exclude any similar significant effect on the Wisconsin ice. On the basis of the Greenland ice-core information alone, therefore, we have no indication that the rapid Wisconsin CO2 variations do not represent an atmospheric phenomenon.
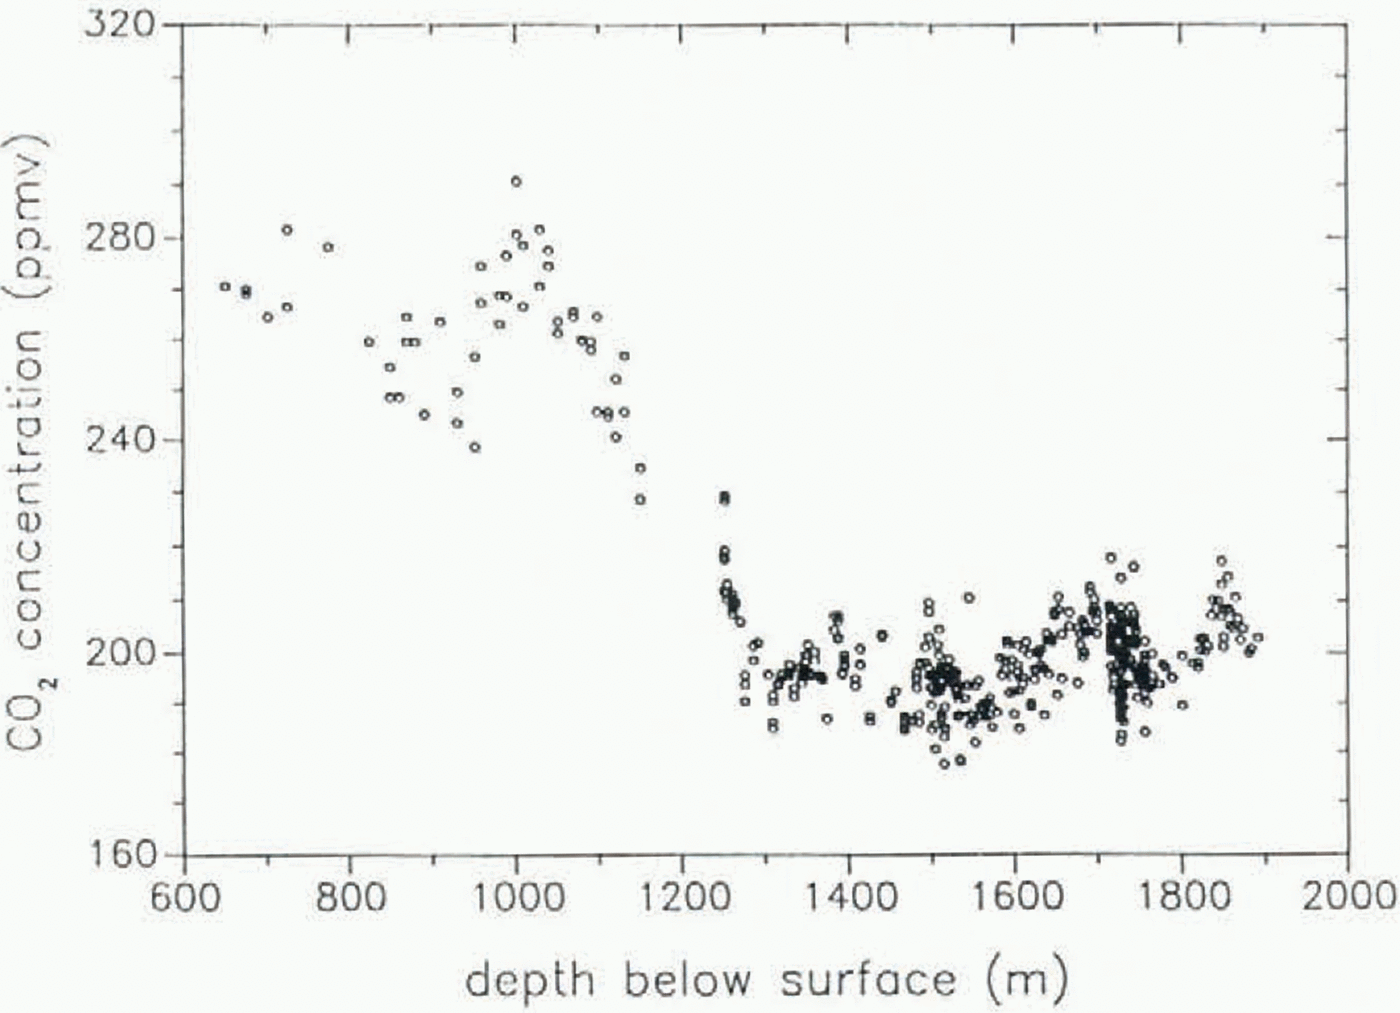
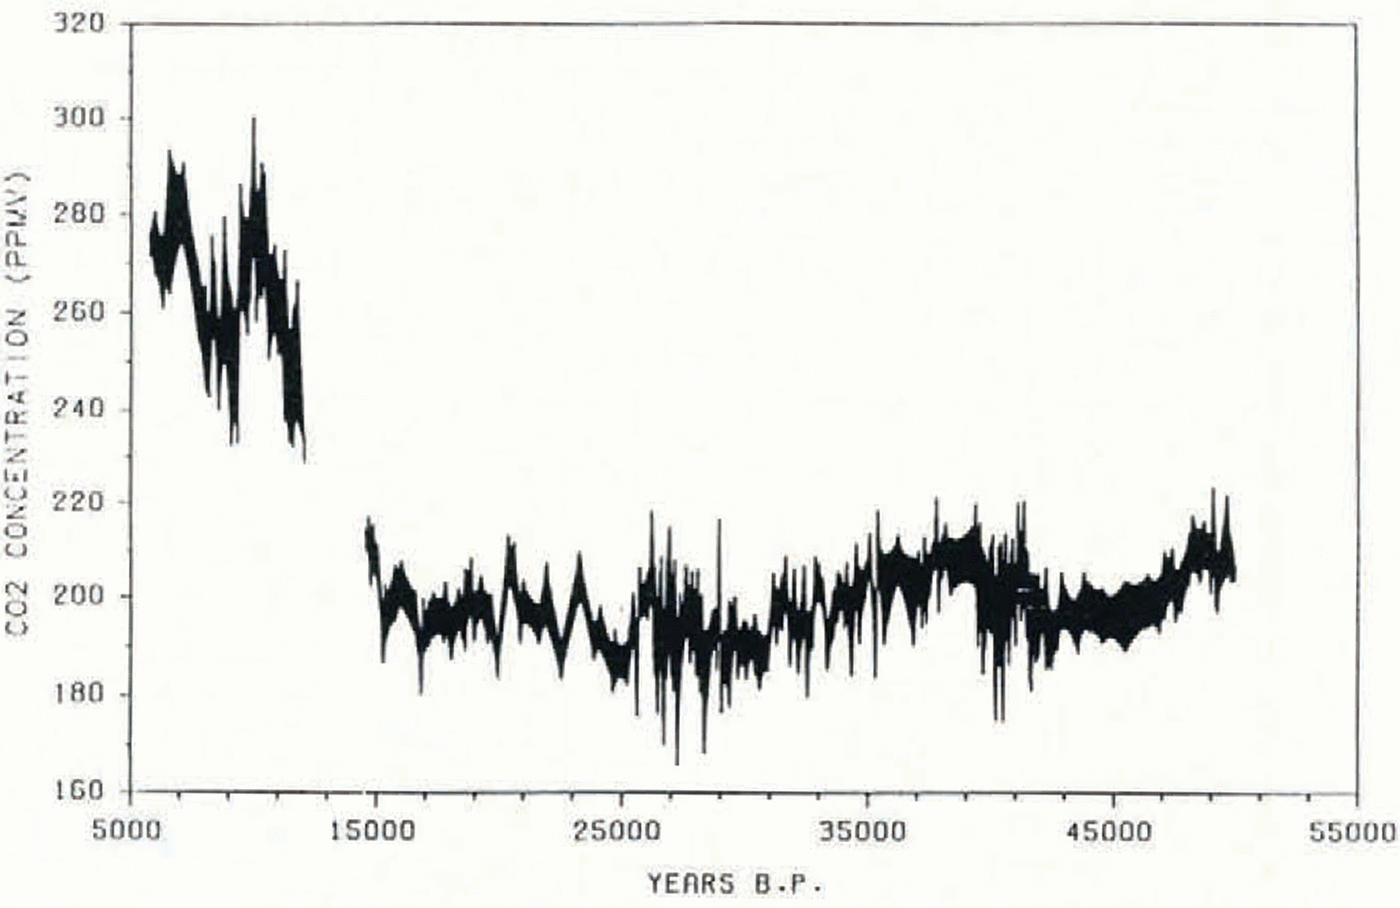
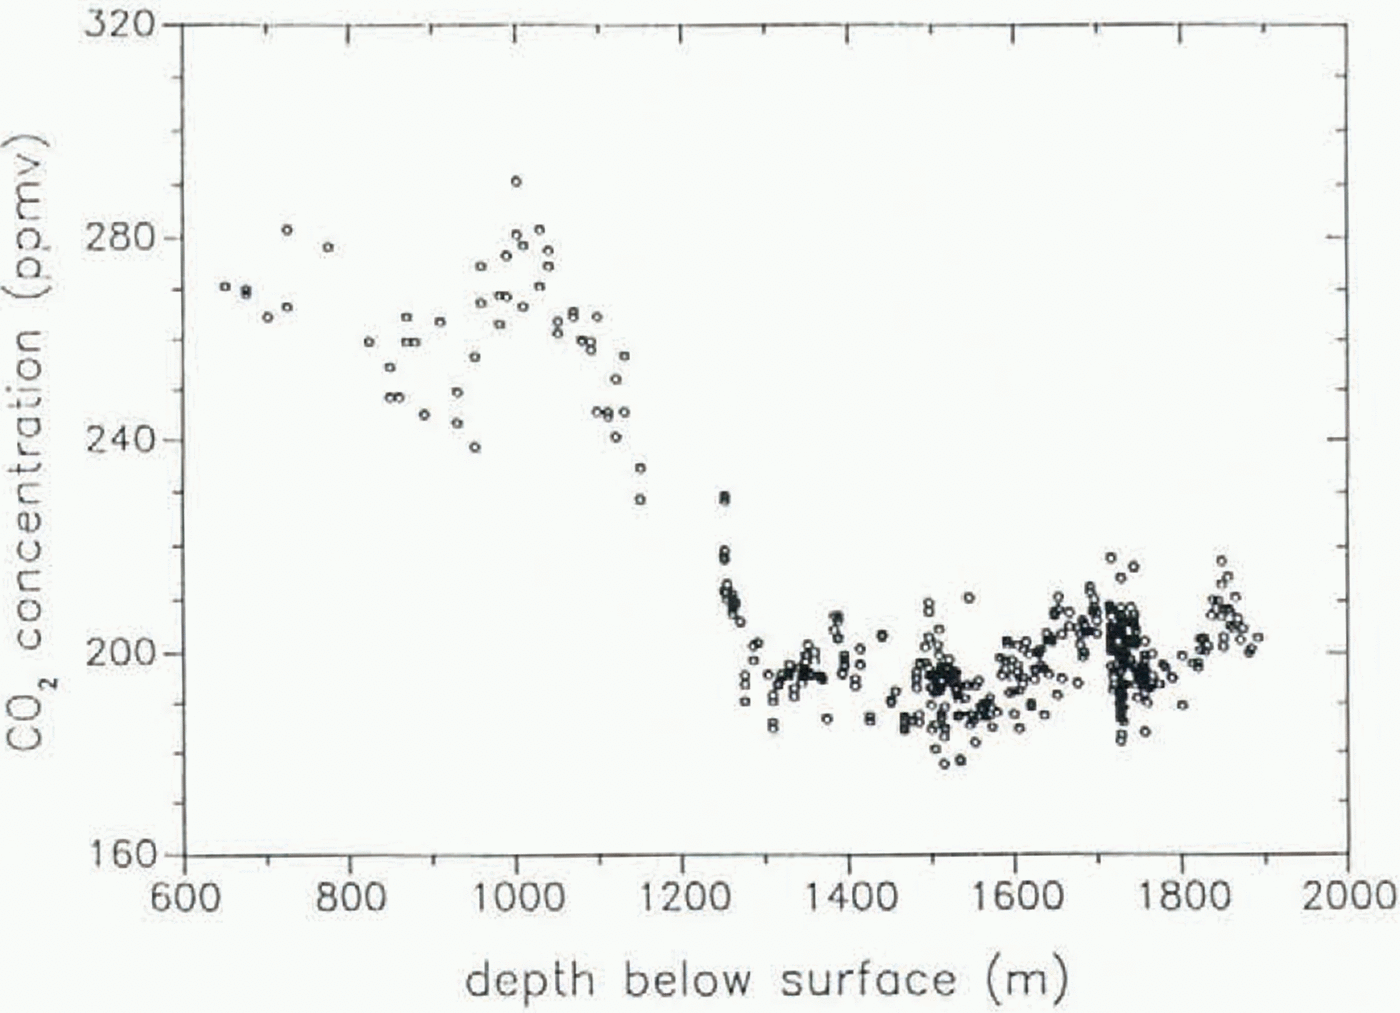
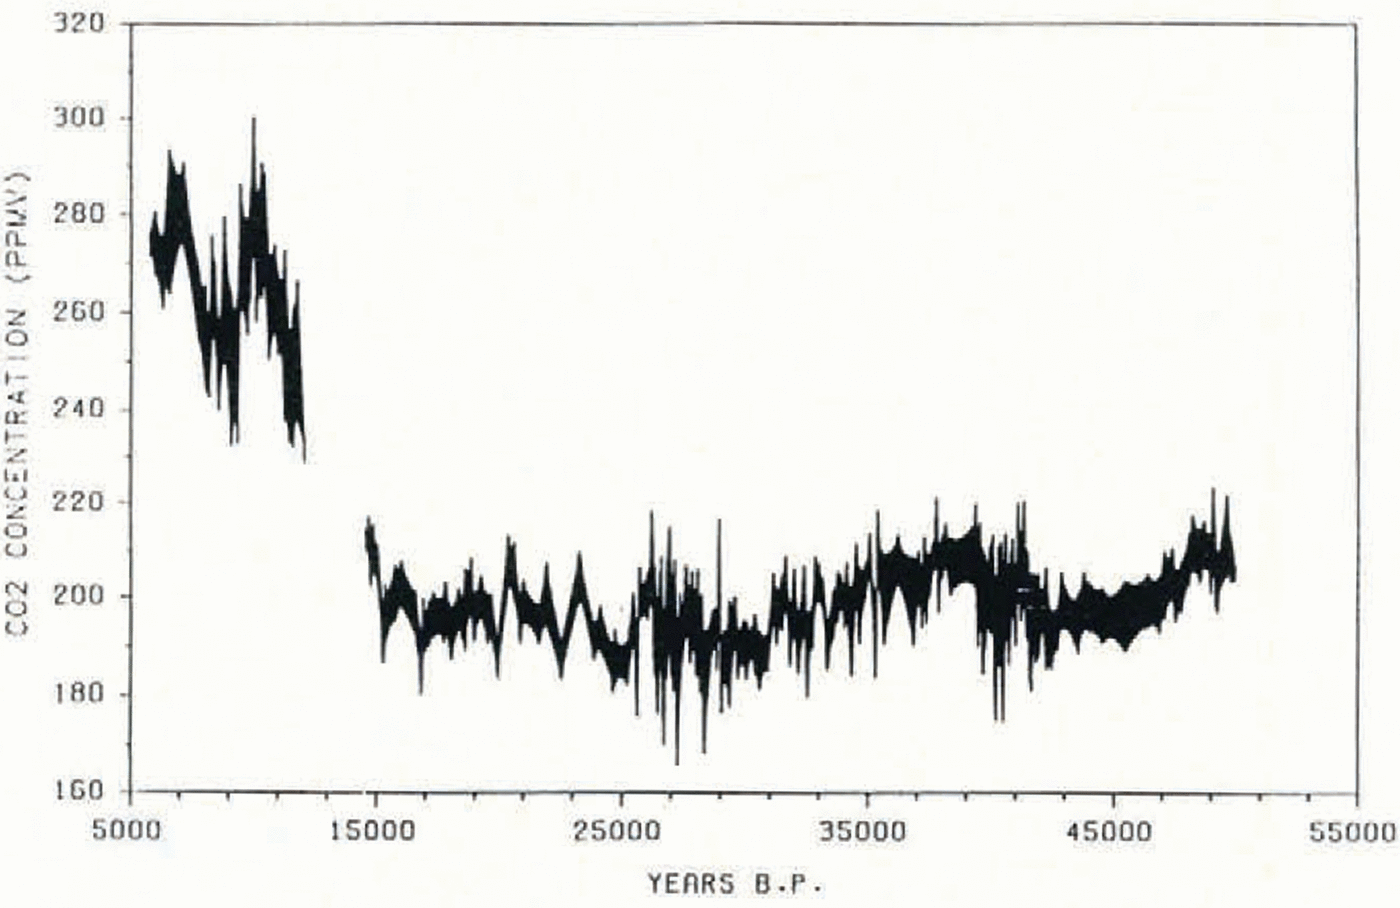
Arguments against an atmospheric origin for the rapid CO2 variations stem from detailed analyses of the ice core from Byrd Station, Antarctica. Observation of the increase in anthropogenic atmospheric CO2 in both hemispheres indicates that within a few years CO2 becomes well mixed throughout the atmosphere. Thus the CO2 variations observed in the Greenland core should also appear in the Antarctic core increments which represent corresponding periods. A thorough CO2 study was performed on a Byrd Station core fraction which, according to a tentative time-scale (personal communication from C.U. Hammer, 1987), corresponds to the time interval 5000-55 000 years B.P. (Fig. 1). In what follows, we briefly discuss the data in the 25 000–55 000 years B.P. time interval. A first look reveals that all the data lie in a band between 180 and 220 ppm volume; no values are observed in the 240 and 260 ppm volume band. There are periods showing trends, e.g. from c. 210 ppm volume around 40 000 years B.P. to c. 185 ppm volume around 32 000 years B.P., and periods of strong scattering of the data, e.g. between 41 000 and 44 000 years B.P., with values in the 185-215 ppm volume band. At Byrd Station the annual accumulation is 0.16 m of water equivalent, compared to 0.50 m of water equivalent at Dye 3. This means that at Byrd Station, both the difference between the age of the surrounding ice and the mean age of the air, and the width of the age distribution of the gases, are larger than at Dye 3. In addition, the Byrd Station core does not show the rapid δ18O changes which indicate warm periods with relatively high accumulation. Thus one might argue that in the Byrd Station core the CO2 changes are dampened, due to a significantly wider age distribution of the gases in the ice.
This effect was modelled by Neftel and others (in press). They applied a deconvolution procedure in order to reinstall the range of possible atmospheric CO2 concentrations (see Fig. 2). This procedure results in a somewhat wider band of possible CO2 concentrations; in some periods it is 170-230 ppm volume. But it does not produce the possible high values in the range observed in the Greenland ice cores. All this new information leads to the following ambiguous conclusions:
The new CO2 data for the Camp Century ice core show rapid Wisconsin CO2 changes similar to those in the Dye 3 data, in spite of the differences in the temperatures and the physical and chemical properties of the two ice cores. However, similar CO2 changes do not appear in the Byrd Station ice core (from Antarctica) in the core fraction thought to represent the corresponding time interval.
There are three possible ways to resolve the apparent discrepancy:
(1) In the Wisconsin warm-period ice, CO2 is artificially enriched, due to a process which has not yet been identified.
(2) In the Byrd Station core, the CO2 changes during the Wisconsin are attenuated to a much higher degree than was assumed in the model calculations by Neftel and others (in press).
(3) The increments in both the Greenland and Byrd Station cores which have been investigated do not represent overlapping time intervals, perhaps due to rheological irregularities in the Greenland ice sheet close to bedrock (Staffelbach and others 1988, this volume).
With the existing core material it is difficult to resolve this important problem. The dilemma of the rapid Wisconsin CO2, variations is one of the many important arguments for the recovery of new deep cores both in Greenland and in Antarctica.


