1. Introduction
The compilation of geomorphological and glaciological maps is an important step in building a database compatible with similar documents elaborated by other scientists operating in Antarctica. Glaciers can be monitored in order to characterize their behaviour and to reveal links to changes in current environmental and climatic conditions. The maps also provide a detailed interpretation of the origin of landscape features in relation to the geomorphological processes responsible for their formation. They supply information on the chronological sequence of landforms and deposits, highlighting the difference between active and non-active processes.
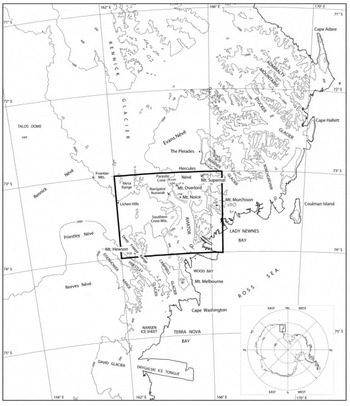
The Mount Murchison quadrangle (73–74˚ S, 162˚– 166˚30' E; Fig. 1 and attached map) is the third product of a cartographic project for northern Victoria Land, conducted by the Italian Antarctic Research Program (PNRA). The two other maps in the series are the Mount Melbourne and Relief Inlet quadrangles (Reference BaroniBaroni and others, 1996, Reference Baroni2002). For this cartographic project, surveys were conducted over a wide area extending for >400km from David Glacier basin (to the south) to Cape Hallett (to the north; Fig. 1). Landform assemblages are depicted in order to perform a regional analysis of landscape, and to provide data for studies on the evolution of the Transantarctic Mountains and the Cenozoic history of the East Antarctic ice sheet (EAIS).

Fig. 1. Location map showing the Mount Murchison quadrangle. Contour lines redrawn from Antarctic digital database 4.0 (BAS, 2002).
Mount Murchison (3501ma.s.l.) is located in northern Victoria Land, on the west coast of the Ross Sea (Fig. 1). The United States Geological Survey (USGS) 1 : 250 000 quadrangle covers an area of about 15 107 km2, excluding the ice tongues (Antarctic digital database 4.0; BAS, 2002). More than 95% of the area is ice- or snow-covered (14 360km2), while only about 5% is deglaciated (747km2). The highest peak is Mount Hewson (3720m a.s.l.), in the Deep Freeze Range (within the Priestley Glacier catchment). Other significant mountains are Mount Supernal (3654 m), in the Mountaineer Range, and the Mount Overlord volcanic cone (3396 m) which rises above Deception Plateau.
The most prominent features in the region are the sinuous valleys, now occupied by glaciers fed by extensive icefields and local ice caps. Together with their numerous tributaries, they form a dendritic and complex drainage pattern. In their lower portion, valley glaciers lead into fjords and form floating ice tongues (up to 20mlong) in the Ross Sea. The area of interest lies at the edge of the EAIS; however, the network of glaciers forming the complex glacial system of northern Victoria Land has no direct relationship with the EAIS.
2. Methods
2.1. Satellite imagery
The background for the Mount Murchison map is a Landsat 4 Thematic Mapper (TM) satellite image mosaic. The mosaic consists of five TM images, acquired between November 1989 and January 1990 (062-112, 17 January 1990; 062-112, 14 November 1989; 066-113, 17 January 1990; 066-111, 29 January 1990; 066-112, 29 January 1990). The TM images were digitally integrated using ERDAS Imagine mosaicking tools to produce a map with the dimensions of the USGS Mount Murchison quadrangle (1967). Landsat 4 TM data have a ground resolution of 28.5m and are collected simultaneously in seven spectral bands: three in the visible spectrum (bands 1–3), three in the near-infrared region (bands 4, 5 and 7) and one in the thermal infrared region (band 6). Here we use a false-colour composite (assigning red to band 4, green to band 3, and blue to band 2) at a 1 : 250 000 scale. The albedo of snow, firn and ice generally decreases from visible to near-infrared wavelengths (Reference FrezzottiFrezzotti, 1993; Reference Zibordi, Meloni and FrezzottiZibordi and others, 1996). This difference in spectral response is enhanced in the false-colour mosaic, allowing differentiation of distinct glacier facies (e.g. snow-covered accumulation regions appear white in the images, whereas blue-ice covered ablation areas appear blue). Aerial photography and additional satellite imagery (Landsat TM; Landsat multispectral scanner (MSS); Système Probatoire pour l’Observation de Terre (SPOT); European Remote-sensing Satellite (ERS)) were also used to estimate glacier velocities and ice-front fluctuations from 1964 to 1999.
2.2.1.
Georeferencing
The satellite image mosaic was georeferenced by identifying six ground-control points whose coordinates are well known from global positioning system (GPS) measurements and survey control stations in the USGS Mount Murchison quadrangle. A GPS survey was performed during 1996 using static and fast-static survey performed with a dual-frequency Geodetic receiver and a GPS fixed station located at Zucchelli station, Terra Nova Bay. Georeferencing was performed using the Lambert Conformal Conic cartographic projection (standard parallels 72˚40' S and 75˚20’ S, World Geodetic System 1984 ellipsoidal elevation (WGS84)) with a linear conversion matrix resulting in a rms error of about two pixels.
USGS Mount Murchison quadrangle contour lines were compiled using the triangulation system in 1967 from US Navy tri-camera aerial photographs taken between 1960 and 1964 on the basis of only one survey station. The absolute positions of contour lines present considerable inaccuracies, and were corrected wherever possible using the georeferenced satellite mosaic.
2.2. Field survey and data analysis
The main landscapes of the region were surveyed through helicopter flights and detailed geomorphological surveys in key areas in the period 1996–2001. Landforms and deposits of glacial and periglacial environments, as well as forms related to mass wasting, wind action, weathering and geological structures, were identified and mapped. Features originating from different geomorphological processes are represented with appropriate symbols and colour-coded. Morpho-chronological and morpho-dynamical data are supplied where available. Different colour tones differentiate active and relict landforms. Particular attention was devoted to the relationship between relict erosional landforms and volcanic activity. For example, we measured and mapped the elevation of glacial erosional trimlines by means of ground surveys and detailed helicopter traverses using topographic maps and altimeter measurements (corrected by cross-checking points of known elevation). The estimated trimline elevation points are indicated on the map and have an uncertainty of about 50 m.
The main features related to present-day glacier morphology and dynamics are depicted on the map. The methods used to survey glaciological features (ice velocity, ice-front position, grounding line, aeolian morphology, etc.) are described in more detail by Reference FrezzottiFrezzotti (1997) and Reference Frezzotti, Capra and VittuariFrezzotti and others, (1998 Reference Frezzotti, Gandolfi, La Marca and Urbini, 2002). Maps, georeferenced satellite images and aerial photographs were analyzed, compared and input into a Geographic Information System (GIS) using ERDAS and Arc/Info software. Data from all other sources were also formatted so they can form attribute layers of a GIS.
2.3. Additional data sources
Additional information on the thickness of glaciers derives from airborne radar surveys conducted in 1995 (Reference Tabacco, Passerini, Corbelli and GormanTabacco and others, 1998). These radar profiles are inserted at the base of the map. The data were acquired by means of a radar system operating at 60MHz and linked to a GPS. Some themes (e.g. lithology, after Reference Capponi, Meccheri and PertusatiCapponi and others, 1997) are shown at reduced scales. Extensive geomorphological features, such as the main glacial troughs, relict alpine ridges and spurs, scoured bedrock and volcanic cones, are also depicted in the same insert.
Snow-accumulation measurements and mean temperatures are also reported. They derive from direct measurements and from studies on the isotopic and chemical composition of the snow as a function of elevation and distance from the ocean (Reference Allen, Mayewski, Lyons and SpencerAllen and others, 1985; Reference Piccardi, Udisti and CasellaPiccardi and others, 1994a Reference Piccardi, Barbolani, Bellandi, Casella and Udistib Reference Piccardi, Casella and Udisti, 1996; Reference Gragnani, Smiraglia, Stenni and TorciniGragnani and others, 1998; Reference MaggiMaggi and others, 1998; Reference Udisti, Becagli, Traversi, Vermigli and PiccardiUdisti and others, 1998a Reference Udisti, Traversi, Becagli and Piccardi, b Reference Udisti, Becagli, Castellano, Traversi, Vermigli and Piccardi1999; Reference StenniStenni and others, 1999 Reference Stenni, 2000). The firn cores were drilled between 1981 and 1993, and the annual accumulation rate was determined for the period 1971–92.
3. Discussion of Major Map Features
3.1. Glacier and sea-ice features
The Mount Murchison map covers an area extending from Priestley Glacier to the upper Rennick Glacier basin, Half Ration Névé, Hercules Névé and Lady Newnes Bay. The EAIS borders the area to the northwest, and feeds the Rennick and Priestley outlet glaciers. The former flows northward toward the Pacific Ocean, while the latter enters Terra Nova Bay, south of the study area. Aviator, Campbell, Tinker, Icebreaker, Fitzgerald and Meander glaciers are the main valley glaciers present in the map and drain the névé of the mountainous Victoria Land coastal zone. The catchments of most of these glaciers extend outside the Mount Murchison quadrangle.
The ice-thickness data reveal that ice caps are up to 900m thick (Hercules Névé). Radar profiles of Hercules Névé (radar profile G–H and K–L in the map) show strong reflectors at intermediate depths (200–400 m). The geomorphological position and continuous extensions of these reflectors suggest they are tephra layers ejected by local volcanoes. Indeed, tephra attributed to The Pleiades and Mount Rittmann volcanoes was identified 180 km west of Hercules Névé, in a blue-ice area of the Outback Nunataks (72˚57' S, 160˚28' E; ∼2040ma.s.l.; Reference Perchiazzi, Folco and MelliniPerchiazzi and others, 1999) and in an ice core drilled at Talos Dome (72˚48' S, 159˚06' E; 2316ma.s.l.; Reference Narcisi, Proposito and FrezzottiNarcisi and others, 2001). The Pleiades volcano (72˚45' S, 165˚29' E), located close to the northeast border of Hercules Névé, is known to have produced widespread pumice deposits. On the basis of snow-accumulation rates measured at Hercules Névé (Reference StenniStenni and others, 2000) and of reflector depths, we suggest that this eruption is of Holocene age.
The catchment areas of glaciers in the region vary in size from a few tens of km2 to several thousand km2. These catchment regions mainly develop above 1000 m elevation (80% of the Campbell Glacier basin area lies above 1000 m) and some exceed 3000 m. The glacier tongues have linear snow-filled depressions, which have been interpreted as the surface expression of bottom crevasses (Reference FrezzottiFrezzotti, 1997). The calving period for these glacier tongues is typically 7– 15 years (Reference FrezzottiFrezzotti, 1997). The presence of fast ice for most of the year, and of multi-year sea ice in Lady Newnes and Wood Bays, protects the ice fronts from storms and wave motion (Reference FrezzottiFrezzotti, 1997).
Aviator Glacier occupies a deep trough that crosses the Transantarctic Mountains. Its grounding zone is located about 90 km inland of the present ice front. Glacier ice is about 1500m thick at the grounding zone (Fig. 2). Ice velocity at the ice front is about 180 ma–1 (Reference FrezzottiFrezzotti, 1993), and ice thickness is reduced to <200m due to basal melting and ice dynamics. The grounding zone of Icebreaker Glacier is about 30 km inland of the present ice front, with an ice thickness of about 900 m. The thickness of the Icebreaker ice tongue is also reduced to <200m at the ice front, which moves at a velocity of about 70 ma–1.
Fig. 2. Present and former longitudinal profiles of Aviator Glacier derived from ice surface and thickness, trimlines and drift limit elevations.
3.2. Climatic data
Ten-metre core temperatures (Reference StenniStenni and others, 2000) indicate a sub-adiabatic lapse rate of 0.5˚C (100 m)–1, in agreement with the results of Reference Vitale, Tomasi, Giovannelli and StefanuttiVitale and Tomasi (1994) which indicate values of 0.55 –0.62˚C (100 m)–1 at Terra Nova Bay Station on the basis of meteorological radio sounding collected from 1987 to 1991. The distribution of accumulation rates shows an overall negative correlation with altitude and distance from the coast. Maximum values were measured at Aviator Glacier station (260 kg m–2 a–1), the lowest site (150ma.s.l.) closest to the coast. Among the less disturbed windy sites, the lowest accumulation rates (130–145 kg m–2 a–1) were measured on Hercules Névé, located at high altitudes (about 2900ma.s.l.) and far from the sea. The geographical distribution of accumulation rates indicates that depositional regimes may depend on orography and the direction of storms and are induced by wind-driven ablation. Reference StenniStenni and others (2000) calculated an average snow accumulation rate of about 170 kg m–2 a–1, and a linear relationship between mean δ18O and firn temperature with a gradient of 0.81‰˚C –1.
3.3. Aeolian landforms
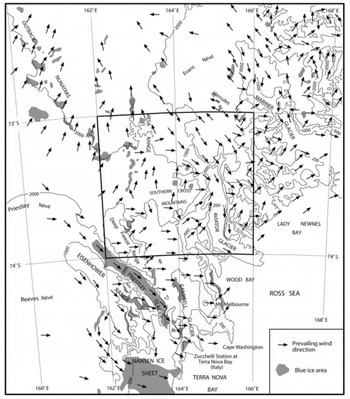
The snow deposition process is complicated in the Victoria Land mountains, characterized by strong, persistent katabatic winds and severe snowstorms. Converging katabatic winds in Terra Nova Bay greatly influence the environmental conditions in Victoria Land. The primary route for katabatic winds into Terra Nova Bay is the Reeves Glacier valley (south of Mount Murchison), but an important secondary source is provided by airflow down Rennick and Priestley Glaciers (Reference Bromwich, Parish and ZormanBromwich and others, 1990; Reference FrezzottiFrezzotti, 1998). Wind-field data (Fig. 3) derived from surface aeolian morphologies (snowdrift, sastrugi, wind scoops and drift plumes) show that katabatic winds from the west and southwest cross Eisenhower Range and Priestley Valley, and affect the Deep Freeze Range and the leeward area (hydrographic right) of Campbell Glacier (Reference Zibordi and FrezzottiZibordi and Frezzotti, 1996; Reference FrezzottiFrezzotti, 1998), where they are responsible for the extensive formation of blue-ice fields. Extensive blue-ice areas are also present in the Mesa Range along Rennick Glacier. In the eastern part of the Campbell Glacier valley (hydrographic left) the effect of winds strongly diminishes. Automatic weather station 7356 on Tourmaline Plateau (74˚11' S, 163˚29' E; 1700ma.s.l.; Reference BaroniBaroni and others, 1996) shows that prevailing winds mainly blow from the west and southwest. Winds can reach speeds of > 40 kts (20ms–1), and speeds of > 7 kts (3.5ms–1) persist for more than 50% of the year. The mountain area east of Campbell Glacier is characterized by aeolian features related to surface air blowing radially and uniformly away from the highest parts of the mountains (Hercules Névé, Southern Cross Mountains) to the coast along the main valleys. In the coastal area, aeolian morphologies are aligned southwest–northeast according to the direction of barrier winds (Reference FrezzottiFrezzotti, 1998).

Fig. 3. Wind-field directions derived from surface aeolian morphologies (snowdrift, sastrugi, wind scoops and drift plumes).
3.4. Volcanic and structural morphology
The geomorphology of the area is strongly controlled by the geological structure. The Mount Murchison quadrangle encompasses an Early Palaeozoic metamorphic basement (Reference Capponi, Meccheri and PertusatiCapponi and others, 1997 and references therein). It consists of two main terranes, the Wilson Terrane (greenschist facies metasediments, migmatites, gneiss) and the Bowers Terrane (low-grade sedimentary and volcanic rocks). Granites of the Granite Harbour Igneous Complex (Ordovician) intruded the Wilson Terrane. A north-northwest– south-southeast-trending shear zone marks the contact between the Wilson and Bowers Terranes. Devonian Admiralty intrusives and Gallipoli volcanic rocks were emplaced in both terranes. After this event, the basement was eroded and uplifted. An erosion surface (known in southern Victoria Land as Kukri Peneplain) was sculptured in the basement. The Triassic continental Beacon Sandstone deposited on this surface. The Kirkpatrick Basalt (Jurassic) covered the Beacon Sandstone that was in turn intruded by the Ferrar Dolerite, which built horizontal sills along the basal Beacon horizon. Columnar jointing is a common feature along the cliffs where dolerites and basalts crop out (i.e. Mesa Range, Lichen Hills, Illusion Hills, slope southwest of Deception Plateau). Flat surfaces related to the exhumation of the Kukri Peneplain are visible on the Southern Cross Mountains (Archambault Ridge; Fig. 4).
Fig. 4. Mesa structure (> 3000 m) to the west of Archambault Ridge. Ferrar Dolerite and Beacon Sandstone (in the background) cover the paleozoic Kukri Peneplain, exhumed in the foreground.
The last geological event was the emplacement of the Cenozoic McMurdo igneous rocks, consisting of the Meander intrusives suite (22–48 Myr) and the Melbourne alkali– volcanic suite (>14.5Myr to the present; Reference Kyle, LeMasurier and ThomsonKyle, 1990; Reference Armienti and BaroniArmienti and Baroni, 1999 and references therein). Effusive activity generated numerous volcanoes, the most evident being Mount Overlord, Mount Rittman, Mount Noice and Parasite Cone. Cinder cones are also widespread, particularly in the Southern Cross Mountains. Tephra accumulation on ice-free areas is evident on Mount Noice and in the Meander Glacier basin. Well-defined lava flows are present on the western slopes of Mount Overlord. Small lava flows related to minor volcanoes were found along the slopes of the Aviator Glacier valley and in the vicinity of Mount Kinet.
Geological structure also played an important role in the development of valley networks, operating both passive and active tectonic control. Block faulting affected the mesas in the Cretaceous and Cenozoic (Reference Petri, Salvini, Storti and RicciPetri and others, 1997), and a major northwest–southeast-trending dextral strike–slip fault system developed in northern Victoria Land (after 80 Myr; Reference Salvini, Brancolini, Busetti, Storti, Mazzarini and CorenSalvini and others, 1997; Reference Salvini and StortiSalvini and Storti, 1999). Cenozoic north–south to north-northwest–south-southeast transtensional faults developed in the Cenozoic (after 32 Myr). Major glacier valleys trend northwest–southeast, following the main regional strike–slip fault; however, a significant portion of the valley system trends north–south according to extensional faults (Reference Salvini, Brancolini, Busetti, Storti, Mazzarini and CorenSalvini and others, 1997). The resulting drainage system is complex, with dendritic, parallel and sub-rectangular patterns. The relationship between active tectonic control and the drainage network is marked by a number of selected lineaments. Some lineaments are interpreted as traces of faults or fault-line erosional scarps. Some of these scarps are associated with morphostructural features like saddles and triangular facets, suggesting that they actively determined the evolution of landscape and drainage pattern.
Flat-topped summit surfaces are visible at the Mesa Range, where summit mesas are interpreted as relict landforms scalloped by glacial erosion along their margins (Fig. 5). Differential weathering produced denudation terraces along the slopes of the mesas. A number of residual buttes are also associated with the mesas. A gentle regional tilting of about 2˚ is indicated in structural blocks of the Mesa Range and of the area in the vicinity (Reference Petri, Salvini, Storti and RicciPetri and others, 1997). Considering the low dip of the strata, almost imperceptible in the field, we indicate these landforms as mesas; those structures that show a more evident dipping of Mesozoic formations are indicated as cuestas. A sequence of esplanade terraces is found in the Deep Freeze Range, between Mount Hewson and Priestley Glacier.
Fig. 5. Mount Frustum (3100 m), Tobin Mesa. Flat-topped surfaces are interpreted as old relict landforms scalloped by glacial erosion on their margins. A diffluent lobe of Rennick Glacier enters from the left. Local debris-covered glaciers (to the right) rest in glacial cirques.
3.5. Glacial landforms and deposits
3.5.1. Erosional landforms
Valley troughs are occupied by outlet glaciers (Rennick and Priestley Glaciers) and local valley glaciers that form an articulated, complex drainage system, with main and tributary valleys producing dendritic, parallel and subrectangular patterns. Several hanging valleys are also present. Considering that well-developed relict alpine morphologies are perfectly preserved in deglaciated areas, the valley network is interpreted as the remnant of an old topography sculptured by temperate alpine glaciers. If this interpretation is correct, glaciers occupy the valley network and ridges mantling the relict landscape.
Relict alpine topographic features consist of sharp ridges with delicate serrated spires (Fig. 6), glacial cirques, horns and truncated spurs. These features continue across different bedrock lithologies. Well-preserved erosional trimlines are common features on the highest summits and on ridges (Reference Orombelli, Baroni and DentonOrombelli and others, 1991). They smoothly decrease in elevation along the valleys from the interior to the coastal margin (Fig. 2). No striations or erratics are found above the trimlines. On the contrary, the surfaces below the trimlines were sculptured by glacial abrasion into rounded summits, scoured areas and roches moutonnées. Grooves, crescentic marks and extremely well-preserved fine striations on polished surfaces are widespread and were used to reconstruct ice-flow directions. The bedrock above this erosional limit exhibits strong staining and deep cavernous weathering. Diffuse tafoni with enlarged visors, pseudokarstic rectilinear grooves and weathering pits characterize the exposed granitic rocks on horns and ridges.
Fig. 6. Southwest Chisholm Hills photographed from the northeast, with Mesa Range in the background. A sharp ridge with delicate and serrated spires (up to 30 m high) is sculptured in Ferrar Dolerite. A double trimline at about 2800 m limits the ridge that was never glacially eroded.
The mesa edges are also scalloped by the alpine topography. In this particular geomorphological context, where local ice caps descend from summit plateaus and feed the valley glaciers, an upper trimline is sculptured on the ridges. This trimline is irregular and was probably eroded by summit glaciers descending into the main valleys. K/Ar and Ar/Ar ages of volcanic rocks sculptured by glacial erosion show that alpine topography is older than 8.2 Myr. Landform features younger than 7.5 Myr are unaffected by wet glacial erosion (Reference Armienti and BaroniArmienti and Baroni, 1999).
At the confluence between Burns and Tinker Glaciers, at an elevation of about 300 m, volcanoclastic rocks buried a granitic bedrock intruded by basalt dykes (Reference Verbers, Smith and vanVerbers and others, 1995). Fine striations on granite and dykes were produced by a glacier moving eastward. The volcanoclastic rocks are presumably older than 12.5 Myr and predate the glacial abrasion of the granite bedrock.
3.5.2.
Glacial deposits and constructional landforms Since most of the Mount Murchison quadrangle, particularly in the entire area east of the Campbell Glacier–Mesa Range alignment, is an accumulation region, supraglacial drift is rapidly covered by snow and incorporated within glacier ice. Supraglacial debris re-emerges in blue-ice fields where katabatic winds prevent snow accumulation and induce strong ablation, forcing the ice to flow there continuously. Englacial debris in these areas is progressively accumulated on the ice surface. Debris traps are concentrated on the western portion of the map, and are almost absent along the central and eastern valley glaciers. Most of the debris-covered ice areas are located close to the slopes and inside pocket valleys where strong katabatic winds induce effective ablation. Supraglacial debris may be scattered on the ice or form a continuous cover some decimetres to a few metres in thickness. Supraglacial drift protects the ice from wind and radiation, thereby reducing ablation; as a result, debris-covered ice stands at a higher elevation with respect to the surrounding bare ice. Supraglacial till mainly consists of rocks from adjacent topography, suggesting that a glacial flow starts from the base of the same relief. Indeed, the debris-covered ice is a local glacier within a main glacier; a moraine of basal debris from the local glacier often marks its boundaries (Fig. 5). In some places the local glacier flow is dammed by the opposite inflow of the main glaciers. In this case, a double moraine delimits the two contrasting flows. Rennick Glacier enters with diffluent lobes into the Lichen Hills and insinuates up-valley (Fig. 7). The lobe west of Lemaster Bluff also deposited a small Holocene ice-cored moraine on the bedrock. Reference Meneghel, Bondesan, Salvatore and OrombelliMeneghel and others (1999) described a particular kind of banded floating moraine at Lichen Hills. Bands of different lithology (light-coloured granite and dark-coloured volcanic rocks) possibly formed in relation to the progressive lowering of the ice surface due to glacier retreat after the Last Glacial Maximum (LGM). If so, the marked difference in the lithological composition of the moraines is due to the different rocks exhumed by the lowering of the glacier surface during the Late Glacial and Holocene periods. Holocene moraines related to small local glaciers rest on ice-free areas of Gair Mesa, Lichen Hills and the Archambault Ridge.
Fig. 7. Lichen Hills photographed from northwest. A diffluent lobe of Rennick Glacier flows up-valley into a blue-ice area where ablation due to katabatic winds forces the ice to flow continuously. A continuous cover of supraglacial debris is visible on the lobe margin close to the slopes.
Late Wisconsin glacial drift occurs at several sites at different elevations. It consists of massive matrix-supported and clast-supported diamictons composed of granitic, metamorphic and volcanic rocks. Clasts are mainly angular and subangular, but some pebbles are bullet-shaped and show surface striations. Where present, the sandy to silty matrix is olive-grey. The debris shows a low degree of weathering and pale staining. On the basis of morphological position, degree of weathering and soil evolution, this deposit can be correlated with the ‘Terra Nova drift’ described by Reference Orombelli, Baroni and DentonOrombelli and others (1991). The Late Wisconsin drift is mapped in only a few localities because it is discontinuous, with a patchy distribution where present. Scattered patches of glacial drift and erratics are more common and were mapped at several sites. Drift distribution and elevations were used to reconstruct the maximum level reached by the glacial surface of the LGM (Fig. 2). On the basis of their position and morphology, some glacial drift can be interpreted as frontal deposits of small local glaciers (i.e. at Mount Frustum and north of Mount Hewson).
A number of moraine ridges related to recessional phases of the LGM are also indicated as Late Wisconsin drift. They were mapped at the Lichen, Illusion and Vantage hills.
Some erratics predating the LGM are present on the ridge west of Scarab Peak, in the Mesa Range.
3.6. Periglacial, mass wasting and weathering landforms
Less than 5% of the area covered by the map is ice-free and represents an ice-marginal, high-latitude periglacial environment. Most of the ice-free areas are located at elevations exceeding 2000 m. The extreme cold and aridity, and strong persistent winds drive the periglacial processes acting in the region. Nevertheless, there is geomorphological evidence of temporary and episodic availability of water. Rock surfaces also record the effects of cryotic and non-cryotic cycles. It is not clear whether thermal stress on rock surfaces can intensify exfoliation processes. The presence of salt in soils and snow cover lowers the freezing point of water and introduces a chemical component that increases the effectiveness of cryogenic cycles and may contribute to the weathering process. Winds remove the smaller products of weathering, determining the formation of bouldery lag pavements and diffuse wind-eroded boulders and ventifacts.
Avalanche tracks and cones are relatively widespread, especially along the steep slopes bordering major glacial valleys. In the coastal area, avalanches are frequently triggered by partial melting of fresh snow, induced by heat released from dark outcrops. The wide avalanche cones on glacier margins suggest frequent avalanches. Block fields mantle flat summits and gently sloping surfaces. Debris cones are accumulating at the base of steep rock cliffs, in particular on the western side of Mesa Range.
Tafoni and rounded boulders on granitic and metamorphic rocks are widespread. Pitting and honeycomb weathering are also documented. Feldspathic granules (grus) accumulate around and beneath a number of tafoni; these forms are widespread in the Mountaineer and Deep Freeze Ranges, where they mainly assume the shape of visors, although alveols and basal tafoni are also present. Tafoni are widely associated with pseudo-karstic features such as elongated sequences of grooves and weathering pits affecting sub-horizontal surfaces. Grooves develop on steep, deeply oxidized surfaces; they are several to tens of metres in length, and range from centimetres to decimetres in width and depth. At several sites these features are covered by a discontinuous rock varnish and show thick weathering rinds. Low residual rock pinnacles similar to Antarctic tors found in the Dry Valleys (Reference SelbySelby, 1972) are also widespread on old sculptured dolerite surfaces. Gelifluction terraces develop where debris lies on moderately dipping slopes, forming tiers parallel to the slopes. These tiers are present in a few places, such as on the northwest slope of Illusion Hills, on the westward relief of Archambault Ridge and between Mount Gibbs and Mount Hewson. Only a small rock glacier was detected in the area, on the northern slope of Lichen Hills. Patterned-ground forms are more widespread. Contraction polygons mainly develop on flat or sub-horizontal surfaces covered by debris, but are also present where deeply frost-shattered rocks crop out. Polygons range from 1m to a few tens of meters in diameter; they are produced by contraction due to frost cracking determined by fluctuations of temperature above the neutral layer.
4. Concluding Remarks
Our ongoing cartographic project allows the study of a vast and significant portion of the Antarctic continent. The region is located in a strategic geographic position for investigating behavioural relationships among the different glacial bodies that have reacted independently to past environmental changes: the EAIS, with its outlet glaciers, and the complex glacial system of northern Victoria Land. It is also a key area for understanding the recent geological evolution of the Transantarctic Mountains.
The characterization and monitoring of active geomorphological processes are also important for detecting the effects of climate change on coastal areas. This mountainous area receives more precipitation and is warmer than the EAIS. For this reason, it is more sensitive to climatic and eustatic fluctuations than other sectors of East Antarctica.
Snow precipitation in the region is determined by elevation and distance from the coast, whereas snow accumulation and ablation are mainly driven by persistent katabatic winds. Snow accumulation prevails to the east of the Mesa Range–Campbell Glacier alignment (less disturbed windy area), where the highest accumulation rate was detected. As a consequence, extensive icefields mantle the relief, sealing the landscape below the ice surface. Ice- and snow-free areas only crop out where persistent katabatic winds sweep away snow, and on steep rocky cliffs; characterized by an ice-marginal, high-latitude periglacial environment, they cover less than 5% of the total area.
Several distinct landscape units were identified. They were distinguished on the basis of their specific geomorphological characters and through correlation with similar features present in neighbouring areas (i.e. the Mount Melbourne, Relief Inlet, Coulman Island and Cape Hallett quadrangles). Thanks to the relationship among relict erosional landforms and volcanic activity, it is possible to place distinct morphological units in a relative temporal sequence.
Mesas, relict landforms rising up to 3000m along the internal margin of the Transantarctic Mountains, characterize the block between Priestley and Campbell Glaciers. Glacial erosion modelled the margins, and ice caps cover the summits of these structural landforms. Intermediate ice-buried structural surfaces develop below the summit mesas and carry residual outliers. This morphology is similar to that described in the Dry Valleys by Reference Sugden, Marchant and DentonSugden and others (1993 Reference Sugden, Denton and Marchant1995), interpreted as dominated by relict landforms inherited from a climatic regime different from the present one.
We believe the valley network is imprinted by a fluvial drainage system strongly controlled by tectonic activity. A network of temperate glaciers later occupied the primitive system of fluvial valleys and the intervening mountains blocks. A well-preserved classic alpine topography developed on the valley flanks and in blocks between the valleys. Only warm-based glaciers can produce such alpine morphologies, while cold-based glaciers cause minimal erosion and, as geomorphic agents, are protective rather than destructive.
The youngest age of glacially scoured volcanic rocks (8.2 Myr) and the oldest age of uneroded volcanic rocks (7.5 Myr) span a period during which a significant change in glacial dynamics occurred (from wet glaciers to polar glaciers). These findings imply that no warm-based ice sheet has covered the region since 7.5 Myr, and that polar conditions similar to those at present have endured since the Late Miocene.
Acknowledgements
This work was carried out within the framework of the Italian Programma Nazionale di Ricerche in Antartide, core project ‘Geomorphological and Glaciological mapping of northern Victoria Land’, and was financially supported through joint research programmes on Geology with the University of Siena and on Glaciology with ENEA. Thanks to D. Sugden and B. Csatho for reviewing the manuscript. We are very grateful to H. A. Fricker and T. H. Jacka for their considerable help in editing the final version of this paper.