


12.1 Introduction
Porosity and permeability are key variables linking the origin, form, movement, and quantity of carbon-bearing fluids that collectively dictate the physical and chemical evolution of fluid–gas–rock systems.Reference Anovitz and Cole1 The distribution of pores, pore volume, and their connectedness vary widely, depending on the Earth material, its geologic context, and its history. The general tendency is for porosity and permeability to decrease with increasing depth, along with pore size and/or fracture aperture width. Exceptions involve zones of deformation (e.g. fault or shear zones), regions bounding magma emplacement and subduction zones. Pores or fractures display three-dimensional hierarchical structures, exhibiting variable connectivity defining the pore and/or fracture network.Reference Keller, Holzer, Wepf and Gasser2–Reference Peth, Horn, Beckmann, Donath, Fischer and Smucker5 This network structure and topology control: (1) internal pore volumes, mineral phases, and potentially reactive surfaces accessible to fluids, aqueous solutions, volatiles, inclusions, etc.Reference Landrot, Ajo-Franklin, Yang, Cabrini and Steefel6–Reference Beckingham, Mitnick, Steefel, Zhang, Voltolini and Swift8; and (2) diffusive path lengths, tortuosity, and the predominance of advective or diffusive transport.Reference Bernabe, Li and Maineult9–Reference Lindquist, Venkatarangan, Dunsmuir and Wong12 For solids dominated by finer networks, transport is dominated by slow advection and/or diffusion.Reference Hay, Stoliker, Davis and Zachara13–Reference Polak, Elsworth, Yasuhara, Grader and Halleck16
Despite the extensive spatial and temporal scales over which fluid–mineral interactions can occur in geologic systems, interfacial phenomena including fluids at mineral surfaces or contained within buried interfaces such as pores, pore throats, grain boundaries, micro-fractures, and dislocations (Figure 12.1) impact the nature of multiphase flow and reactive transport in geologic systems.Reference Hay, Stoliker, Davis and Zachara13, Reference Stack, Fernandez-Martinez, Allard, Banuelos, Rother and Anovitz17–Reference Tokunaga and Wan21 Complexity in fluid–mineral systems takes many forms, including the interaction of dissolved constituents in water, wetting films on mineral surfaces, adsorption of dissolved and volatile species, the initiation of reactions, and transport of mobile species.Reference Cole, Ok, Striolo and Anh22–Reference Zachara, Brantley, Chorover, Ewing, Kerisit and Liu24 Direct observations and modeling of physical (transport) and chemical properties (reactivity) and associated interactions are challenging when considering the smallest length scales typical of pore and fracture features and their extended three-dimensional network structures.Reference Mehmani, Mehmani, Prodanovic and Balhoff25, Reference Steefel, Appelo, Arora, Jacques, Kalbacher and Kolditz26
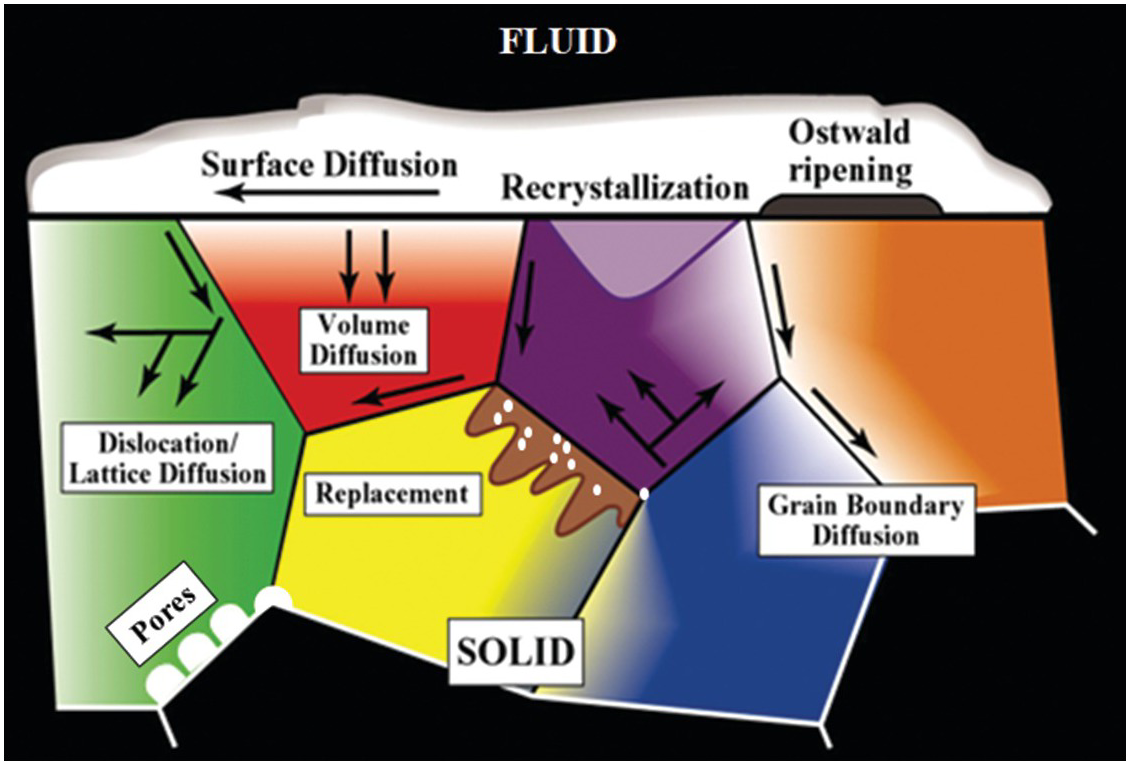
Figure 12.1 Schematic illustration of the various mass transfer and diffusion processes that can control the behavior of fluids and dissolved species in a heterogeneous crystalline matrix.
The various void types and their evolution during reaction with fluids are critically important factors controlling the distribution of the fluid-accessible pore volume, flow dynamics, fluid retention, chemical reactivity, and contaminant species transport.Reference DiCarlo, Aminzadeh, Roberts, Chung, Bryant and Huh27–Reference Deutch and Moniz32 While fracture-dominated flow can be volumetrically dominant in shallow crustal settings or in zones of deformation,Reference Titley33–Reference Ague38 there is a continuum of coupled reaction–transport phenomena at length scales from fractures to the smallest nanopores. Nanoscale pores may interconnect larger volumes, act as pore throats, and play an important role in fracture initiation. Diffusion of chemical constituents from pore fluids along grain boundaries and into solids may drive the textural and chemical evolution of geologic media.Reference Ague38–Reference Marquardt and Faul41
There is general agreement that the collective structure and properties of bulk fluids are altered by solid substrates, confinement between two mineral surfaces, or in narrow pores due to the interplay of the intrinsic length scales of the fluid molecules and the length scale of fluid–solid (i.e. confinement) interactions.Reference Cole, Ok, Striolo and Anh22, Reference Rother, Krukowski, Wallacher, Grimm, Bodnar and Cole42–Reference Gubbins, Long and Sliwinska-Bartkowiak45 The combined effect of confinement and intermolecular forces, which vary among different mineral systems, results in unique (and poorly constrained) perturbations to a wide range of thermodynamic and transport parameters, generally different from those observed in the bulk phase.Reference Firincioglu, Ozkan and Ozgen46–Reference Clarkson, Haghshenas, Ghanizadeh, Qanbari, Williams-Kovacs and Riazi51 Also impactful is the degree of randomness of the matrix, geometry, surface composition (e.g. silicates, carbonates, organic matter (OM)), fractal nature of the pores, and connectivity of the pore network.Reference Ho, Criscenti and Wang52
It has also been hypothesized that chemical reactions in pores smaller than 100 nm may be different from those in larger pores because of: (1) confinement-induced changes in fluid properties and associated solutes (e.g. electrolytes, scCO2, CH4)Reference Ferreira, Schulthess and Giotto53; (2) shifts in thermodynamic equilibrium compositionReference Turner, Ferrare, Brasseur and Feltz54–Reference Santiso and Firoozabadi56; and (3) overlapping electric double layers and surface curvature, distribution of preferential adsorption sites, surface charge, and counterion behavior.Reference Abbas, Nadeem, Zafar and Arshad57 The question as to whether surface chemical processes (e.g. ionization, complexation, adsorption) in nanopores differ from those in macropores (>100 nm) remains largely unresolved. Compounding this is the formidable challenge in characterizing the structure and dynamics of fluid species within internal pore or fracture networks.Reference Hay, Stoliker, Davis and Zachara13 Predictions on the direction and magnitude of changes in chemical reactions have not been thoroughly explored, despite the fact that the large surface area contributed by smaller pores can make them extremely significant in fluid–rock interactions.Reference Landrot, Ajo-Franklin, Yang, Cabrini and Steefel6–Reference Beckingham, Mitnick, Steefel, Zhang, Voltolini and Swift8, Reference Beckingham, Steefel, Swift, Voltolini, Yang and Anovitz58
This chapter seeks to show how the structure of nanoconfined fluids is responsible for a variety of effects relevant to the origin, form, movement, and quantity of carbon-bearing fluids. “Form” is related to the molecular structure of confined fluids, which includes segregation of molecular species across the pore. In Section 12.3, we discuss how form is related to “movement,” which is reflected by the diffusion and transport mechanisms of confined fluids. In Section 12.4, we discuss how form relates to “quantity” (i.e. the solubility of gases in confined fluids). In Section 12.5, we discuss how form is related to “origin,” restricted to the reactivity of nanoconfined fluids.
The richness and complexity of fluid behavior (e.g. phase transitions, molecular orientation and relaxation, diffusion, adsorption, wetting, capillary condensation, etc.) in confined geometries underscores the need to adopt a multidisciplinary approach. In concert with molecular simulations, there is a robust set of experimental approaches used to directly or indirectly probe the behavior of fluids at interfaces or in nanopore confinement. The reader is referred to our previous researchReference Cole, Ok, Striolo and Anh22 and to a number of excellent reviews on molecular dynamics (MD)Reference Striolo50, Reference Turner, Brennan, Lisal, Smith, Johnson and Gubbins55, Reference Allen and Tildesley59–Reference Senftle, Hong, Islam, Kylasa, Zheng and Shin64 and experimental methods and outcomes.Reference Fenter and Sturchio65–Reference Gautam, Le, Striolo and Cole71
12.2 Nanopore Earth Materials and Fluids
12.2.1 Nanopore Features
Porosity and permeability are key variables that link the thermal, hydrologic, geomechanical, and geochemical behavior exhibited by most, if not all, fluid–rock systems. In general, there is a strong positive correlation between porosity and permeability in many porous and fractured geologic media (see NelsonReference Nelson72 for sedimentary rocks and Ingebritsen et al.Reference Ingebritsen, Sanford and Neuzil73 for crystalline rocks). What is truly remarkable is the extraordinary range in measured permeability (some 16 orders of magnitude), from as high as 10–7 m2 (105 Darcy) for well-sorted gravel to as low as 10–23 m2 (sub-nano Darcy) in crystalline rocks, mudstones (shale), fault gouges, and halide deposits.Reference Ague38, Reference Gleeson and Ingebritsen74 An assortment of measurements (e.g. deep borehole, core-scale flooding, geophysical) indicates that both porosity and permeability tend to decrease with increasing depth. For example, permeability measurements of core obtained from the Kola superdeep well (11.4–12.0 km) range from 10–17 to 10–22 m2, depending on the effective confining pressure.Reference Lockner, Byerlee, Kuksenko, Ponomarev and Sidorin75 In a series of seminal papers, Ingebritsen and ManningReference Ingebritsen and Manning76–Reference Ingebritsen and Manning78 described the permeability of continental crust as a function of depth in the context of specific geologic settings. They demonstrated that permeabilities decreased rapidly through the brittle portion of the crust to values between 10–14 and 10–16 m2 at a depth of approximately 10 km. Below this depth through the brittle–ductile transition zone (~10–15 km) extending to depths of roughly 25 km, the permeability becomes more constant with depth, ranging between 10–16 and 10–18 m2.
Norton and KnappReference Norton and Knapp39 documented the porosity of numerous crystalline rocks and classified pores (fractures) into three broad categories: flow, diffuse, and residual (isolated). Of these, the first two are relevant to the nature of the permeability regimes, in that the smaller, sometimes dead-ended diffuse pores and pore throats contribute to the chemistry of the larger, throughgoing connected pores and fractures (i.e. flow porosity). The diffuse porosity estimates identified by Norton and KnappReference Norton and Knapp39 for volcanic and crystalline rocks range from 0.01% to 10%. Bredehoeft and NortonReference Bredehoeft and Norton79 expanded on this by providing estimates of permeability for fractured igneous and metamorphic rocks that range from 10–12 to 10–16 m2, and for unfractured equivalents ranging from 10–17 to 10–20 m2. Anovitz and ColeReference Anovitz, Cole, Jackson, Rother, Littrell and Allard80, Reference Anovitz, Cole, Vialle, Ajo-Franklin and Carey81 surveyed the many techniques used to quantify pore features (e.g. advanced electron microscopy, X-ray, and neutron scattering) and indicated that the range in pore size measured in rocks (sedimentary, igneous, and metamorphic) can vary by approximately eight orders of magnitude from the nanometer scale to the millimeter scale.
General nanoscale features observed in many rocks include intergranular or interparticle (Figure 12.2a, c, and d) versus intraparticle porosity (Figure 12.2b, e, and f). The latter pore type is frequently the result of dissolution–precipitation processes and is typically less well connected to the flow porosity compared to intergranular porosity involving grain-to-grain contacts of two different phases known as interphase boundaries or grain boundaries, defined as the interface of two grains of the same phase. The intergranular pore type is thought to control transport in very tight rocks, especially those encountered deeper in the crust and mantle. As Wark and WatsonReference Wark and Watson82 point out, the premise is that rocks below the brittle–ductile transition (>12 km for continental crust) cannot sustain a fracture network system, and thus fluids – especially at low-volume fractions – must reside in intergranular pores. Intergranular fluids, however, will flow only if the pores (i.e. grain boundaries in this case) are interconnected. Fluid flow may be a misnomer when discussing very deep-seated rocks. The width of space between grains in very deep crustal and mantle rocks (e.g. olivine-rich mantle) has been a source of debate for many years. Marquardt and FaulReference Marquardt and Faul41 provided an excellent summary of the structure and composition of olivine grain boundaries and conclude that the width is on the order of 1 nm or less (Figure 12.3a). At this reduced dimension, fluid mobility takes the form of grain boundary diffusion, which can be several orders of magnitude greater than volume (lattice) diffusion through minerals, but many orders of magnitude slower than advective flow.Reference Cole and Chakraborty83–Reference Farver85 Nevertheless, fluids do penetrate these spatially restricted domains, as evidenced by dissolution, grain boundary migration, and phase alteration (e.g. olivine conversion to serpentine) (Figure 12.3b). High-resolution transmission electron microscopy reveals that some olivine-rich rocks like the San Carlos olivine also display amorphous films that are 1–2 nm wide between olivine grains thought to be remnant melt.Reference Wirth86
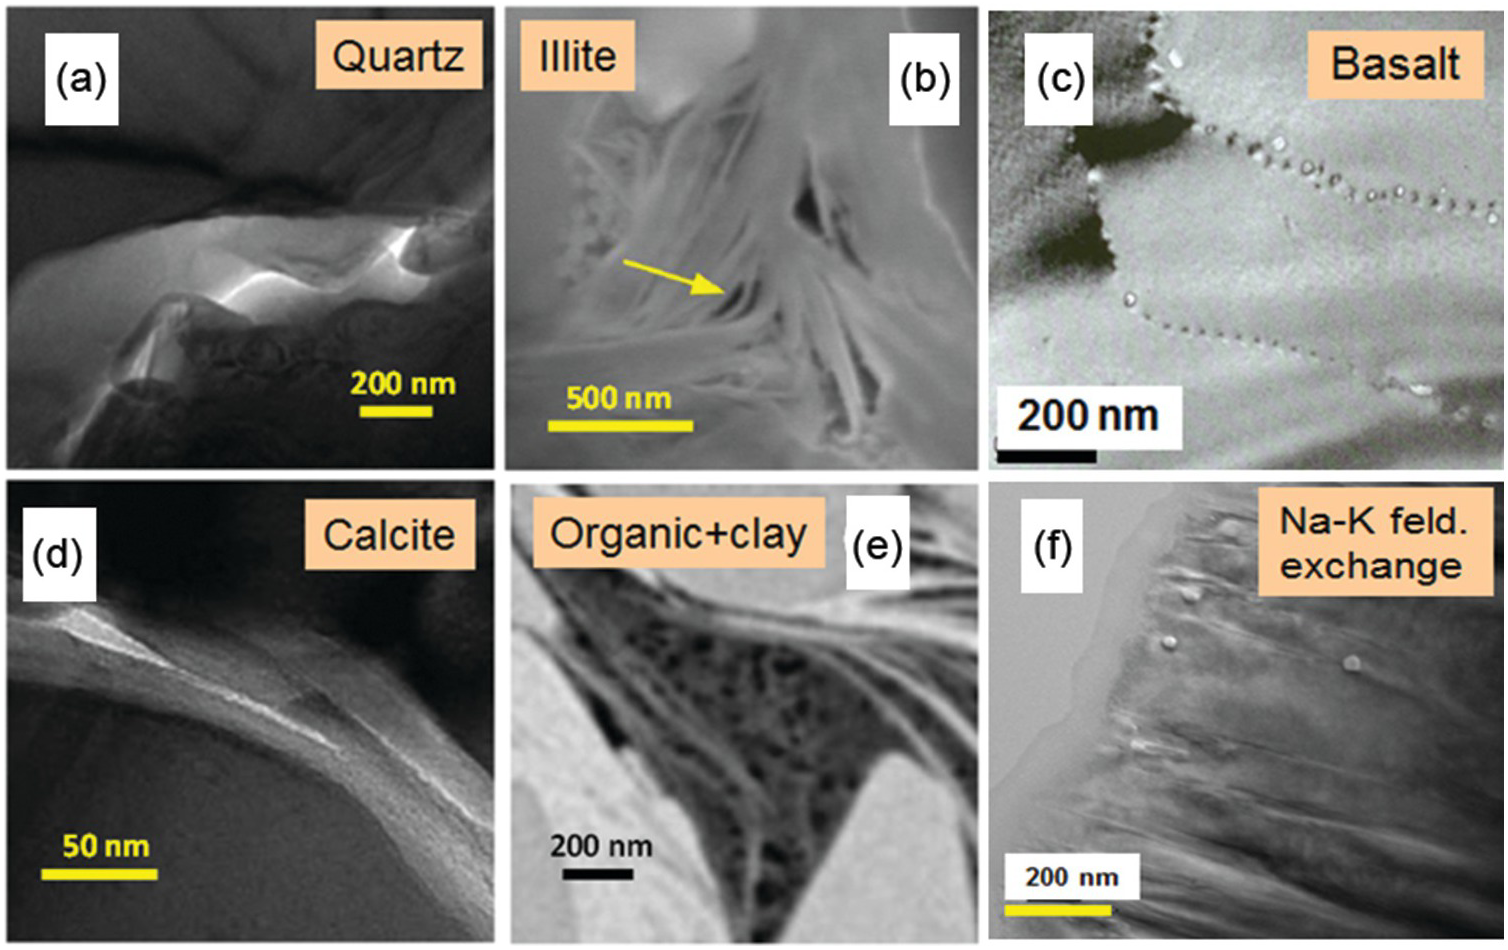
Figure 12.2 Transmission electron microscopy images of different nanoscale pores. (a) St. Peter sandstone, Wisconsin; (b) illite from Utica shale, Ohio; (c) basalt clast, Costa Rica; (d) Hueco limestone, north Mexico; (e) organic embedded in clay, Utica shale, Ohio; (f) experimental hydrothermal replacement of adularia by albite, 600°C, 200 MPa.
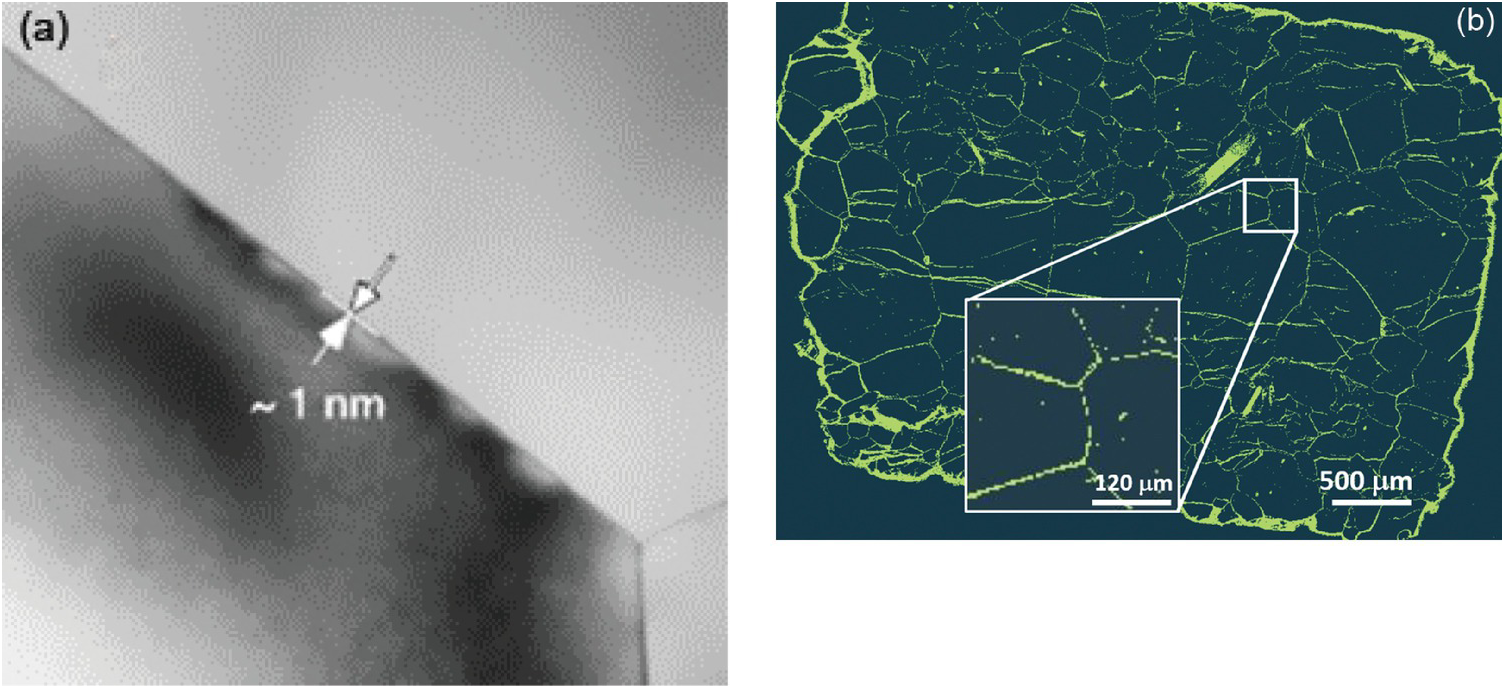
Figure 12.3 (a) High-resolution transmission electron microscopy image of the San Carlos olivine grain boundary and triple junction (from Marquardt and FaulReference Marquardt and Faul41). Note the estimated grain boundary width of ~1 nm. (b) Balsam Gap dunite showing the extent of fluid infiltration and serpentinization along olivine grain boundaries, hydrothermally treated at 300°C, 200 MPa.
The presence of nanoscale pores and fractures seems to be widespread in Earth materials and may be extremely significant for controlling fluid accessibility in deep-seated crustal and upper-mantle rocks depending on the extent of pore network connectivity. Pores may be either slit-like or cylindrical in shape and can exist along grain boundaries, at the contact of unlike grains (interphase boundaries), or entirely within a given phase. In simplest terms, the pore surface compositions are dominated by silica or silicates, oxides, clay, carbonate, and, where present, OM of varying thermal maturity. As we discuss below, it is at the dimensions of a few nanometers to tens of nanometers that fluid properties deviate significantly from those of the bulk fluids.
12.2.2 Fluid Properties Affected by Nanoconfinement
It has been reported that the collective structure and properties of bulk fluids are altered by confinement between two surfaces or in narrow pores due to the interplay of the intrinsic length scales of the fluid and the length scale due to confinement.Reference Gelb, Gubbins, Radhakrishnan and Sliwinska-Bartkowiak87–Reference Alba-Simionesco, Coasne, Dosseh, Dudziak, Gubbins and Radhakrishnan89 For example, melting/freezing of water is affected by confinement in geomaterials,Reference Wang, Kalinichev and Kirkpatrick90, Reference Wang, Kalinichev and Kirkpatrick91 and confined fluids can be liquid at the thermodynamic conditions (pressure and temperature) at which the correspondent bulk fluids are gaseous. It has also been shown that confinement can promote new phases that simply do not exist in the bulk.Reference Radhakrishnan, Gubbins and Sliwinska-Bartkowiak92 This has been an area of particular interest to those who investigate the properties of water. It has been demonstrated that confined water can be prevented from freezing at conditions well inside the “no-man’s land.”Reference Gallo, Arnann-Winkel, Angell, Anisimov, Caupin and Chakravarty93 It is possible that similar effects will also be observed for carbon-bearing fluids, although perhaps the high temperature in the subsurface will prevent the formation of exotic phases. In point of fact, almost any fluid property is influenced by nanoconfinement to a varying degree: thermophysical (e.g. density, phase behavior, dielectric constant, compressibility), transport (e.g. diffusion, shear), dynamical motion (translational, rotational, vibrational, and librational), and interfacial interactions (e.g. adsorption, wetting, solubility) are expected to be strongly dependent upon confinement.
12.3 Form and Movement: Transport Mechanisms under Nanoconfinement
The main mechanisms responsible for fluid transport are convective motion and molecular diffusion. When the pore size becomes of the order of magnitude of fluid molecules (i.e. in nanopores), diffusion can become the dominant mechanism. Because in the subsurface many pores are in this size regime, it is important to understand the mechanisms by which molecular diffusion can take place in nanopores. In this section, we discuss how the structure of confined fluids (form) affects their transport (movement). We focus on fluid mixtures. The studies summarized here are selected primarily from the body of work produced by the authors. Future investigations will stress the wide applicability of our extrapolations.
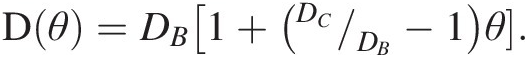
As a first example, we refer to Chiavazzo et al.,Reference Chiavazzo, Fasano, Asinari and Decuzzi94 who used computer simulation to investigate water transport in “nanoconfined geometries” (i.e. within nanopores, around nanoparticles, carbon nanotubes, and proteins). Almost 60 cases were considered, some being obtained from the literature. The results, reproduced in Figure 12.4, were interpreted using a general phenomenological relationship:
 (12.1)
In (12.1), D is the overall self-diffusion coefficient of water calculated in the various systems and DC and DB are the self-diffusion coefficients estimated for confined and bulk water, respectively. According to this relationship, D was found to scale linearly with the ratio θ between “surface” and total water volumes. The “surface” water volume is a measure of the interfacial region where water molecules are in contact with the confining material. As the pore width decreases, the amount of “surface” versus total volume increases.
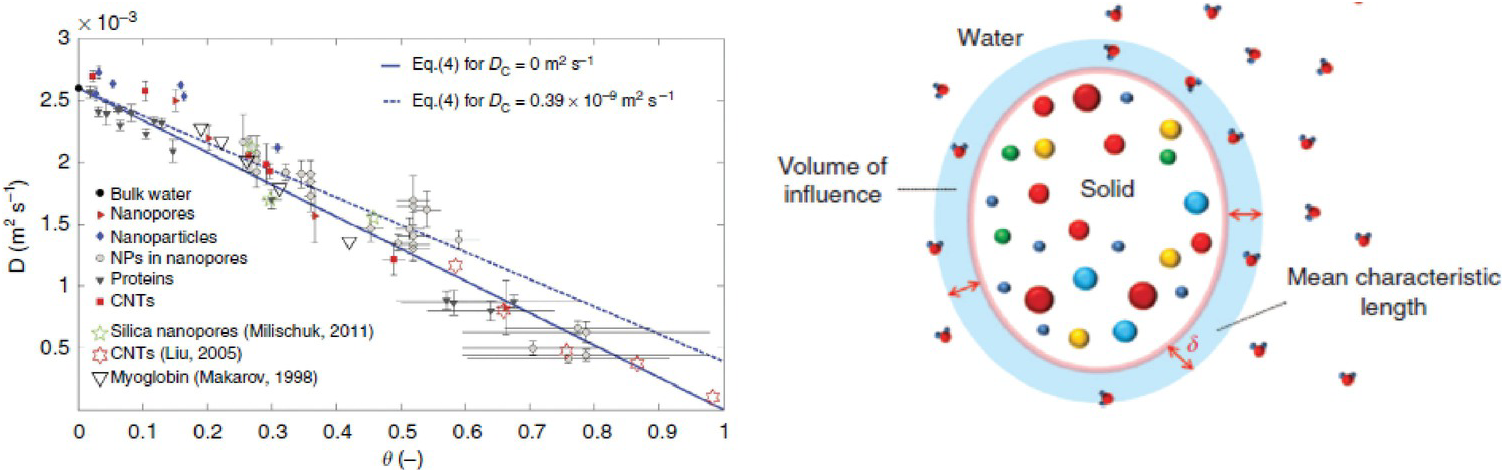
Figure 12.4 (Left) Self-diffusion coefficient for nanoconfined water as a function of the ratio θ between “surface” and total water volumes. The image contains simulation results for many systems. (Right) Schematic illustrating the region of influence of a solid substrate on an interfacial fluid.
12.3.1 Steric Effects Enhance Surface versus Pore Diffusion
When fluid molecules are confined within nanopores, they can experience a strong attraction to the pore surfaces (e.g. via hydrogen bonds). It is possible that the molecules strongly adsorbed on a surface show very slow diffusion parallel to the surface (i.e. surface diffusion). This is because to move from one adsorption site to an adjacent one, the fluid molecules need to be released from one strong interaction. Hopping mechanisms can be observed, in which one molecule hops from one preferential adsorption site to the next. As the adsorption energy becomes stronger, the frequency of such hops lowers, and diffusion is delayed. If the preferential adsorption sites are so close to each other that hopping is not necessary, it is possible to observe sliding.Reference Ho, Papavassiliou, Lee and Striolo95 It is generally assumed that surface diffusion is slower than that near the pore center (i.e. “pore diffusion”). For a pure fluid, as the pore size decreases, the contribution of surface diffusion increases compared to that of surface diffusion, as shown in Figure 12.4 in the case of water.
However, we also know that the opposite situation can also arise. Phan et al.Reference Phan, Cole and Striolo44 considered a fluid mixture composed of ethanol and water inside a slit-shaped alumina nanopore of width 1 nm. The pore surface exposed a high density of –OH groups. Equilibrium studies on a flat surfaceReference Phan, Cole and Striolo43 showed that water preferentially adsorbs on the alumina substrate and displaces ethanol molecules, should these be present on the surface. When the pore is of 1 nm, the physical state of the system, depending on composition, can present one layer of water on each of the two pore surfaces, with ethanol near the pore center. The pore width is so narrow that steric effects hinder the diffusion of ethanol near the pore center, while water surface diffusion is possible. This effect disappears when the pore width increases. A detailed analysis of the trajectories of the confined water molecules showed that the diffusion of water is characterized by hops. Such hops are from one adsorption site to another one on the surface across the pore volume. This mechanism becomes hindered as the pore width increases because the water molecules would have to transport across a large region filled with ethanol. In this example, increasing pore width delays water surface diffusion while allowing faster ethanol pore diffusion.
Complementary experimental investigations are difficult because it is hard to differentiate between molecules that are adsorbed on the surface from those that accumulate near the pore center. Some experimental results, however, suggest that, in some cases, surface diffusion can be the dominant transport mechanism. For example, Kim et al.Reference Kim, Brunelli, Brown, Jang, Kim and Rashidi96 synthesized “silylated” mesoporous silica membranes. The chemical functionalization made the pore surfaces more attractive for ethanol than for water. Once exposed to water–ethanol liquid mixtures, ethanol permeated the membranes much faster than water, suggesting that surface diffusion became an important mechanism of transport. Ge et al.Reference Ge, Wang and Yan97 used zeolites to enhance polymer-based composite membranes. The zeolites preferentially attracted water, and separation factors of ~10,000 were achieved in water-removal pervaporation processes (i.e. water permeated these membranes much faster than ethanol). For completeness, it should be remembered that the permeability of a membrane is equal to the product of the diffusion coefficient of the fluid through the membrane and the amount adsorbed. Thus, enhanced diffusion might not be the only mechanism responsible for the results just discussed.
12.3.2 Molecular Lubrication Enhances Pore Diffusion
Even in the absence of preferential adsorption sites where nonspecific attractive interactions lead to an accumulation of fluids near pore surfaces, it is generally expected that the diffusion of the fluid molecules in a nano- to meso-pore is slower than that in the bulk. For example, the enhanced fluid density near the pore walls leads to more frequent fluid–fluid and fluid–pore collisions, which reduce the mean free path and the diffusion coefficient. This expectation is demonstrated, for example, by quasielastic neutron scattering (QENS) experiments conducted for ethane in the gas phase. When ethane was confined in two SiO2 pore-glass materials with pore sizes 11.1 and 41.5 nm, the self-diffusion coefficient was found to be a factor of ~4 slower compared to that measured for bulk ethane at similar temperature–pressure conditions.Reference Patankar, Gautam, Rother, Podlesnyak, Ehlers and Liu98
If these results are due to the fluid accumulation near the pore interface, then it might be possible to enhance the fluid diffusion by adding small amounts of another fluid that preferentially adsorbs on the solid substrate. For example, Le et al.Reference Le, Striolo and Cole99, Reference Le, Ogbe, Striolo and Cole100 simulated systems containing a hydrocarbon (either butane or octane) and CO2 in a silica slit-shaped pore of width ~2 nm. CO2 formed molecularly thin layers on the pore surfaces, while the hydrocarbon filled the pore. At low dosages, CO2 enhanced hydrocarbon diffusion. These computational results were confirmed by Gautam et al.Reference Gautam, Liu, Rother, Jalarvo, Mamontov and Welch101 and Patankar et al.,Reference Patankar, Gautam, Rother, Podlesnyak, Ehlers and Liu98 who used QENS to study the diffusion of propane and ethane in mesoporous SiO2, respectively, in the presence of CO2. The ethane experiments, conducted at different temperatures, showed that the activation energy of diffusion decreased in the presence of CO2 by a factor of ~2 compared to data obtained for pure ethane, which was consistent with the simulations. Others also reported that CO2 enhanced the diffusion of hydrocarbons through different porous materials.Reference Le, Striolo and Cole99, Reference Gautam, Liu, Rother, Jalarvo, Mamontov and Welch101, Reference Chathoth, He, Mamontov and Melnichenko102
12.3.3 Molecular Hurdles Due to Strong Fluid–Fluid Interactions
The enhanced diffusion discussed in Section 12.3.2 is due to the preferential adsorption of CO2 to the pore surface, but one can ask whether similar observations are possible when a fluid other than CO2, also strongly attracted to the pore surface, is used. One such fluid could be water. Gautam et al.Reference Gautam, Jalarvo, Rother, Liu, Mamontov and Dai103 used QENS to probe whether this was the case. The system used contained propane and D2O in silica-based, cylindrical pores of diameter ~1.5 nm. The experimental results showed that the propane diffusion was depressed, rather than enhanced, by D2O. Le et al.Reference Le, Striolo, Gautam and Cole104 conducted MD simulations for a system mimicking the experimental one. The results showed that although water molecules are strongly adsorbed on the pore surface, the pores have such a narrow diameter and the water–water interactions are so strong that water molecules form molecular bridges across the pore volume. These bridges hinder propane diffusion. Simulation snapshots illustrating the phenomenon are shown in Figure 12.5.
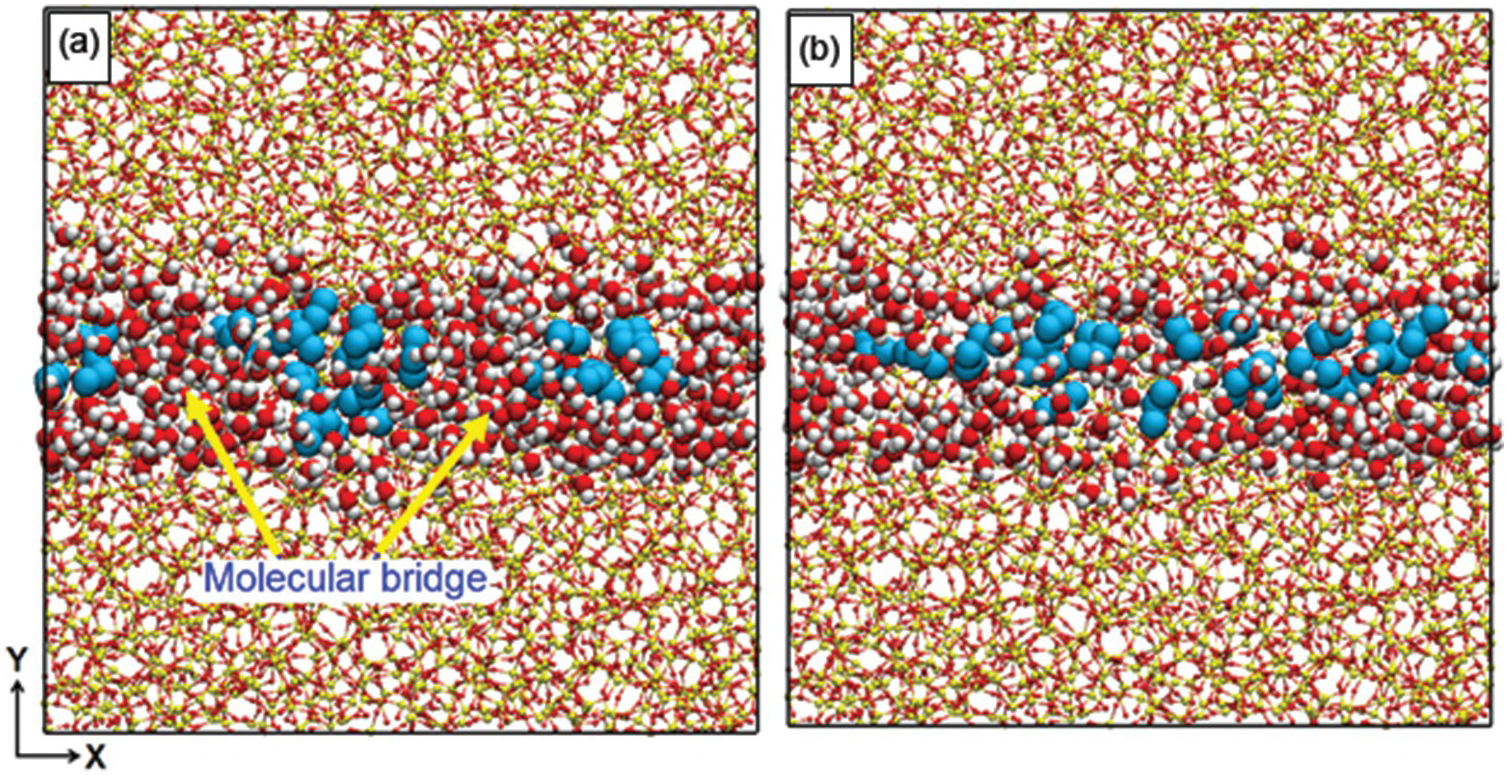
Figure 12.5 Simulation snapshots representing the effect of water molecular bridges (red and white spheres) on the transport of propane (cyan spheres) diffusing through a cylindrical pore carved out of amorphous silica (red and yellow spheres connected by lines). In (a), the water bridges hinder the transport at higher water/gas ratios (≥17), while in (b), the bridges are dissociated and propane diffusion is faster at lower water/gas ratios (≤12).
The formation of water bridges was also found to delay methane transport across slit-shaped muscovite pores. Ho and StrioloReference Ho and Striolo105 found that methane convective transport within slit-shaped pores carved out of muscovite and partially filled with water is strongly dependent on the relative orientation of the water bridges and that of imposed motion. When the water bridges are perpendicular to the direction of motion, methane transport is regulated by the movement of water, which adheres to the pore surface. When the water bridges are parallel to the direction of motion, fast methane transport is observed.
Phenomena such as those just described are expected to be important when low-solubility or immiscible fluids are simultaneously present within a pore, and they are relevant for the production of shale gas, in which water is often used as the fracturing fluid. Many studies have addressed how methane could escape kerogen. These studies could be relevant for systems in which pores are extremely heterogeneous in geometry and of comparable size to the fluid molecules.
12.3.4 Transport of Guest Molecules in Confined Fluids
It is worth discussing the relation between the structure of fluids in confined water and their transport. Phan et al.Reference Phan, Cole, Weiss, Dzubiella and Striolo106 simulated the transport of a mixture mimicking natural gas (ethane, methane, and H2S) through nanopores filled with water. The results show that H2S permeates the pores much faster than the other compounds and that ethane is too large to permeate the hydrated pores. Bui et al.Reference Bui, Phan, Cole and Striolo107 extended the study to consider different porous materials. In the left-hand panel of Figure 12.6, we report the self-diffusion coefficient estimated for water in various nanopores: confinement reduces the self-diffusion of water, consistent with Figure 12.4. For reference, MD simulations yield a self-diffusion coefficient for bulk liquid water of ~28 × 10–10 m2/s.Reference Mark and Nilsson108 The results in Figure 12.6 also show that the chemical properties of the minerals are important: all the pores considered have the same width and the simulation temperature is constant, yet the water self-diffusion coefficient varies by a factor of ~2. In the right-hand panel of Figure 12.6, we report the self-diffusion coefficients estimated for aqueous methane confined in the water-bearing pores considered in the left-hand panel of Figure 12.6. There is a correlation between the self-diffusion coefficient of water and that of aqueous methane, but there are also deviations. Bui et al.Reference Bui, Phan, Cole and Striolo107 highlighted the fact that the diffusion of aqueous methane in calcite nanopores can be anisotropic (the diffusion along the x-axis of the pore is about three times faster than that along the y-axis). For completeness, it is worth pointing out that anisotropic diffusion of hydrocarbons had been previously reported in nanopores carved out of calcite by Franco et al.,Reference Franco, Castier and Economou109 suggesting that the surface structure of this solid material indeed affects the transport of the guest molecules.
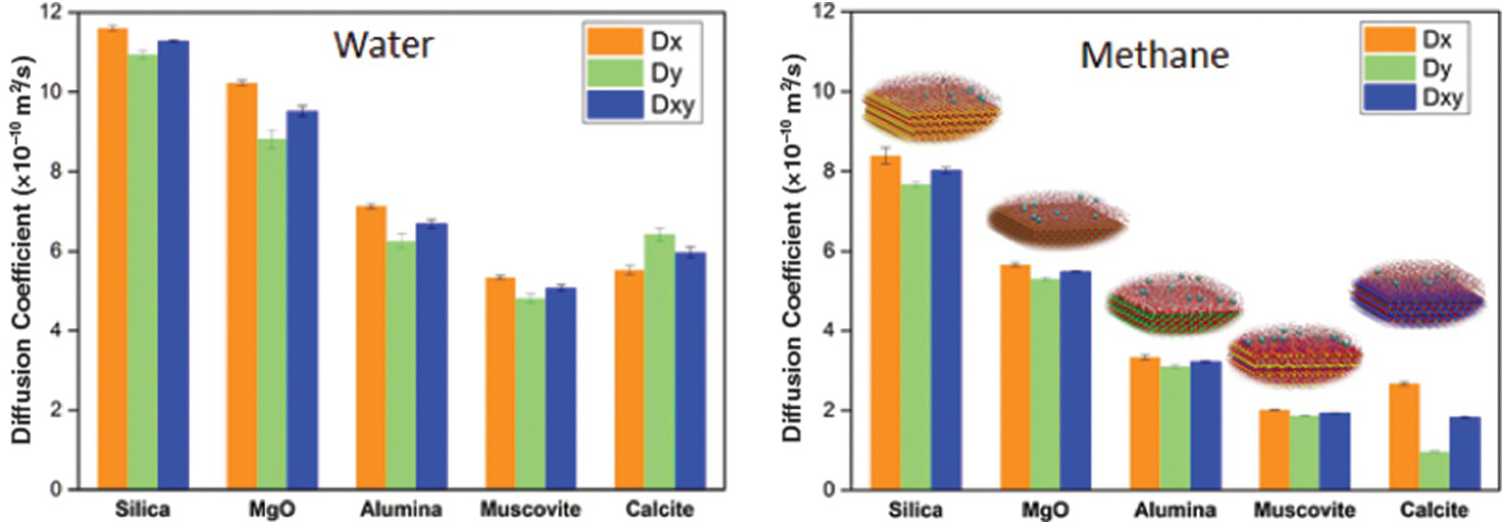
Figure 12.6 (Left) Self-diffusion coefficient for water in slit-shaped pores of width 1 nm carved out of different minerals at the same temperature. (Right) Self-diffusion coefficient for methane molecules dissolved in confined water. The results distinguish the diffusion coefficients along two perpendicular directions. While the self-diffusion coefficient for water is for the most part isotropic, that of aqueous methane in calcite pores is highly anisotropic, with transport along the x-axis being much faster than that along the y-axis.
12.3.5 Transport of Aqueous Electrolytes in Narrow Pores
Argyris et al.Reference Argyris, Cole and Striolo110 and Ho et al.Reference Ho, Argyris, Cole and Striolo111 attempted to quantify the mobility of aqueous electrolytes at low concentration within narrow slit-shaped pores. The goal was to quantify potential differences in the mobility of Cs+ and Na+ ions, which have the same valence but significantly different size. The aqueous solutions were electrostatically balanced by Cl– ions. These MD simulations were conducted at similar conditions (1 M ionic strength, ambient temperature). The cristobalite silica pores were slit-shaped, with widths of ~1.2 nm. The surface chemistry was manipulated to replicate different pH scenarios. The results were quantified in terms of the self-diffusion coefficients of the electrolytes in the direction parallel to the pore surface. A strong correlation was observed between the preferential position of an ion in the direction perpendicular to the pore surface and its mobility. This correlation was interpreted based on prior resultsReference Ho, Argyris, Papavassiliou, Striolo, Lee and Cole112, Reference Argyris, Cole and Striolo113 that revealed that the mobility of interfacial water strongly depends on the distance from the solid substrate, as well as on the protonation state of the surface. The results concerning ion mobility are summarized in Figure 12.7.
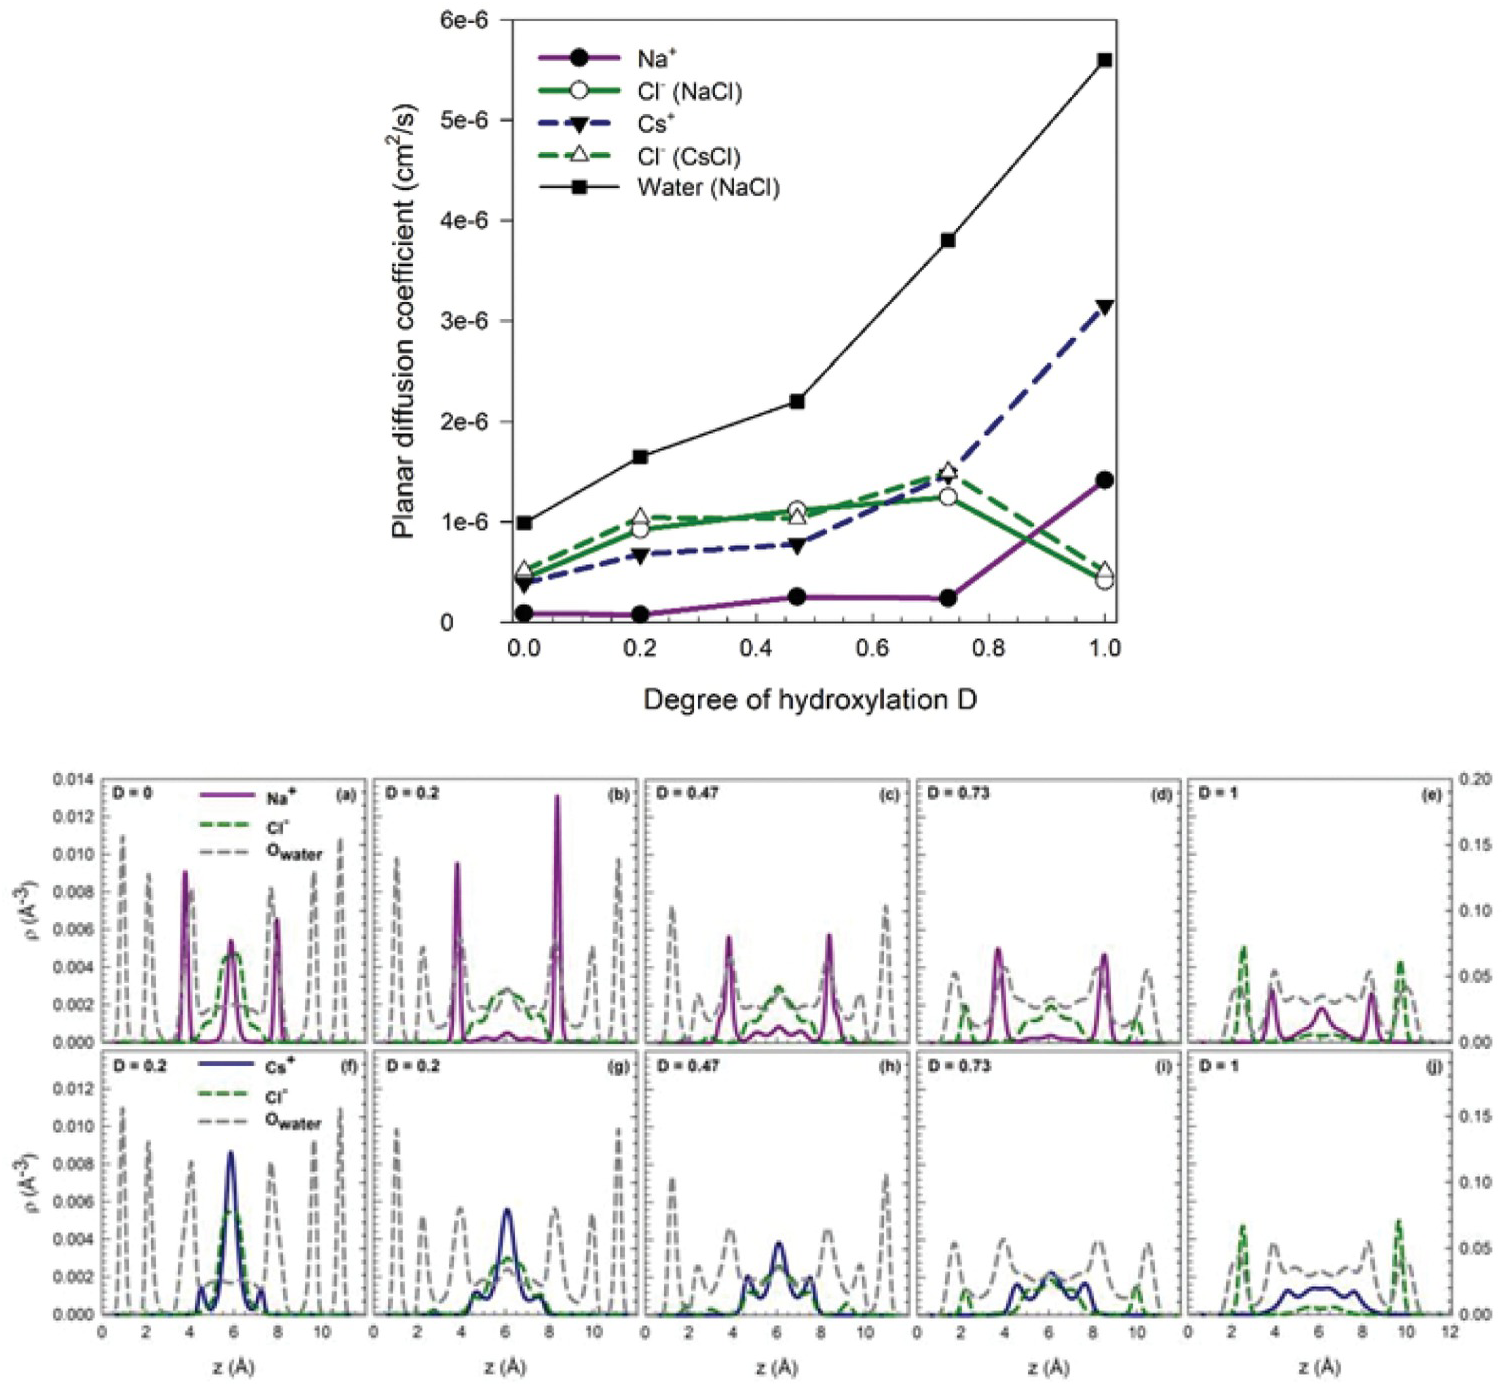
Figure 12.7 (Top) Self-diffusion coefficient estimated for different aqueous electrolytes and water in slit-shaped pores as a function of the degree of protonation D (D=0 in panel (a); D=0.2 in (b); D=0.47 in (c); D=0.73 in (d); and (D=1 in (e)). In all systems, Cs+ ions are more mobile than Na+ ions. (Bottom) Density profiles in the direction perpendicular to the solid substrate, with the same degree of protonation as in Top panels (panels f-j). The density profiles discriminate NaCl and CsCl systems. In general, the Cs+ ions accumulate near the centers of the pores, while Na+ ions are more closely associated with the pore surfaces. Because the molecular mobility depends on the distance from the surface, slower near the surface, the preferential distribution correlates with the ionic mobility.
It is worth stressing that the results depend strongly on the properties of the pore surface. In fact, MD simulations by Rotenberg et al.Reference Rotenberg, Marry, Dufreche, Malikova, Giffaut and Turq114 have shown how Cs+ ions tend to accumulate near clay surfaces, presumably because of the difference in surface charge. Because of the importance of preferential adsorption sites (e.g. see the recent contribution by Loganathan and KalinichevReference Loganathan and Kalinichev115), which include pore edges, and because of the practical importance of quantifying ion migrations in the subsurface, advanced force fields are being developed to enhance the reliability of atomistic simulations,Reference Levesque, Marry, Rotenberg, Jeanmairet, Vuilleumier and Borgis116–Reference Pouvreau, Greathouse, Cygan and Kalinichev118 and various approaches are being developed to include hydrodynamics and multiscale properties in the calculations.Reference Botan, Marry, Rotenberg, Turq and Noetinger119–Reference Rotenberg, Marry, Salanne, Jardat and Turq122
12.4 Form and Quantity: Confinement Effects on Solubility
To estimate the amounts of fluids present in the subsurface, one approach could be first to estimate the volume available (i.e. the accessible pore space) and then to use our understanding of bulk fluids to estimate the amount of fluids in such a volume at the subsurface pressure–temperature conditions. This approach is reasonable as long as the fluid behavior in the bulk is consistent with that in the subsurface, which it is for larger pores (>100 nm). In this section, we discuss the effects nanopores have on the structure of fluids (“form”) that deviate markedly from the bulk. One property affected strongly by nanoconfinement is solubility. Another property of importance concerns the behavior of aqueous electrolytes in confinement. Because confinement alters the dynamics of water molecules, could it be that the dielectric constant of water in the deep subsurface differs strongly from that known in the bulk? Should this be the case, what are the implications regarding our still limited understanding of aqueous electrolytes in the subsurface?
12.4.1 Volatile Gas Solubility in Confined Liquids
Several studies reported an enhanced solubility of gases in liquids confined in small pores,Reference Ho, Clauzier, Schuurman, Farrusseng and Coasne123, Reference Hu, Huang, Zhao, Liu and Gubbins124 a phenomenon referred to as “oversolubility.” Luzar and BratkoReference Luzar and Bratko125 reported 5–10-fold enhancements of N2 and O2 solubility in water in 38–43‑Å hydrophobic pores. Experiments support these estimates. Pera-Titus et al.Reference Pera‐Titus, El‐Chahal, Rakotovao, Daniel, Miachon and Dalmon126 studied the solubility of H2 in CHCl3, CCl4, n-hexane, ethanol, and water within γ-alumina, silica, and MCM-41 and found that H2 solubility was enhanced by up to 15 times when the pore size was <15 nm. Rakotovao et al.Reference Rakotovao, Ammar, Miachon and Pera-Titus127 confirmed these results using 1H nuclear magnetic resonance (NMR).
According to Ho et al.,Reference Ho, Clauzier, Schuurman, Farrusseng and Coasne123 oversolubility could be due to: (1) more favorable interactions between solute and solid than between solvent and solid, favoring solute adsorption close to the pore walls; (2) the pore being partially filled, resulting in a gas–solvent interface; and (3) adsorption of the gas being favored in regions of low solvent densities due to layering. Gadikota et al.Reference Gadikota, Dazas, Rother, Cheshire and Bourg128 showed that solute size and the presence of salt in confined water are also important in modulating the dissolution of various gases in confined water. Using both experiments and simulations, these authors demonstrated greater solubility for CO2 and Ar in Na-montmorillonite compared to bulk water, whereas confinement reduced CH4. Gadikota et al.Reference Gadikota, Dazas, Rother, Cheshire and Bourg128 analyzed the contributions to the free energy of solvation due to cavity formation and affinity to the water-filled pore. The free energy change due to cavity formation was found to be generally positive (i.e. it introduces a barrier to solubility), while the enthalpic contribution is generally favorable to solubilization. Both effects depend on the size of the gas molecule.
Phan et al.Reference Phan, Cole and Striolo129 revealed approximately one order of magnitude higher solubility of methane in water confined in a partially filled 1 nm-wide silica pore. Methane molecules accumulated in narrow regions within the pores, where water molecular density was low. It was found that water molecules surrounding the guest methane were organized in hydrogen-bonded structures resembling gas hydrates. However, because of steric constraints, these clathrates were not stable. Phan et al.Reference Phan, Cole and Striolo130 also considered other 1‑nm slit-pore systems (MgO, Al2O3). The results demonstrated that methane solubility in confined water strongly depends on the confining material (Figure 12.8) because the molecular structure of confined water differs markedly within the three pore types. A direct correlation was observed between methane diffusion coefficients and water molecular density fluctuations.
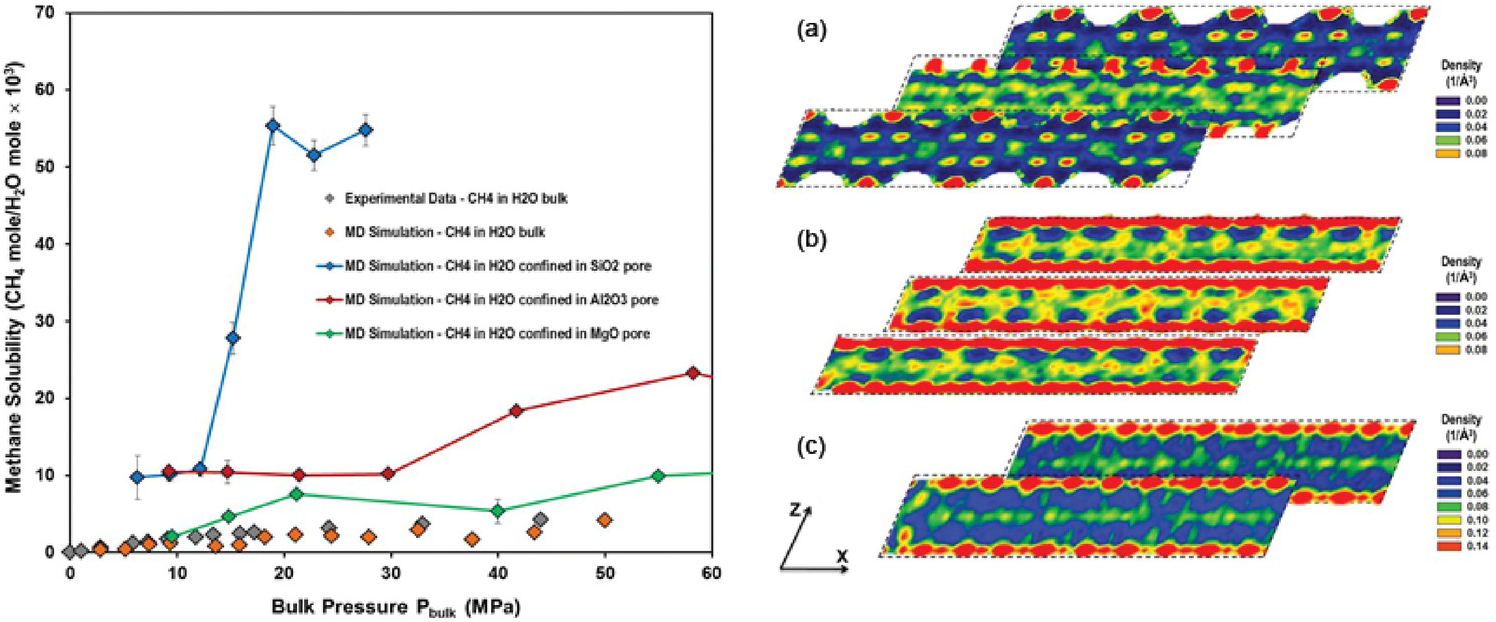
Figure 12.8 (Left) Methane solubility in confined water as a function of bulk pressure in MPa – SiO2 blue, Al2O3 red, MgO green. Simulated bulk solubility of methane in liquid water at 298 K from Sakamaki et al.Reference Sakamaki, Sum, Narumi, Ohmura and Yasuoka131 (Right) Variability for in-plane density distributions of water oxygen in layers parallel to the x–z plane at several locations along the y-axis within (a) SiO2, (b) Al2O3, and (c) MgO. The results are for pores containing only water. Densities are expressed in number of molecules per cubic Å.
These observations are in contrast to those by Badmos et al.,Reference Badmos, Striolo and Cole132 who estimated, using molecular dynamics, the solubility of H2S in water confined in silica nanopores at 313 K. The simulation results suggested that confinement reduces the H2S solubility in water and that the solubility increases with increasing pore size. These results are due to perturbations on the coordination of water molecules around H2S due to confinement. The perturbations are stronger in the narrowest pores considered. These results are qualitatively consistent with those reported for aqueous NaCl reported by Malani et al.Reference Malani, Ayappa and Murad133 This group reported a lower NaCl solubility in water confined within graphene nanopores. However, NaCl is a salt, and therefore it is likely that the mechanisms responsible for the reduced solubility of H2S and NaCl in confined water are due to different interfacial processes.
The interest in geologic CO2 sequestration resulted in numerous studies on the form and movement of CO2 through porous networks, chiefly focusing on montmorillonite. Bowers et al.Reference Bowers, Hoyt, Burton, Ferguson, Varga and Kirkpatrick134 studied the incorporation of supercritical CO2 in smectite by in situ 13C and 23Na magic angle spinning NMR. They observed line broadening in the 13CO2 resonance at 90°C and 50 bar CO2 pressure for Na-hectorite, consistent with CO2 pressure in the interlayers. Kirkpatrick et al.Reference Kirkpatrick, Kalinichev, Bowers, Yazaydin, Krishnan and Saharay135 reviewed efforts using NMR and molecular modeling to explore mineral surfaces and interlayer filling by H2O, cations, anions, CO2, and natural OM in swelling clays. In addition to entering the interlayer, there is evidence that CO2 dissolves in the confined water. Schaef et al.Reference Schaef, Loganathan, Bowers, Kirkpatrick, Yazaydin and Burton136 used NMR, x-ray diffraction and Monte Carlo simulation to explore the intercalation of dry supercritical CO2 into three swelling clays in which Na, NH4, or Cs occupied the interlayer. In the absence of water, CO2 did enter the NH4 and Cs clays, but was excluded from the Na clay. A weak intercalation of CH4 has been observed for smectites,Reference Bowers, Loring, Schaef, Walter, Burton and Hoyt137 but is more pronounced for 4‑nm weakly hydrated silica pores, as demonstrated by Ok et al.Reference Ok, Hoyt, Andersen, Sheets, Welch and Cole138
12.4.2 Aqueous Electrolytes in Confinement
The effect of nanoconfinement on the transport of aqueous electrolytes has been briefly summarized in Section 12.3.5. It is possible that, because confinement affects the structure and dynamics of confined water, it indirectly affects the solubility of electrolytes. For molecular simulations to reliably predict the properties of confined electrolytes, it is important that adequate force fields describe the interactions between water, electrolytes, and pore constituents, as well as all the cross-interactions between these components.Reference Moucka, Svoboda and Lisal139, Reference Svoboda and Lísal140 The reliability of the force fields used to describe the electrolytes depends on the model chosen to simulate water, and it is essential to tune the ion–ion interactions if one seeks to replicate the experimental salt solubility.Reference Nezbeda, Moucka and Smith141, Reference Smith, Nezbeda, Kolafa and Moucka142 Svoboda and LísalReference Svoboda and Lísal140 recently employed the grand canonical Monte Carlo algorithm to predict the solubility of NaCl in montmorillonite pores. The simulations were conducted at 365 K and 275 bar. At these conditions, the simulation models implemented (SPC/E model for water) predict a saturation NaCl concentration in water of 3.14 mol/kg,Reference Moucka, Svoboda and Lisal139 which underestimates the experimental value of 6.1 mol/kg.Reference Stephen and Stephen143 The pore widths considered ranged from 1.0 to 3.2 nm, and they were simulated in equilibrium with saturated bulk aqueous NaCl solutions. The results show that the concentrations of the adsorbed ions in the nanopores are lower than in the bulk aqueous system and decrease as the pore width narrows. Moucka et al.Reference Moucka, Svoboda and Lisal139 used simulations to compare the aqueous solubility of NaCl in Na-montmorillonite and pyrophyllite pores of the same width. They were able to distinguish the ionic solubility near the center of the pore, where the properties are similar to those found in bulk water, and those near the pore surfaces, where the properties are significantly different from those found in bulk water. As the pore width decreases, the contribution of the region near to the pore surface increases compared to that of the fluids near the pore center, and consequently the NaCl solubility strongly decreases compared to that observed in bulk water. In addition to structural effects, one could attempt to explain these observations based on the changes in the dielectric constant of water due to confinement, discussed below.
12.4.3 Dielectric Constant of Nanoconfined Water
The dielectric properties of water and electrolytes in nanopores are still poorly constrained for most substrates relevant to the subsurface. According to Renou et al.,Reference Renou, Szymczyk, Maurin, Malfreyt and Ghoufi144 the static dielectric constant (ε) characterizes the capacity of a material to transmit an electric field and controls the charge migration and dipole reorientation. Compared to other fluids types, bulk water has a high ε due to the strong bonds between hydrogen and oxygen as well as hydrogen bonding between water molecules. This large ε means that ionic substances tend to dissociate in water, yielding ionic solutions. Thus, the water ε is essential to understanding the solvation of ions and their transport. For example, Sverjensky et al.Reference Sverjensky, Harrison and Azzolini145 extracted from the research of Pan et al.Reference Pan, Spanu, Harrison, Sverjensky and Galli146 the theoretical estimates of the water dielectric constant at extreme pressures and temperatures to calculate the solubility of quartz and corundum to 600 MPa and 1200°C. This effort indicates that ε ranges from as low as ~2 at 1200°C and 100 PMa to ~80 for ambient conditions.
Of interest to this chapter is how much of an effect nanoconfinement might have on ε, and further, how this change might impact mineral solubility. In confinement or near interfaces, ε is no longer a simple scalar quantity, but it becomes tensorial. The radial component of water ε⊥ is fundamentally important to the solvation and transport of ions, in contrast to the axial component (εll), which is important for transport behavior along the pore wall. However, there are conflicting results with respect to the magnitude of the ε values. For example, a number of MD studies have demonstrated a local interfacial increase in the axial (tangential) component of the dielectric constant (εll) relative to the bulk water value and to values exhibited by the radial ε⊥.Reference Bonthuis, Gekle and Netz147–Reference Schaaf and Gekle149 An enhanced εll was also predicted in other studies that addressed the role of cylindrical silica and carbon nanopores.Reference Renou, Szymczyk, Maurin, Malfreyt and Ghoufi144, Reference Schaaf and Gekle149–Reference Zhu, Stebner and Brinson151 Conversely, values for the radial ε⊥ tend to be equal to or much less than the bulk ε. This anisotropy is most pronounced in hydrophobic pores.
Unlike the increase of the axial dielectric permittivity near the pore wall noted above, Renou et al.Reference Renou, Szymczyk, Maurin, Malfreyt and Ghoufi144 observed a significant decrease in εll relative to the ambient bulk water value with increasing surface charge density using MD. More recently, Fumagalli et al.Reference Fumagalli, Esfandiar, Fabregas, Hu, Ares and Janardanan152 observed anomalously low ε (approaching 1) of confined water that was two to three molecules thick in dielectric imaging experiments involving graphene and boron nitrite. Similarly, Zhu et al.Reference Zhu, Ghoufi, Szymczyk, Balannec and Morineau153 reported on the anomalous behavior of ε for aqueous solutions of NaCl of varying concentration (0–1.5 M) confined in a 2.4‑nm diameter cylindrical silica pore (Figure 12.9). They noted that the dielectric constant profile near the surface correlates with that of the water density. Using classical MD simulations, Zhu et al.Reference Zhu, Ghoufi, Szymczyk, Balannec and Morineau153 demonstrated: (1) a marked anisotropy between εll and ε⊥; (2) that the values for εll decrease relative to those of pure water, but show enhancement near the pore wall; and (3) that ε⊥ shows a nonlinear NaCl concentration dependency. Renou et al.Reference Renou, Ghoufi, Szymczyk, Zhu, Neyt and Malfreyt154 addressed the structural and dielectric behavior of confined NaCl, NaI, MgCl2, and Na2SO4 (1 M concentration) in nanoporous hydrophilic 1.2‑nm silica pores. They also reported a dielectric anisotropy of confined water and an unusual increase in the radial component of permittivity (ε⊥) of confined solutions.
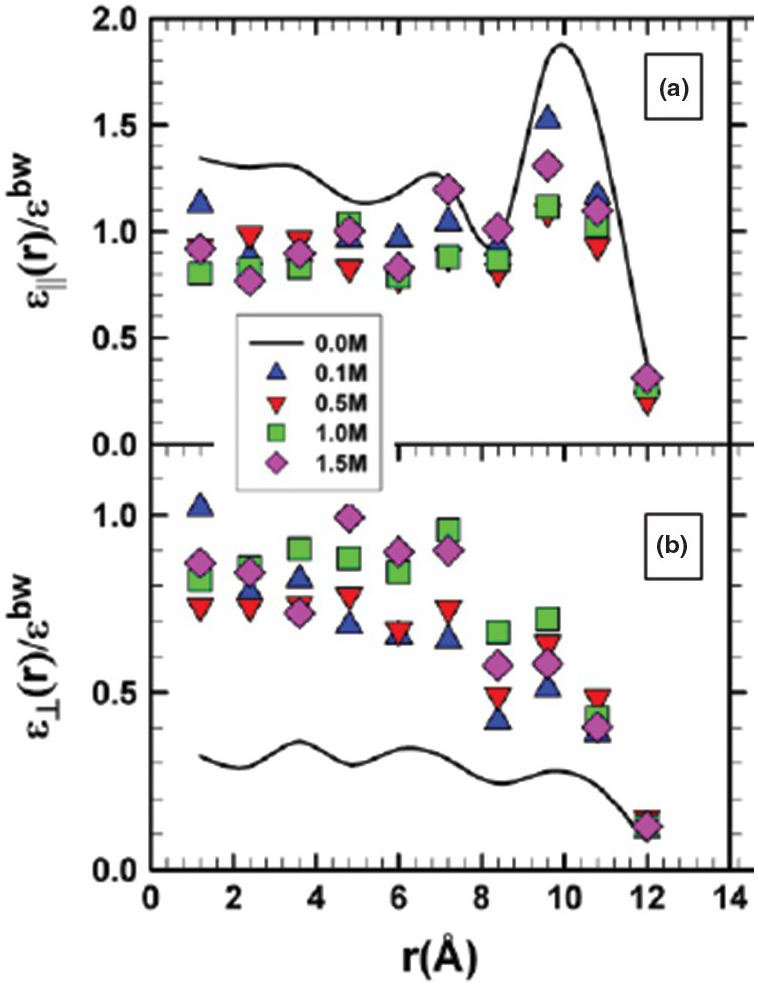
Figure 12.9 Profiles of the ratios of εll (a) and ε⊥ (b) for NaCl solutions of varying concentrations confined in 2.4‑nm diameter cylindrical SiO2 pores to the dielectric constant of bulk water (εbw).
It is notable that the range of dielectric constant values reported for water confined in nanopores encompasses the range of ε values estimated for bulk water from ambient to extreme conditions. This suggests the distinct possibility that the bulk values for ε currently used to estimate fluid properties in the subsurface might not be appropriate, especially for pores such as those illustrated in Figures 12.2 and 12.3. We lack a comprehensive assessment of ε for nanoconfined environments relevant to subsurface conditions (i.e. at elevated pressure and temperature with widely varying solution compositions) and a quantification of whether these “local” effects yield important consequences on, for example, salt solubility and other important observables.
12.5 Form and Origin: Confinement Effects on Reactivity
12.5.1 General Concept
In this section, we address the reactivity of carbon-bearing fluids and how confinement can affect their behavior. Based on thermodynamic arguments, ShockReference Shock155 predicted that, in the subsurface, the most common form of fluid carbon would be that of CO2, not CH4. This prediction was based on the analysis of the thermodynamic equilibrium of the reaction:
The equilibrium was assessed based on the expected pH as buffered by the rocks. However, nanoconfinement could potentially affect fluid reactivity via three main mechanisms: (1) the closeness of the rock surfaces provides catalytic sites that speed up some reaction pathways, thus affecting the kinetics of the reactions; (2) the confinement is so restrictive that some of the reactants or the products are either not able to react or are not allowed to escape from the porous matrix; and (3) the preferential adsorption of some of the fluid components onto the rock surface can affect the overall equilibrium composition via a molecular-level application of Le Chatelier’s principle. The first of these three scenarios concerns kinetic effects. We only note that some olivines contain Ni, Co, and/or Cr, which could act as catalysts to increase the rate of chemical reactions, including the oxidation of CH4 to CO2.Reference Foley, Prelevic, Rehfeldt and Jacob156
12.5.2 Methanation of Carbon Dioxide
Using reactive ensemble Monte Carlo simulation, Le et al.Reference Le, Striolo, Turner and Cole157 explored whether confinement could alter the bulk expectations regarding reaction (12.2). In particular, they tested whether the preferential adsorption of either CO2 or H2O on the pore surface could affect the equilibrium conversion of CO2 to CH4. The system simulated represented a nanoporous matrix in contact with a larger microfracture occupied by the bulk fluid. Water, hydrogen, carbon dioxide, and methane were free to exchange between the nanopores and the microfracture and to react within the various environments. The microfracture was large enough to provide a “bulk” system. The conceptual framework is summarized in Figure 12.10.
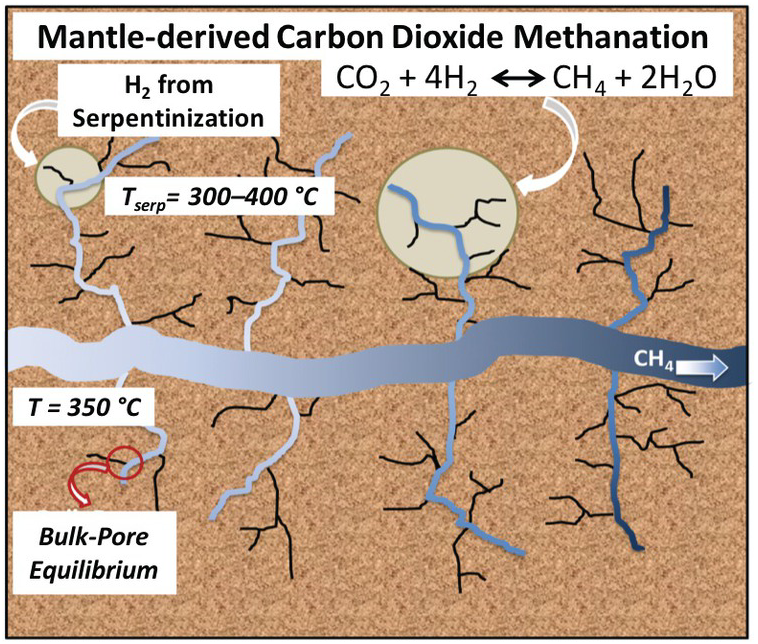
Figure 12.10 Schematic for a possible carbon dioxide methanation process. Within oceanic crust, mantle-derived melt is emplaced at shallow depths and heats the ultramafic ocean crust driving seawater circulation along natural fractures and microfractures where serpentinization reactions take place. The H2 produced could come into contact with carbon dioxide derived from the mantle.
Le et al.Reference Le, Striolo, Turner and Cole157 generated slit-shaped pores (1 and 2 nm) carved out of β-cristobalite silica. The results showed that the thermodynamic equilibrium composition shifted toward methane production, suggesting that thermal hydrocarbon synthesis near hydrothermal vents and deeper in the magma-hydrothermal system is possible. The results showed strong dependency of the reaction equilibrium conversions, XCO2, on nanopore size, nanopore chemistry, and nanopore morphology. All conditions that enhance water adsorption (i.e. increasing pore hydrophilicity or surface roughness) resulted in an enhancement of reaction yield. Representative results for 1‑nm pores are shown in Figure 12.11, where the composition in the bulk phase (left-hand panels) is compared to that within the pores (right-hand panels). In situations in which the pore space is dominant compared to the bulk space, it is conceivable that the overall system composition strongly deviates from bulk expectations.
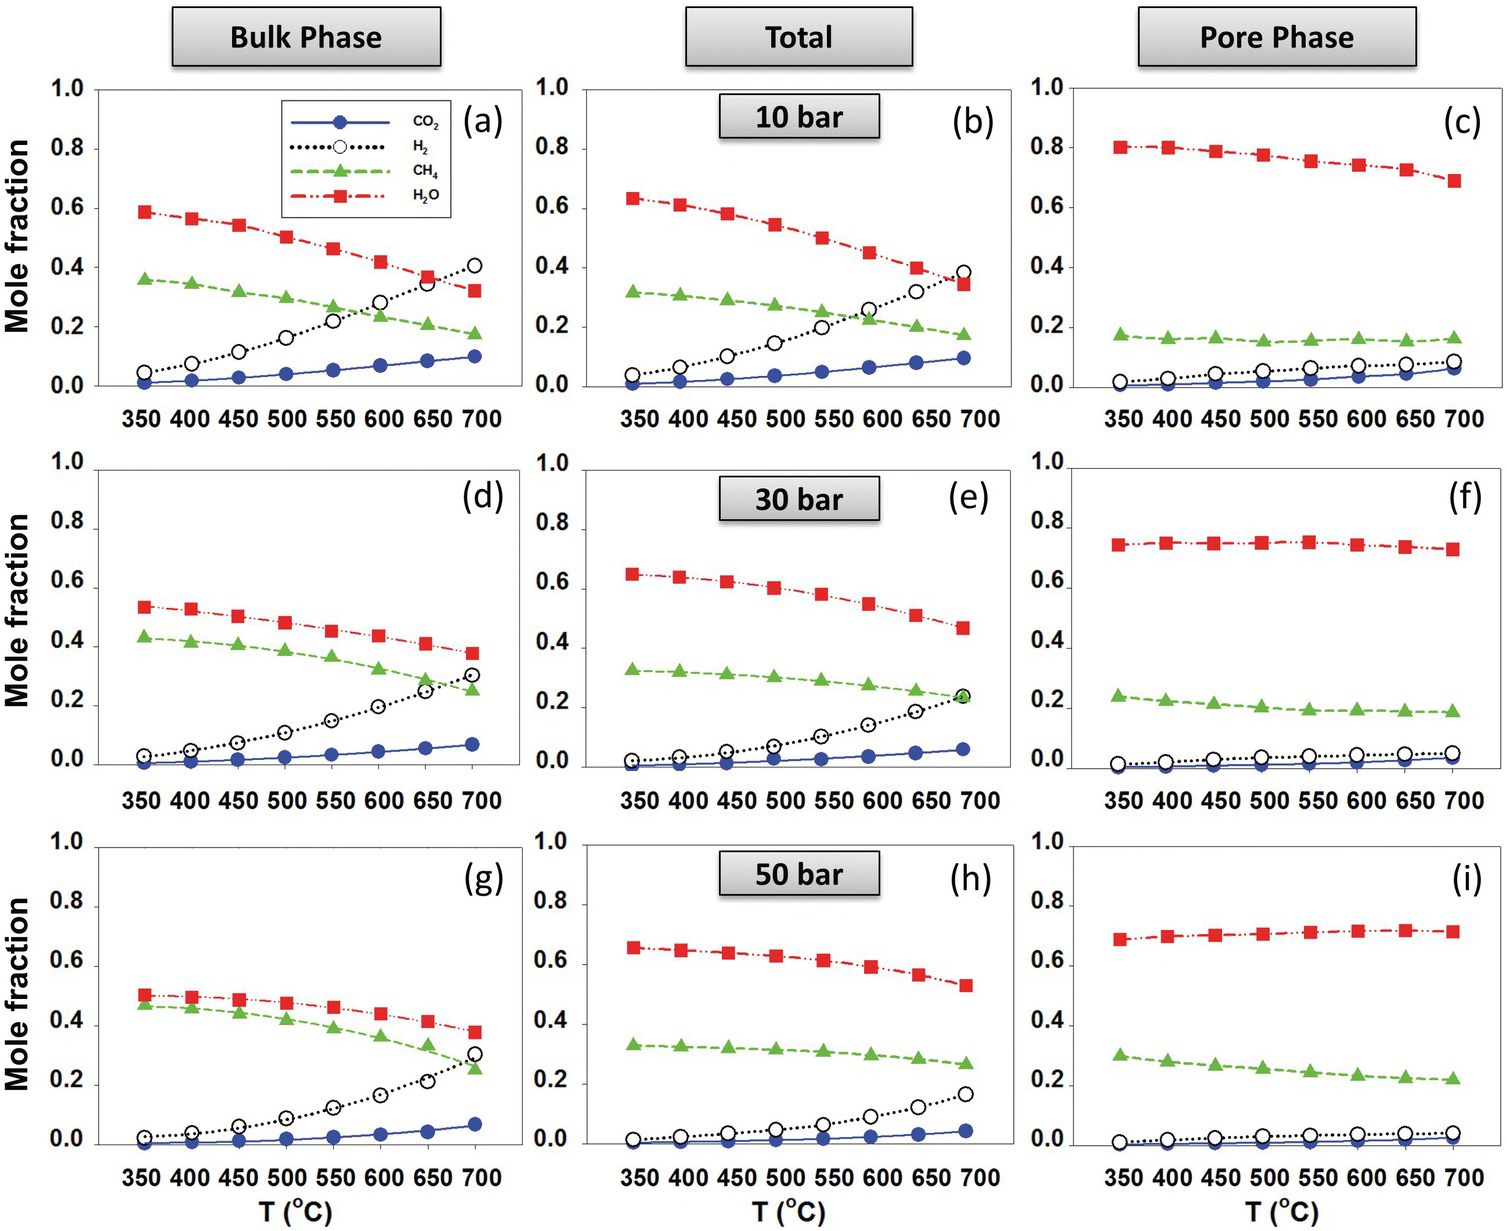
Figure 12.11 Product fraction of CO2 methanation (reaction (12.1)) for the (a, d, and g) bulk phase and (c, f, and i) pore phase in equilibrium with each other at different temperatures and pressures. (b), (e), and (h) show total molecular fractions.
These results could contribute to an important scientific debate focusing on the possibility of the abiotic synthesis of hydrocarbons during oceanic crust–seawater interactions, which could reshape the core hypotheses of the origin of life.Reference Holm158, Reference Brack159
12.6 Summary and Opportunities
Exploring the behavior of complex geofluids confined in micro- and meso-porous networks provides the foundation for quantifying geologically relevant systems where mass and energy exchange occur. Nanoconfinement in porous systems gives rise to rich behavior that results from the interplay of geometrical restriction imposed by different pore features (size, geometry, chemical composition, etc.), the interaction between the porous material and the fluid, and the nature of the confined fluid itself. Fluid structure (or “form”) affects most if not all fundamental properties of interest. Since nanopores affect structure, they impact movement, reactivity (“origin”), and quantity. While in relatively large mesopores fluid “movement” might occur at different timescales as a function of location in the pore, greater geometric confinement can lead to severely constrained motion, such as the molecular diffusion mechanisms discussed in Section 12.3. Within a given porous matrix, timescales of motion of confined fluids can exhibit interesting dependencies on the molecular size and concentration of the confining fluid, such as the levitation effect of confined hydrocarbons or anomalous pressure dependence on gas dynamics in mesoporous media.
Water and associated dissolved constituents, as a confined fluid, exhibit very rich structural and dynamical behavior due to the effects of hydrogen bonding, compounded by the other effects identified above. All of these effects lead to a wide variety of length and time scales relevant to the study of confined fluids and as such require a variety of experimental and computational tools for a thorough study of the behavior of geologically relevant confined fluids. The techniques that probe the behavior of confined fluids at the molecular level depend heavily on the interpretation of the measured data and as such can be prone to subjective bias. Therefore, if possible, it is advantageous to look at each solid–fluid system from different perspectives, both experimental and computational. Much progress is expected when synergistic approaches are implemented. For example, one obvious next step would be the detailed experimental and computational investigation of the structural properties of fluid mixtures in increasingly realistic systems. This includes complex fluid mixtures, as well as porous materials that are heterogeneous and better representative of the subsurface. Once these analyses are obtained, one should challenge the mechanisms discussed in Sections 12.3 and 12.4. A second target of opportunity pertains to whether the presence of ions and associated hydration affect the transport and accumulation of hydrocarbons in nanoporous matrices. The presence of concentrated salts disrupts water structure, slows down its dynamics, and alters the water free energy landscape, which impacts transport of guest molecules.Reference Phan, Cole, Weiss, Dzubiella and Striolo106, Reference Phan, Cole and Striolo130 Clearly, how one fluid component invades and displaces and/or competes with another for surface sites will have a profound effect on these types of transport mechanisms. The dielectric properties of water and aqueous systems under nanoconfinement are poorly constrained for Earth-relevant systems. Recent studies have exhibited a wide range of values that are not always in agreement.
Finally, we point to the effects of confinement on the equilibrium composition of reactive systems. The results summarized in Section 12.5 suggest that thermogenic methane production could be enhanced by nanoconfinement, albeit within a specific window of pressure–temperature–composition conditions. To quantify whether those simulation results are relevant across a broader temperature and pressure landscape, a few research questions remain to be addressed, in particular:
1. Will the CO2 methanation reaction encounter kinetic barriers within the pores or will the pore surfaces provide active sites for catalyzing the reaction?
2. How much nanopore volume in the subsurface is needed for achieving levels of methane production that are relevant for hydrocarbons synthesis?
3. Can these insights be reproduced by experiments?
Future studies could be implemented to address these and related questions and to quantify how these phenomena affect the carbon cycle.
Acknowledgments
AS acknowledges financial support from the European Union via the Marie Curie Career Integration Grant No. 2013-CIG-631435, as well as from the European Union’s Horizon 2020 research and innovation program under Grant No. 640979 and Grant No. 764810. DC was supported by the US Department of Energy, Office of Basic Energy Sciences, Division of Chemical Sciences, Geosciences and Biosciences under grant DE-SC0006878. DC and AS both receive partial funding from the Sloan Foundation-funded Deep Carbon Observatory. Special thanks to Ms. Tran Le for her help in assembling the reference list.
Questions for the Classroom
1. Are nanopores observed in all Earth materials? How are these observed? What are their shapes, sizes, and distributions? Is there a correlation between these properties and depth?
2. Discuss quantitatively how confinement affects the thermophysical properties of a fluid, whether pure or a mixture. Discuss the effects due to strong pore–fluid interactions and how changing the pore width affects these outcomes. Discuss in particular such effects with respect to solubility, reactivity, phase equilibria, and melting.
3. Discuss the differences between surface and pore diffusion. What are the mechanisms responsible for each and when is surface diffusion expected to dominate over pore diffusion in determining the overall fluid transport across a porous material? What mechanisms become dominant as the pore size becomes comparable to the size of a fluid molecule?
4. How does the presence of a pore affect the reactivity of a fluid? Distinguish between kinetic and thermodynamic effects.


 Open access