


Introduction
The application of remote sensing has become important in many aspects of glaciology. While there are several geophysical techniques for measuring ice depths, only the pulsed radar method is adaptable to non-contact measurements. Since the early work of Reference Waite and SchmidtWaite and Schmidt (1962), and Reference EvansEvans (1963), depth measurements in cold polar ice using radar have been reported by many workers; the proceedings of the Copenhagen conference (Reference Gudmandsen and GudmandsenGudmandsen, 1970) are an excellent overview of the field. The technique has a variety of names: radio echo sounding, radioglaciology, radiointroscopy and time-domain radar, but the principle is the same. Interferometry (Hermanee, 1970; personal communication from J. R. Rossiter and others, 1971) and EM radar (Reference Christofferson and GudmandsenChristofferson, 1970) also have been used for ice-thickness measurements. An excellent review by Reference Robin.de, Robin de, Evans and BaileyRobin and others (1969), of the Scott Polar Research Institute, summarizes their work in Greenland and the Antarctic. The characteristics of some contemporary time-domain radars are summarized in Table I.
Table I. Characteristics of the various time-domain radar sets

Frequency (F)—(centre frequency). The choice affects ice losses as shown in Figure 2.
Power (P)—(pulse power). This is a contribution to system capability S.
Band width—This contributes to the resolution.
Pulse width—This contributes to the sampled volume.
Range accuracy—This is the intrinsic resolution of the electronics if no scattering or beam divergence were present. A low number is desirable.
System performance—The total difference between transmitted power and receiver sensitivity to a unity signal to noise ratio. This is the RF part only and excludes antenna.
Antenna performance gain—This is to be added to system performance in comparing sounding capabilities.
Antenna beam width—The parameter determines the spatial resolution and linear resolving power of the system.
Dynamic range—The total signal range the receiver is capable of accepting. A high number is desirable.
All the above parameters have been taken from Reference Evans and GudmandsenEvans (1970)
A radar system for successful ice-depth measurements must be able to receive a detectable echo, to eliminate extraneous reflections or ghosts and to resolve the structural characteristics of the ice. The receipt of a detectable echo is limited by the radar performance characteristics and the attenuation of the signal by the ice.
Figure 1 shows the signal attenuation in ice as a function of frequency for two temperatures. The lower frequencies have reduced ice attenuation but lack spatial resolution. The radar system capability is characterized by its performance parameter S, which is defined as the ratio of the transmitter peak power to the minimum detectable signal in the receiver or recorder (Reference Evans and GudmandsenEvans, 1970). The elimination or reduction of unwanted reflections is determined by the antenna beam width and the pulse length. The product of these parameters is proportional to the sampled volume of the glacier. A large volume increases the number of reflectors illuminated and hence complicates the analysis of echoes. The minimum detectable spacing between structural elements is represented by the range resolution. The range resolution is related to the pulse length. Resolution and sampled volume are not independent parameters. For temperate glaciers, most of which are situated in narrow valleys, a high degree of signal attenuation in a normal direction to the main beam is required.

Fig. 1. Ice absorption in db/100 m as a function of freauency at two temperatures (–1° and –°C) (a synthesis from Reference EvansEvans (1965) and Reference Bogorodskiy and TrepovBogorodskiy and Trepov (1968))
Recent work by Reference DavisDavis (unpublished) has shown that high-frequency systems with short pulse length are more suitable for temperate glaciers. The ability to achieve improved spatial resolution and lower sample volume at high frequencies compensates for slightly increased signal losses.
High-resolution radio echo-sounding system
The use of radio echo sounding in the polar regions prompted the development of equipment for use on temperate glaciers, where the ice is near 0°C and a large number of discontinuities such as crevasses and moulins exists. During the summer, melt water percolates through the ice, resulting in extensive and complex structures within the glacier. Knowledge of the features of this intrastructure will increase an understanding of intraglacial hydrology, and water storage on glaciers.
Attenuation of the radar pulse by the ice at 0°C is tolerable below 1 GHz (Fig. 1), but a recent calculation (Reference Smith and EvansSmith and Evans, 1972) predicts large scattering losses above 500 MHz due to glacial inhomogeneities, such as bubbly ice layers and water-filled cavities. With the present system, the scattering at high frequencies is not a hindrance, but rather yields additional data concerning glacial structure. For the high-resolution system, a frequency of 620 MHz (UHF TV band) was chosen since components and engineering data are readily available. The main design objectives were a short pulse length, high peak pulse power and a capability of handling a large dynamic range of reflected signals. The radar was to be of solid state construction to reduce power and weight and to increase reliability.
The total sounding system can be considered as three units: the radar set, the data-handling system and the positioning system.
Radar set
The radar set is a conventional design consisting of three components: the transmitter, the receiver and the antenna which includes a send–receive switch.
The transmitter (Fig. 2) is a grid-modulated cavity oscillator using a“light-house”output stage and a low-Q. tank circuit to give a peak pulse power of 3 kW. An isolator prevents transmitter self-destruction in the event of loss of load. The pulse modulator has a variable pulse rate (1 pulse/s to 20 000 pulses/s) and three possible widths (70, 250 and 500 ns).

Fig. 2. Block diagram of 620 MHZ. radar transmitter
The receiver (Fig. 3) is a superheterodyne type with an input pre-amplifier that has a noise level of 3 db above thermal, a dynamic range of 90 db and a gain of 10 db. A 100 MHz logarithmic IF amplifier with 30 MHz band width and 90 db dynamic range provide most of the receiver gain (80 db). A conventional video detector and amplifier complete the receiver.

Fig. 3. Block diagram of radar receiver
The antenna is a corner reflector which was chosen in order to achieve good spatial resolution and small side lobes (Reference Harris and JasikHarris, 1961). The beam width is 5.2° and the gain is 15 db. These excellent characteristics required a rather bulky antenna, consisting of a triangle 2 m on the base and 2 m high (Fig. 4). A transmit–receive switch (Fig. 5) is preferable to the alternative of two antennae. The receiver is protected by a set of fast-recovery diodes and the main isolation is a ferrite circulator. Recovery times in the order of 100 ns are achieved, with 60 db isolation between transmitter and receiver.

Fig. 4. Photograph of corner-reflecting antenna mounted on an FN60 tracked vehicle

Fig. 5. Block diagram of transmit-receive switch
A precision calibration circuit which generates two contiguous transmit pulses with 1 μs spacing is an integral part of the radar system. Since both pulses use the same electronics, all delays are compensated and the calibration is independent of transmitter and receiver characteristics.
Typical video returns are shown in Figures 6 and 7. The intrastructure as shown in Figure 6 is characteristic of a temperate glacier and Figure 7 shows a return obtained from cold glacier.

Fig. 6. Time-amplitude spectrum from Athabasca Glacier. The complex glacier intrastructure is readily apparent

Fig. 7. Time-amplitude spectrum from Trapridge Glacier, Yukon Territory, showing a simple single retun from the bottom. Time pulses P1 P2, and P3 are easily identified peaks
The radar set can be operated as a stand-alone unit (Reference GoodmanGoodman and others, 1975) in situations where simple echoes are obtained or in conjunction with a computer data-handling system where better control and analysis are required. The latter situation occurs, for example, when accurate measurements are required or when the intrastructure of temperate glaciers is to be investigated.
Data-handling system
The more intricate problem of studying glacial intrastructure requires a complex yet flexible data-handling system. Since a large amount of data is to be collected, the output should be in a form readily adaptable to computer processing. Most other workers record their data on photographic film. Initial interpretation is achieved by a visual scan of the data but subsequent statistical analysis and calculations require accurate digitizing of the photographic record. The limited dynamic range of the film restricts the allowable amplitude excursions. Using digital recording techniques, a greatly increased recording resolution is possible and the results are directly computer compatible. The photographic recording technique implicitly averages the data; however, either single or averaged records may be obtained with digital techniques. Using the conventional z-axis modulation photographic system, it is not possible to do accurate pulse-shape determination which adds information on the nature of the reflecting horizons.
The digital recording system used for high-resolution studies is schematically illustrated in Figure 8. The radar echo is digitized using a sampling technique and the resulting histogram is stored in the computer. The computer controls the time delay between the transmit pulse and the sampling of the data. The total time delay to be recorded is thus divided into 1024 time channels, only one of which is sampled per radar return. After 1 024 returns, the total histogram has been constructed. This process takes about 20 ms and the time required to write on magnetic tape is about 1 s. From time considerations, up to 50 events could be averaged, but the computer work length limits averaging to 16 events per record. The difference in the statistical error between an average of 50 events and 16 events is less than a factor of two. A display reconstructed from the histogram allows the operator to monitor the quality of the data. A typical example is shown in Figure 9. The data-handling system records several other parameters including temperature, altitude, and transmitter power.

Fig. 8. Data-handling J..l’stem

Fig. 9. Digitized video return. This is the same echo as in Figure 6
Positioning system
The accurate measurement of glacial depth and infrastructure is of little value if the location for the measurement is unknown. Since the high-resolution system was to be used in either a land-based or airborne operation, a non-contacting method of positioning was required. A positioning accuracy of ± 10 m is consistent with beam-width and depth-measurement tolerances. Such positioning measurements require line-of-sight microwave systems since the VLF and HF systems are terrain dependent. The positioning system operates in the X-band (9.4 GHz) using a range–range mode (Fig. 10) with two active beacons (transponders) located at known geographic points. The digitized range data and altitude information are interfaced with the computer and recorded on the magnetic tape along with the radar-reflection histograms.

Fig. 10. Positioning system. The ranges from the two transponders are measured electronicall),. These measurements combilled with the tracked-vehicle altimeter readillg allow a calculation of positioll to all accurary of ± 10 m
Field trials
Preliminary tests on the system have been conducted on both Athabasca Glacier and Wapta Icefield in the Canadian Rockies. The contour map of part of Wapta Icefield (Fig. 11) was obtained from about 400 data points. The rectilinear features on the map are artifacts introduced by the contour gridding techniques in regions of low data density. The four marked points represent the location of bore holes, which were used to check the radio echo soundings. Using the velocity of electro-magnetic waves in ice at 167 m/μs, the radar data and bore-hole measurements agree within ± 10 m except for bore hole 3 where a solid object was encountered during the drilling (Table II).

Fig. 11. Contour map of part of Wapta Icefield. The locations A through D are the calibration bore holes
Table. II. Ice-depth measurements—hot-point bore-holes method vs radio echo-sounding method

The stability and reproducibility of the system was checked on Athabasca Glacier by taking three sets of data over the same course. The first pair, Figures 12 and 13, were taken 2 d apart to check short-term stability and the third (Fig. 14) was taken a month later as a check of long-term reproducibility. The changes in the glacial intrastructure are evident by comparing Figures 12 and 14. These changes in the intrastructure have been discussed in a separate paper (Reference GoodmanGoodman, 1973). The depth measurements obtained by radio echo soundings agree with the seismic and bore-hole measurements of Reference Savage and PatersonSavage and Paterson (1963) on Athabasca Glacier to within 14 m.

Fig. 12. Profile of a section of Athabasca Glacier
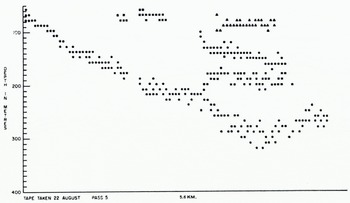
Fig. 13. Same profile as Figure 12 taken 2 d later.

Fig. 14. Same profile as Figure 12 taken I month later. While the bottom measurements are consistent, there have been dramatic changes in the glacier intrastTucture to the right of the diagram
Future work
The infrastructure on temperate glaciers indicates the complexity of processes occurring in these ice masses. Using bore-hole and core data in conjunction with radio echo sounding, it is hoped to elucidate the cause and character of these structures. These structures are probably related to water storage in glaciers, and the water motion through the ice. Radio echo-sounding studies of semi-polar surging glaciers are also in progress.
Applications
Progress towards the understanding of such phenomena as surging glaciers and jökulhlaups may be assisted using contour maps of bedrock topography and accurate data on glacier intrastructure. Such data will enable a study of water flow within a glacier, and the bedrock-topography studies will be useful in the application of basal-sliding theories to particular glaciers.
Remote sensing of ice depths has applications to the analysis of gravity surveys in glaciated areas, to iceberg-scouring studies and potentially to permafrost investigations.
Acknowledgements
Many people have been involved in the design and building of this equipment. I should like to thank particularly Drs S. Evans and G. de Q. Robin, of the Scott Polar Research Institute, for introducing the author to these techniques. Dr A. T. Prince, Director-General of the Inland Waters Directorate, Drs J. D. Keys, M. C. B. Hotz and J. D. Kingham, of the Inland Waters Directorate, have been instrumental in providing support and assistance of management and financing of this project. The field assistance of Dr A. D. Stanley, Mr A. C. D. Terroux, Mr T. M. H. Beck and Mr T. Bellaar-Spruyt, of the Glaciology Division, was most valuable. All the computer programming for the on-line computer has been performed by Mr D. Alexander, without whom little progress would have been made. The electronics for the present system has been constructed by Mr M. Bolting and his assistance is greatly appreciated. The assistance and support from members of both Banff and Jasper National Parks is gratefully acknowledged.


