Introduction
The historic Waterberg platinum deposit – not related to the current ‘Waterberg Project’ exploration being carried out by Platinum Group Metals Ltd. in the far north of the northern limb of the Bushveld Complex – is located some 15 km WNW of Mookgophong (formerly Naboomspruit) in the Waterberg District, Limpopo Province, South Africa (Fig. 1). The deposit was discovered in 1923 and marks the first find of ‘platinum’ in economically feasible quantities in South Africa (Wagner and Trevor, Reference Wagner and Trevor1923; Wagner, Reference Wagner1929a,Reference Wagner, Steinmann and Wilckensb). However, the project failed for various reasons (McDonald and Tredoux, Reference McDonald and Tredoux2005) after a few months of production only, and the mine was closed in 1926. McDonald and Tredoux (Reference McDonald and Tredoux2005) recalculated equivalent platinum-group element (PGE) grades of 2.98 g/t based on 386 troy ounces of platinum recovered from 3956 tonnes of rock processed by the operation.
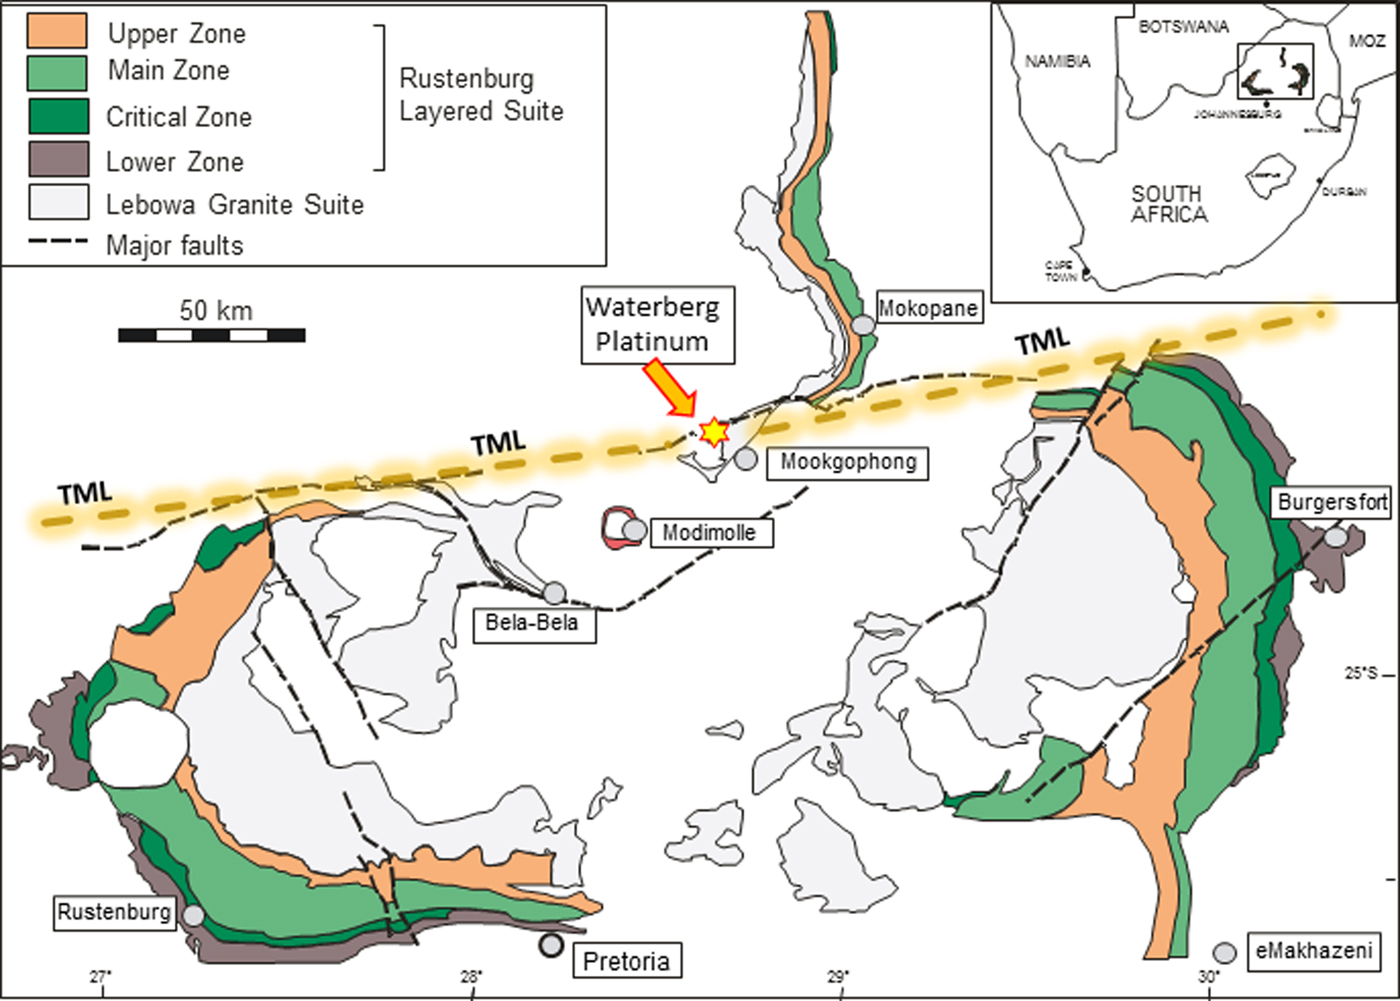
Fig. 1. Generalized map of the Bushveld Complex and peripheral location of the Waterberg platinum deposit. Major faults and the approximate course of the Thabazimbi-Murchison-Lineament (TML) is also shown.
The Waterberg platinum deposit represents a rare example of a hydrothermal vein-type platinum mineralization. The lodes were traced for more than 4 km in a NE–SW direction, however, workable bodies of ore were only opened on the farms ‘Welgevonden 343KR’ and ‘Rietfontein 513KR’ (Wagner and Trevor, Reference Wagner and Trevor1923; Wagner, Reference Wagner1929a; Armitage et al., Reference Armitage, McDonald and Tredoux2007). Mining followed a principal vein (the ‘Main Lode’), ranging in thickness from 1.8 to 18 m and dipping 60–75° SE, as well as a high-grade section in a second vein (the ‘Branch Lode’), from 1.2 to 9 m thick, splitting off the Main Lode into the hanging wall (Wagner and Trevor Reference Wagner and Trevor1923; Wagner Reference Wagner1929a). The ores of the Main Lode were rich in Pt, with only 8% of Pd, whereas the Branch Lode ores yielded up to 40% of Pd (McDonald and Tredoux, Reference McDonald and Tredoux2005).
In the course of ongoing studies on platinum ores of southern Africa, a set of samples was collected on site and further ore specimens were obtained from a number of university and museum collections. The aim of the present study is: (1) to complement and extend our recent work on the various PGE-deposits of the Bushveld; and (2) to investigate the geochemistry and mineralogy of this strange deposit using up-to-date analytical methods to achieve insight into the general characteristics of the hydrothermal PGE mineralization.
Geology of the Waterberg platinum deposit
The Waterberg platinum deposit is located near the junction between the northern margin of the Eastern limb and the southern margin of the Northern limb of the Bushveld Complex, ~15 km WNW of Mookgophong (Fig. 1). The elevated mountainous area north of the Bushveld Complex is called the Waterberg plateau, and the sedimentary series covering this region belongs to the mid-Proterozoic Waterberg Group (Ericsson et al., Reference Ericsson, Reczko and Callaghan1997) whose lower part was deposited immediately after the intrusion of the Bushveld Complex and may be tectonically related to the complex (Dorland et al., Reference Dorland, Beukes, Gutzmer, Evans and Armstrong2006). The term ‘Waterberg platinum deposit’, therefore, primarily is related to the geographical location of the deposit in the elevated area of the Waterberg plateau.
Armitage et al. (Reference Armitage, McDonald and Tredoux2007) performed detailed geological mapping of the Waterberg platinum deposit and its surroundings, and their descriptions are given here in brief. These authors state that the deposit consists of two quartz veins occupying faults mainly in folded Rooiberg Group felsites of the Bushveld Sequence and locally between these felsites and horizontally bedded sandstones of the Karoo Group. The faults are parallel to the larger Welgevonden fault, which, together with the Zebediela and the Ysterberg-Planknek faults, forms the southern margin of the northern limb of the Bushveld complex. The Welgevonden fault itself is related to the Thabazimbi-Murchison-Lineament (TML; Fig. 1), a major crustal suture zone within the Kaapvaal Craton, and a long-living fault system developed as a relay structure with a history reaching back to the mid-Archean that has been periodically reactivated (Good and De Wit, Reference Good and De Wit1997, McDonald and Tredoux, Reference McDonald and Tredoux2005). The TML has also been implicated as a major feeder of the Bushveld magma (Eales et al., Reference Eales, Field, De Klerk and Scoon1988; Maier and Eales, Reference Maier and Eales1994; Kruger, Reference Kruger2005).
Regarding the Waterberg deposit, Armitage et al. (Reference Armitage, McDonald and Tredoux2007) delineate that the main fault hosts the Main Lode mineralization which can be traced along its SW–NE trending strike for ~3 km. A subsidiary fault that hosts the Branch Lode is interpreted to be a splay fault striking SSW–NNE. It joins the Main Lode in the middle of the mineralized zone. A grade is present both NE and SW of where the Branch Lode joins the Main Lode. The platinum mineralization of the Main Lode can be traced laterally for ~500 m, thus only a small section of the fault is mineralized.
Locally, the faults juxtapose Karoo sandstones against Rooiberg volcanics of the Bushveld Complex. Therefore, faulting in the area must be post-Karoo (Wagner and Trevor Reference Wagner and Trevor1923, Wagner Reference Wagner1929a, Armitage et al., Reference Armitage, McDonald and Tredoux2007). However, so far neither faulting nor the mineralization have been dated and therefore, the exact age of faulting and/or mineralization is unknown. According to McDonald and Tredoux (Reference McDonald and Tredoux2005), the present mineralization can most likely be attributed to episodes of fault reactivation in geologically (sub-) recent times.
Previous work
Wagner and Trevor (Reference Wagner and Trevor1923) and Wagner (Reference Wagner1929a,Reference Wagner, Steinmann and Wilckensb) described the irregular appearance of ‘platinum’ in the lodes and provided analytical data on the composition of the platinum bullion which contained in the order of 20–40% Pd. The authors noted the association of the platinum with banded quartz and hematite and suggest near-surface high-temperature deposition of the ores from hydrothermal fluids. Wagner (Reference Wagner1929a) proposed that the platinum was transported in a colloidal form and was deposited as a gel. Ramdohr (description of polished section Hd_5034; “probably Elephant Winze, Branch Lode”; files accompanying the Ramdohr collection of Heidelberg University) corroborated this suggestion by the ore microscopic work and states that the platinum mineralization “surely” possesses “a gel nature”. Ramdohr further identified stibiopalladinite and another two, undetermined PGM in the sample.
McDonald et al. (Reference McDonald, Tredoux and Vaughan1995) provided PGE whole-rock analyses and mineralogical data including microprobe analyses of the PGM. The authors remarked on the extreme relative enrichment of Pt versus the other PGE in the ores and stated that the PGE mineralogy is dominated by native platinum and Pt–Pd alloys, which often contain variable amounts of gold, and rare stibiopalladinite. The authors further suggested that oxidized fluids were the transporting medium for the PGE and Au. Further work of McDonald et al. (Reference McDonald, Ohnenstetter, Rowe, Tredoux, Pattrick and Vaughan1999a) led to the detection of Pt-oxide/hydroxide species (approximating PtO and PtO2 in composition) and the observation of common intergrowths of native Pt with monazite, which the authors regarded as primary. McDonald et al. (Reference McDonald, Ohnenstetter, Rowe, Tredoux, Pattrick and Vaughan1999a) argued that the strong enrichment of Pt over Pd and Au was a consequence of the low salinity, high ![]() $f_{{\rm O}_{\rm 2}} $ fluid allowing Pt to remain in solution longer and to a more neutral pH than Pd and Au precipitating deeper in the structure. This process offered an explanation for the unusual metal budget of the veins.
$f_{{\rm O}_{\rm 2}} $ fluid allowing Pt to remain in solution longer and to a more neutral pH than Pd and Au precipitating deeper in the structure. This process offered an explanation for the unusual metal budget of the veins.
Distler et al. (Reference Distler, Yudovskaya, Prokof'ev, Sluzhenikin, Mokhov and Mun2000) and Prokof'yef et al. (Reference Prokof'yev, Distler and Yudovskaya2001) identified gold-bearing native platinum and Pt–Pd alloys, “minerals of the Pt-Cu-(Au) system” (i.e. Pt–Cu–Au alloys), and variably As-bearing “platinum stibiopalladinite”. Fluid inclusion studies led the authors to propose the deposition of quartz and ore minerals took place in a wide temperature interval between 370 down to 50°C. McDonald and Tredoux (Reference McDonald and Tredoux2005) mainly report on the history of the mine and reflect on reasons for its failure.
Armitage et al. (Reference Armitage, McDonald, Edwards and Tredoux2001; Reference Armitage, McDonald and Tredoux2007) conducted a detailed geological mapping of the Waterberg platinum deposit and performed further mineralogical and fluid-inclusion studies. According to these authors, the geometry and trapping temperatures of quartz associated with the Pt mineralization suggest an introduction of the platinum via a fluid phase that homogenized at ~200°C and that itself was part of a complex succession of hydrothermal events, ranging from high-temperature fluids with homogenization temperatures of up to 400°C, over to 200°C hot ore-bearing solutions to low-temperature fluids that crosscut the existing mineralization and in part also remobilized earlier PGE. Armitage et al. (Reference Armitage, McDonald and Tredoux2007) further assumed that the PGE must have come from a source not cropping out in the immediate vicinity of the deposit. It was concluded, however, that the close proximity of the deposit to the Welgevonden fault system might be most significant in explaining the source of the PGE, as the fault crosscuts the PGE-rich Rustenburg Layered Suite rocks only a few kilometres east of the deposit. Consequently, Armitage et al. (Reference Armitage, McDonald and Tredoux2007) assume that slivers of these rocks were tectonically displaced as isolated tectonic lenses along the Welgevonden fault and may thus represent a PGE-enriched source rock beneath the deposit where hydrothermal fluids could dissolve PGE.
Van den Kerkhof and Sosa (Reference van den Kerkhof and Sosa2009) and van den Kerkhof et al. (Reference van den Kerkhof, Sosa, Oberthür, Graupner and Fußwinkel2009) identified four generations of quartz, whereby the crystallization of the earliest, radial-fibrous vein quartz is connected to the precipitation of hematite and the PGM. Fluids involved in the deposition of this quartz have low salinities (~6 wt.% NaCl eq.), and gaseous components like CO2 or CH4 are absent. Depositional temperatures range from 400°C down to ~280°C, indicating continuous successive pulses of hot fluid infiltration followed by cooling.
Samples and methods
As the mine closed in 1926, accessibility to pristine ore material is limited. Thanks to Prof. Marian Tredoux, Department of Geology, University of the Free State, Bloemfontein, South Africa, who guided us in the field in 2009, ~40 samples were obtained on surface and from old dumps at the mining site (Fig. 2), and another successful visit was conducted in 2014. Additional samples were obtained from museum collections, including the donation of E. Reuning (samples taken in 1925; WtA to WtF), Museum für Naturkunde in Berlin and P. Ramdohr at the University of Heidelberg (polished blocks Hd_4086, 4086a; 5034 and 5034a from sample WtC). Further samples were made available from the collections of the Council for Geoscience in Pretoria and the University of Cape Town, South Africa, and one sample (BM 1985, MI15578) was on loan from the Natural History Museum in London.
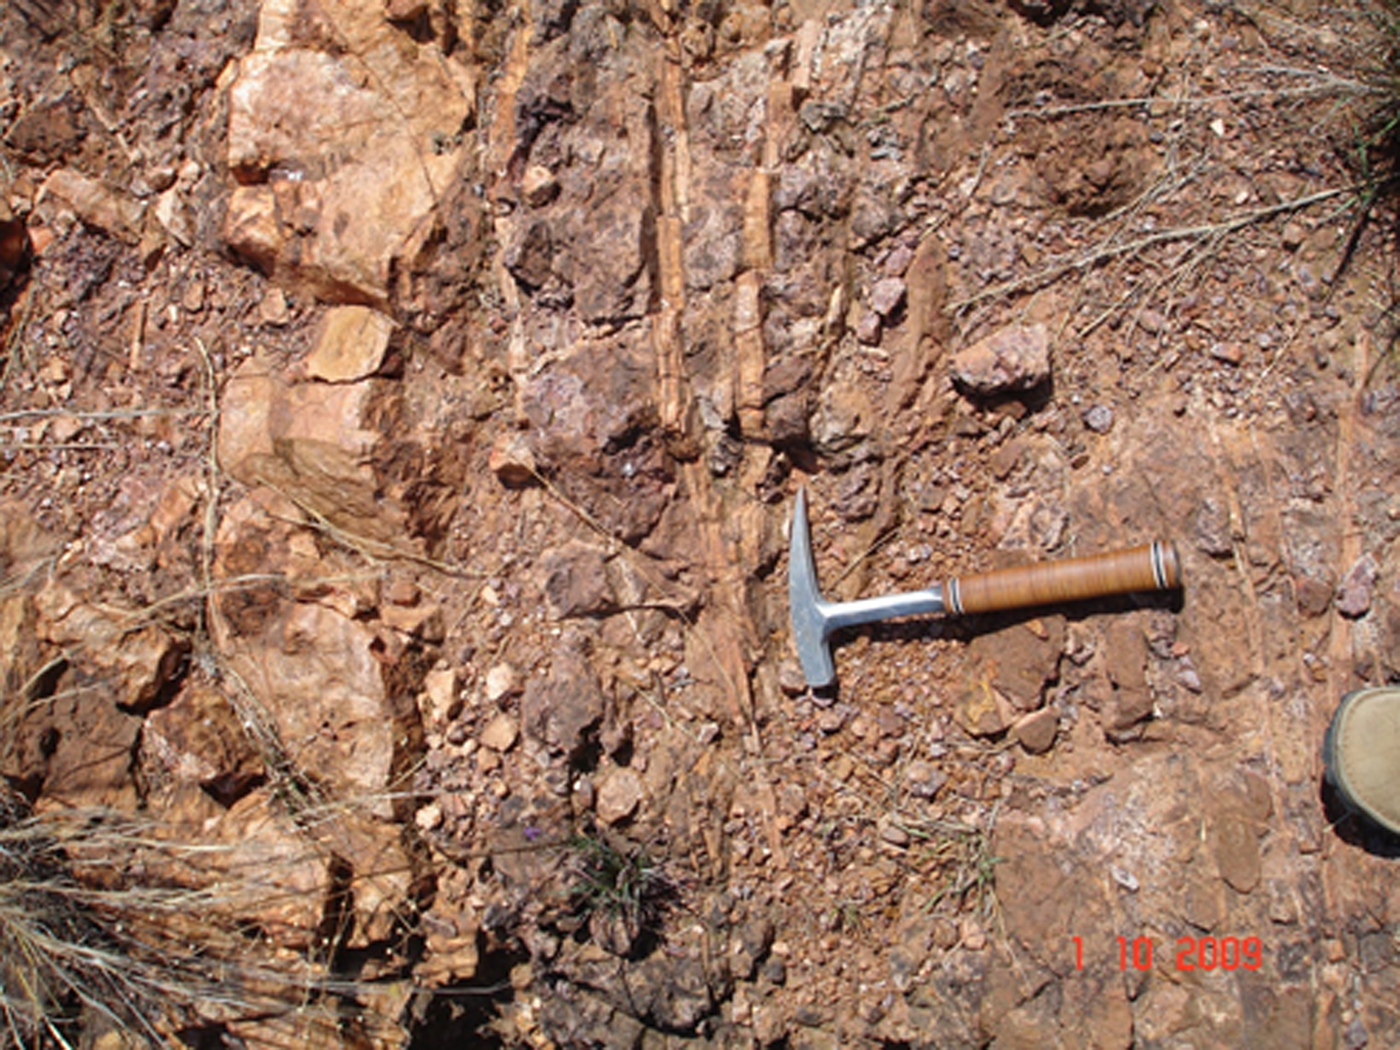
Fig. 2. Outcrop of the quartz vein remnant of the Main Lode along trench close to the main shaft of the former Waterberg platinum mine.
Bulk PGE analyses of ore samples were conducted by ACTLABS, Canada, using nickel-sulfide fire assay followed by Instrumental Neutron Activation Analysis (INAA). Work in the BGR laboratories comprised the preparation of close to 100 polished sections from ~35 ore samples. The sections were investigated by reflected light microscopy first, and the PGM grains detected were further studied using a field emission environmental scanning electron microscope (FEI Quanta 600) with an attached energy-dispersive X-ray system. Grains of interest were analysed by electron-probe microanalysis (EPMA) using a CAMECA SX100 electron-probe at the BGR. Analytical conditions were: accelerating voltage 20 kV, specimen current 30 nA, and measurement times between 10 and 40 s. Standards and X-ray lines were: RuLα, RhLα, OsMα, IrLα, AuLα, AgLβ, NiKα, SeKα, TeLα, BiMα, SnLα (metals), PtLα and FeKα (synthetic Pt3Fe alloy), PdLα (synthetic PdS), SKα (synthetic PtS), AsLα (synthetic GaAs), PbMα (galena) and SbLα (stibnite). Raw data were corrected using the PAP program (Pouchou and Pichoir, Reference Pouchou, Pichoir, Heinrich and Newbury1991) supplied by CAMECA. Additional corrections were performed for overlaps of Rh, Pd, Ag, Cu, As and Sb with secondary lines. Detection limits for the elements listed are ~0.1 wt.%. In PGE oxides/hydroxides, oxygen was measured using a PC2 multilayer crystal and calibrated against magnetite and cassiterite.
Results
General petrographic and mineralogical observations
The Waterberg mineralization is a fault-bound hydrothermal quartz-hematite-PGM vein deposit. Hematite is the predominant opaque mineral (up to 10 vol.%), and sulfides are absent, indicating high oxygen and low sulfur fugacities of the mineralizing fluid. The PGM-bearing quartz veins display well-developed growth zoning and are multiply banded, indicating numerous pulses of fluid infiltration (Fig. 3). Characteristic of all samples are reddish, brecciated angular host rock fragments (termed ‘felsite’ by Wagner Reference Wagner1929a). Included within these are brecciated fragments of white quartz. The vein quartz forms the cement between the reddish fragments as well as larger zoned veins with radial-fibrous aggregates, botryoidal textures and druses. Many vein quartz crystals exhibit well-developed growth zoning and are locally crowded with minute hematite inclusions arranged parallel to the crystal faces between successive growth zones. The quartz veins often show crustiform and reniform banding, with prismatic crystals in the centre of these veins forming comb structures. In the centre of these veins, fine-grained vuggy textures are evidence of late open-space filling. Some of the vugs are filled with cuspate masses of specular hematite. Later quartz generations form thin veins and veinlets which cross-cut the earlier quartz. The described textures are characteristic of an epithermal environment of mineralization (McDonald et al. Reference McDonald, Ohnenstetter, Rowe, Tredoux, Pattrick and Vaughan1999a; van den Kerkhof and Sosa (Reference van den Kerkhof and Sosa2009).
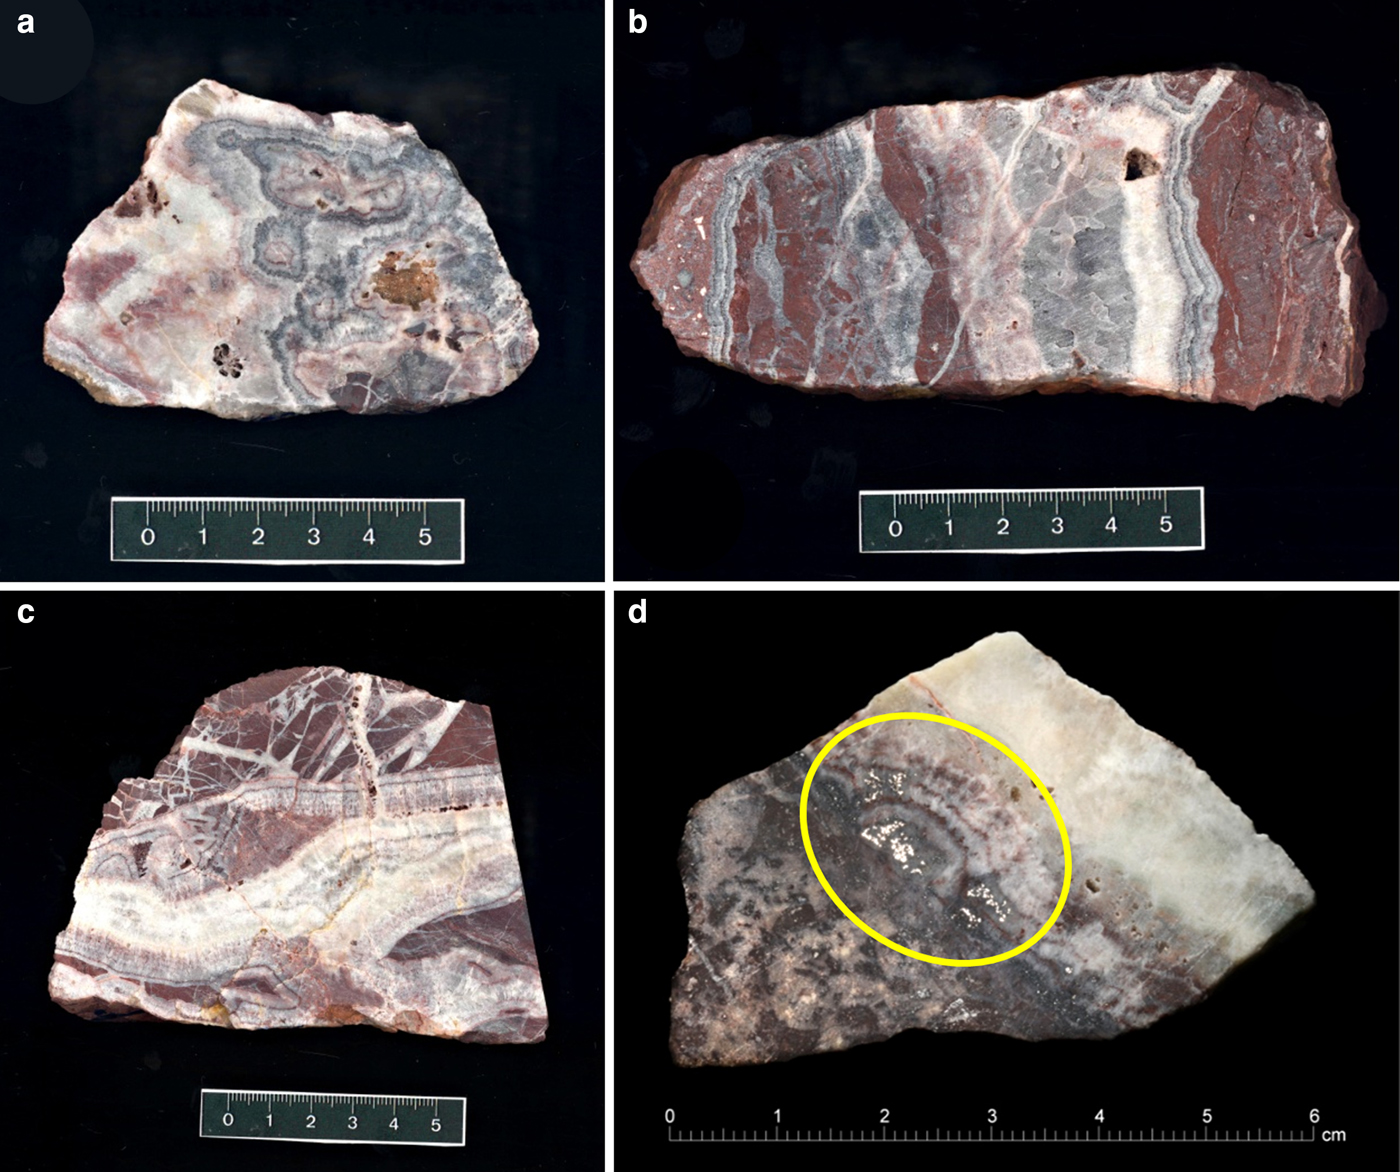
Fig. 3. (a–c) Photographs of slabs of ore samples from the Waterberg deposit. Note multiple banding of quartz veins. (d) Sample WatC showing Pt mineralization (metallic white) in banded quartz vein. Fine-grained hematite is present in darker areas. Collection Reuning 9.9.1925, Museum für Naturkunde Berlin. Polished section Hd_5034 of Ramdohr (Heidelberg Collection) and section 8185 (BGR) were made from this sample.
Further minerals detected in this study are chrome-rich mica (fuchsite), kaolinite, and an undetermined Ba-Al silicate, which occurs within and along the borders of the quartz veins. Fine-grained phosphates with rare-earth elements (REE) termed ‘monazite’ by McDonald et al., Reference McDonald, Ohnenstetter, Rowe, Tredoux, Pattrick and Vaughan1999a) were observed sporadically, intimately intergrown with and dispersed in native platinum. McDonald et al. (Reference McDonald, Ohnenstetter, Rowe, Tredoux, Pattrick and Vaughan1999a) discussed the enigmatic platinum-monazite relationship and proposed a certain degree of co-precipitation from epithermal fluids. However, the detected REE-phosphates may also be related to the rhabdophane group of minerals [(Ce,La)PO4·H2O] which have been reported repeatedly from hydrothermal ore deposits (e.g. Anthony et al., Reference Anthony, Bideaux, Bladh and Nichols2000).
Aqueous fluid inclusions (H2O–NaCl) occasionally contain fine-grained fibrous muscovite, confirmed by Raman analysis. The PGM are associated with the earliest vein quartz and occur together with hematite/specularite. Goethite replaces hematite in altered samples. Peters (Reference Peters2009) identified magnetite and rutile. Magnetite is characteristically altered to ‘martite’ along grain boundaries and fractures and probably is a relict mineral from the felsitic host rock. Rutile can also be seen as very fine grains intergrown with hematite.
The PGM assemblage mainly consists of roundish to globular grains of native platinum and Pt–Pd alloys (together >90% of the PGM assemblage), several Pd–As–Sb compounds, Pd–Pt oxides and some rarer PGM. Grain sizes range from a few μm to some mm, discussed in more detail below.
Geochemistry – whole-rock analyses
The chondrite-normalized PGE distribution patterns of Waterberg ores in comparison to data of the sulfide-poor platinum pipes and the UG-2 chromitite of the eastern Bushveld, and the sulfide-bearing Merensky Reef of the Bushveld and the Main Sulfide Zone of the Great Dyke in Zimbabwe are shown in Fig. 4 and the analytical data are presented in Table 1. The Waterberg patterns of the different samples are fairly systematic and demonstrate that Pt, and to a lesser degree Pd and Au, are strongly fractionated (enriched) relative to Os, Ir, Ru and Rh, and also versus both C-1 chondrite and the Merensky Reef, which is provided as an example of typical sulfide-related PGE ore. Notably, the Waterberg PGE patterns are further characterized by very low concentrations of IPGE (Os, Ir, Ru) and Rh, which are present at levels close to those of the primitive mantle (McDonough and Sun, Reference McDonough and Sun1995) and close to or below the detection limits of the INAA method (Fig. 4a). The Waterberg patterns also differ from those of the platiniferous dunite pipes of the eastern Bushveld as the latter are characterized by a strong enrichment of Pt (5–100 x C1) followed by Rh (1–10 x C1), whereas both Pd (0.8–5 x C1) and Au (0.1–1 x C1) display no, or only weak, upgrading (e.g. Oberthür et al., Reference Oberthür, Melcher, Sitnikova, Rudashevsky, Rudashevsky, Cabri, Kocks, Lodziak and Klosa2008; Fig. 4b). The co-enrichment of Pt, Pd and Au in the Waterberg ores is considered to reflect the specific mobilization and concentration of these elements by hydrothermal solutions.
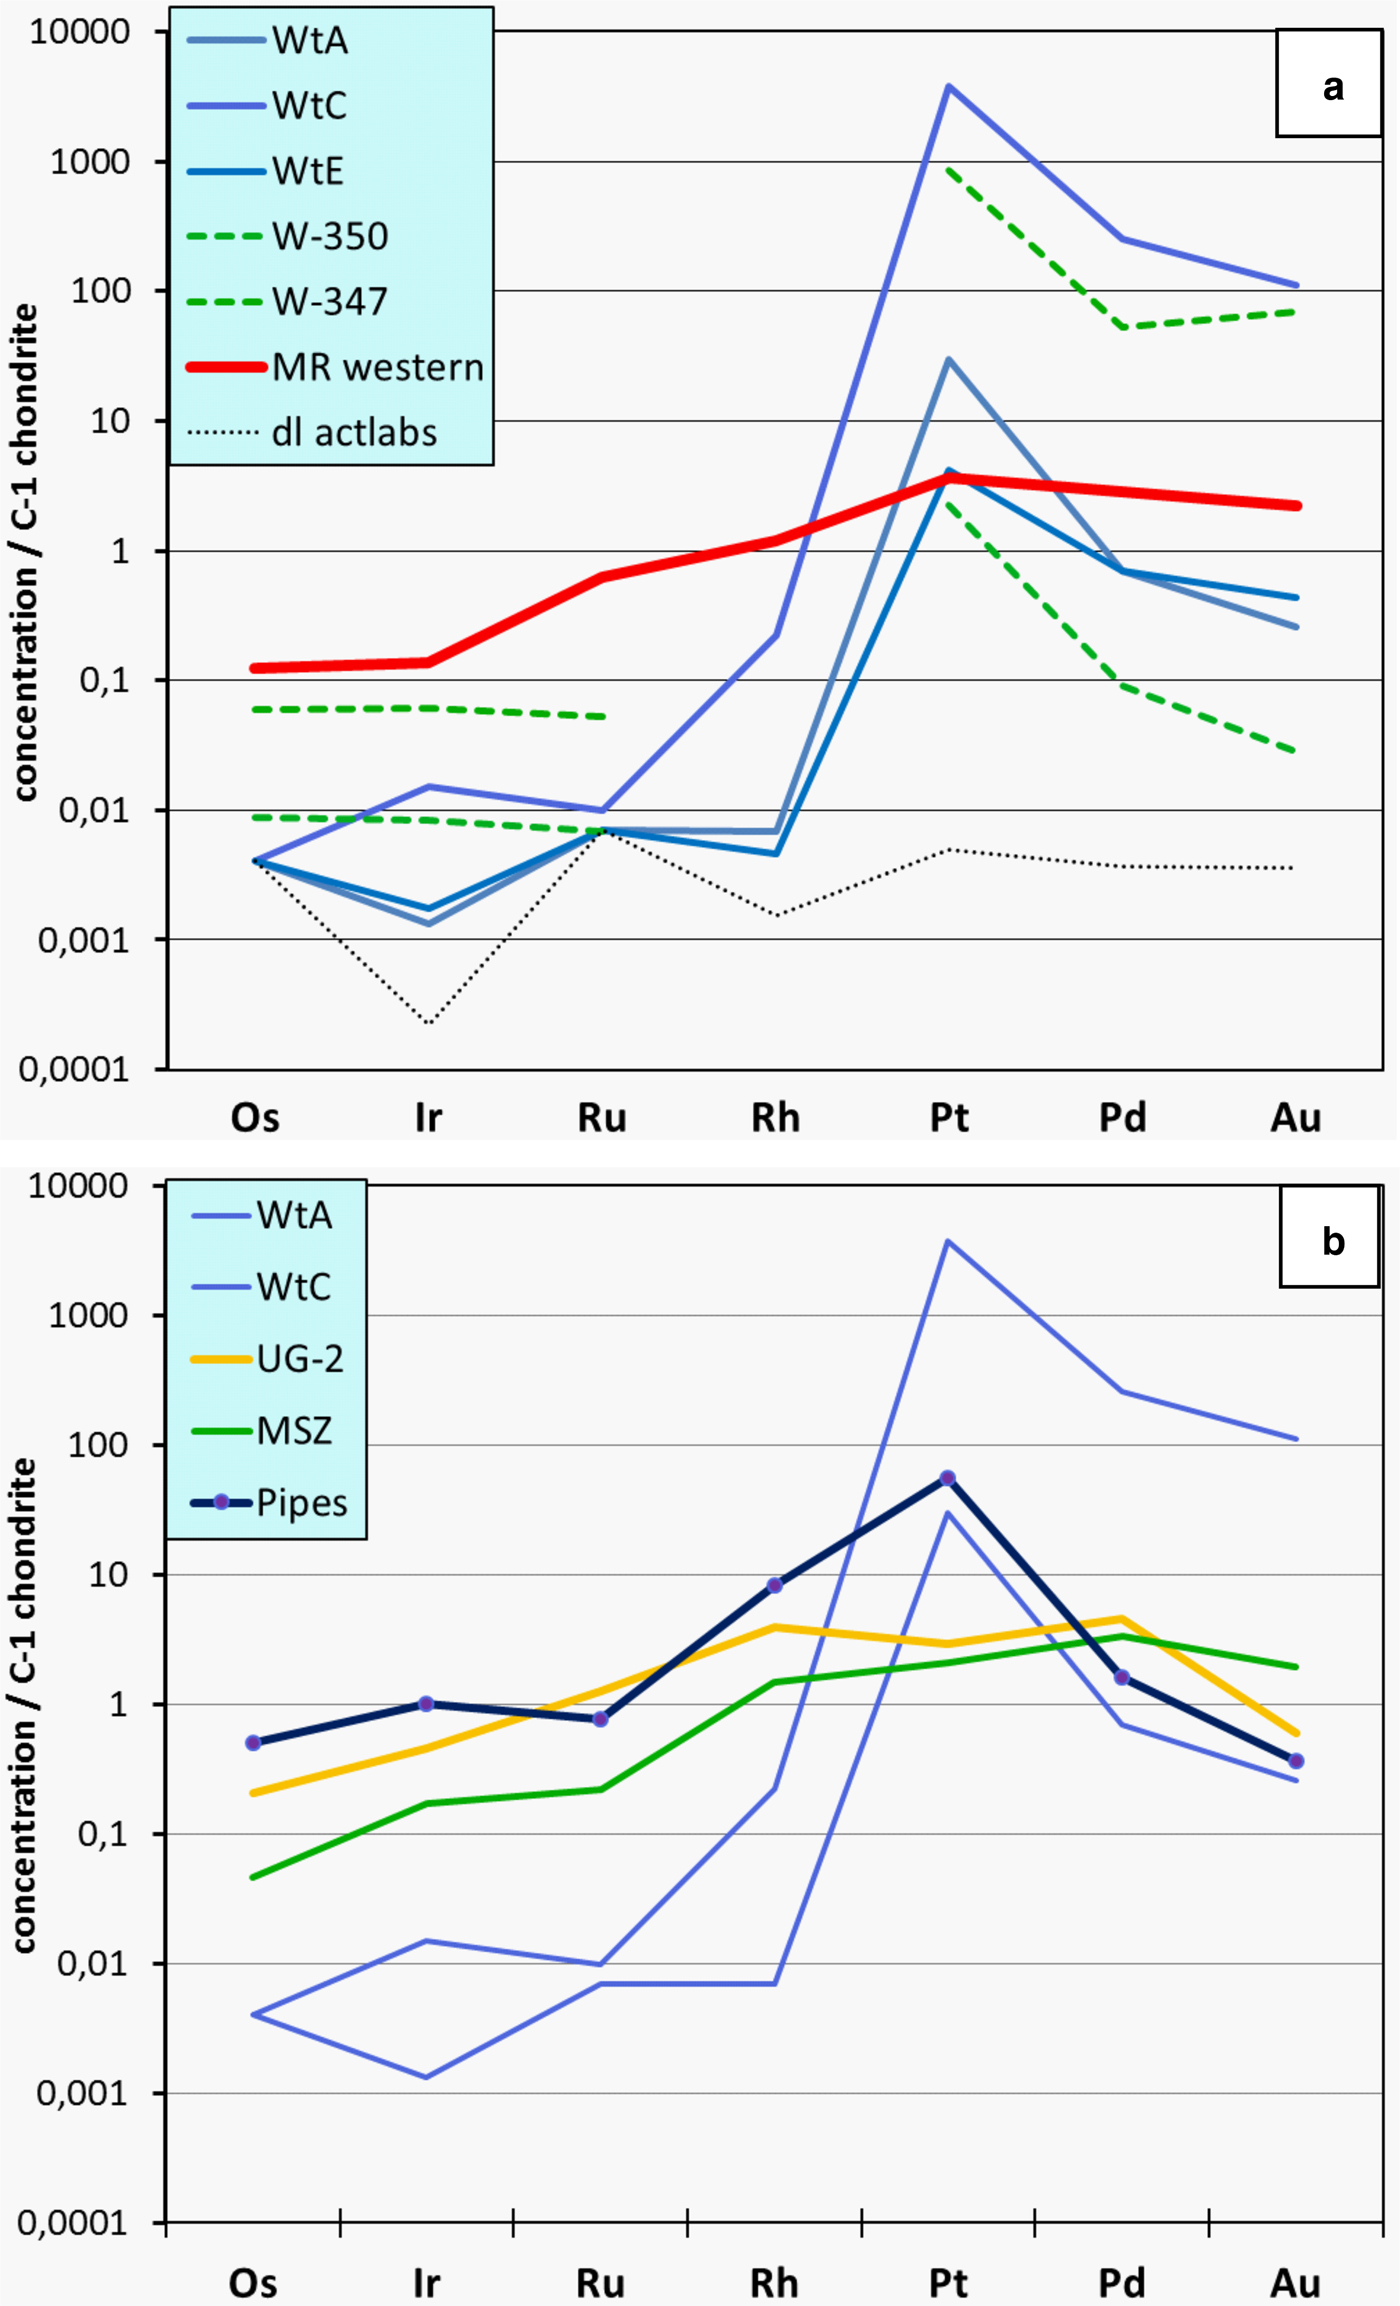
Fig. 4. PGE distribution patterns of Waterberg ores (C1 chondrite-normalized; McDonough and Sun, Reference McDonough and Sun1995). (a) Own data (WtA, C, E) and those from McDonald et al. (Reference McDonald, Tredoux and Vaughan1995; W-347, W-350). For comparison, an average PGE distribution pattern of the Merensky Reef of the western Bushveld (MR; Barnes and Maier, Reference Barnes, Maier and Cabri2002) is shown, as well as the detection limit (d.l.) of the INAA analyses performed by ACTLABS (samples WtA, C, E). (b) PGE distribution patterns of Waterberg ores (WtA, WtC) compared to patterns of the UG-2 chromitite (eastern limb; Barnes and Maier, Reference Barnes, Maier and Cabri2002), the Main Sulfide Zone of the Great Dyke (Oberthür, Reference Oberthür and Cabri2002), and the platiniferous pipes of the eastern Bushveld (average of three samples, see Table 1; own data, unpublished). For original analytical data see Table 1.
Table 1. Analyses of various ore samples (in ppb).

*average of seven sections of the PGE subzone of the Main Sulfide Zone; MSZ.
Data sources: (1) this work, (2) McDonald et al. (Reference McDonald, Tredoux and Vaughan1995), (3) own, unpublished data, analyst ACTLABS, (4) Barnes and Maier (Reference Barnes, Maier and Cabri2002), (5) Oberthür (Reference Oberthür and Cabri2002), (6) ACTLABS (www.actlabs.com).
Platinum-group minerals – general aspects and overview
The PGM assemblage mainly consists of roundish to globular grains of native platinum and Pt–Pd alloys (together >90% of the PGM assemblage; Fig. 3d), a number of Pd–As–Sb compounds, Pd–Pt oxides, rare potarite [PdHg], hongshiite [PtCu] and other Pt–Cu alloys and sperrylite [PtAs2]. Grain sizes range from a few μm to some mm. The PGM grains occur in verruciform bulges of the veins, as garlands or cockades, and smaller grains occasionally form emulsion-like textures. The ore textures of the ‘platinum’ led Wagner (Reference Wagner1929a) to propose that the platinum was transported in a colloidal form and deposited as a gel. This suggestion was corroborated by Ramdohr's observations on polished sections (“sicher Gelnatur”; written notes, Ramdohr collection, Heidelberg).
The Pt–Cu alloy (hongshiite) locally forms rims on native platinum (Fig. 5f). Pd–Sb–As compounds occur as idiomorphic grains (laths, well-formed crystals) overgrowing native Pt and Pt–Pd alloys (Figs 5g–h, 6a–d). Some small (<5 µm) grains of potarite [PdHg] were observed rimming grains of a Pt–Pd alloy and also in the centres of native platinum. One discrete grain of sperrylite [PtAs2] was detected intergrown with a Pt–Pd alloy. Singular, very rare grains of sulfides are an undetermined Cu-Bi-sulfide and chalcopyrite. Several gold grains were also detected, mainly intergrown with Pd-oxides/hydroxides (Fig. 7).
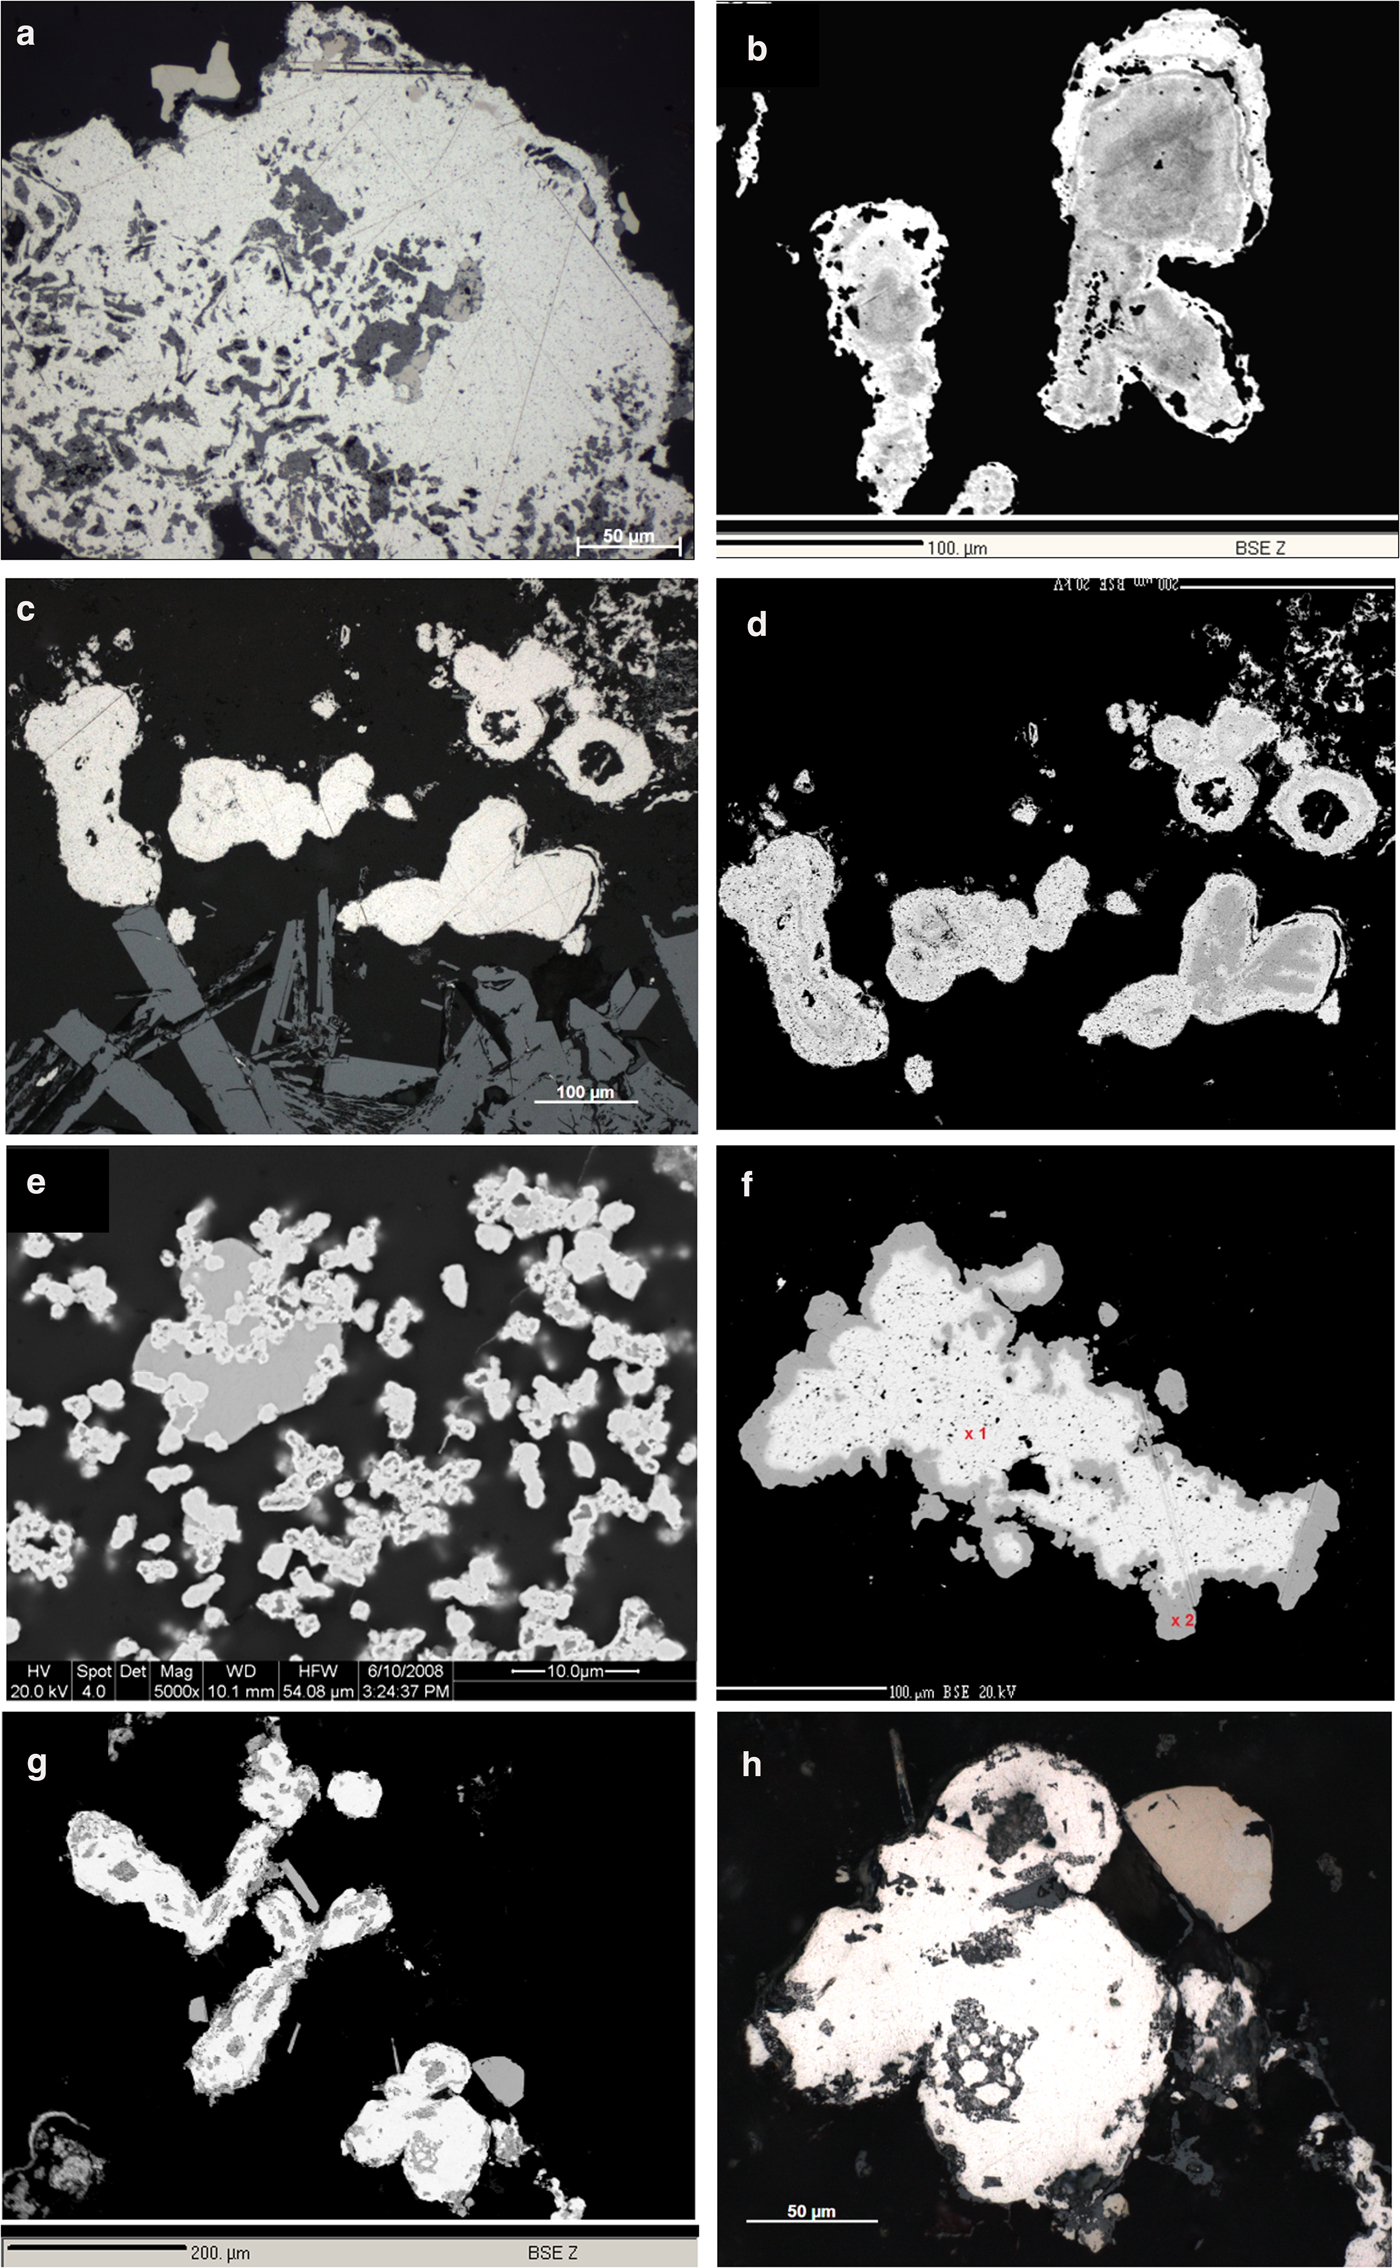
Fig. 5. Photomicrographs, reflected light (RL), in oil and back-scatter electron images (BSE). (a) Native platinum (white) with inclusions of Pd–Sb–As compounds (brownish, darker) and PGE-oxides (medium grey) in quartz (black). RL, WtC, 8185a. (b) Zoned grain of native platinum (lighter rims) on Pt–Pd alloy (darker). BSE image, Hd5034a. (c) Roundish Pt–Pd alloy grains (white) and laths of hematite (medium grey, bottom of image). RL, WtC, 8185b. (d) As (c) zoning of Pt–Pd alloy grains (darker parts of the grains have lower Pt/Pd ratios) becomes visible in this BSE image. (e) Emulsion-like dispersion of native Pt (light grey) in quartz (black), transecting a grain of a Pd–Sb–As compound (medium grey). BSE, Hd4086. (f) Native platinum (white; 97.77 wt.% Pt) surrounded by a thin rim (darker) of Pt–Cu alloy (hongshiite). BSE, AS 8183a, WtA. (g) Roundish to oval grains of native platinum (white) associated with well-crystallized grains of a Pd–Sb–As compound (medium grey). BSE, Hd5034a. (h) Magnification of (g), (RL, in oil). Native platinum (white) and Pd–Sb–As compound (medium light brownish, top right).
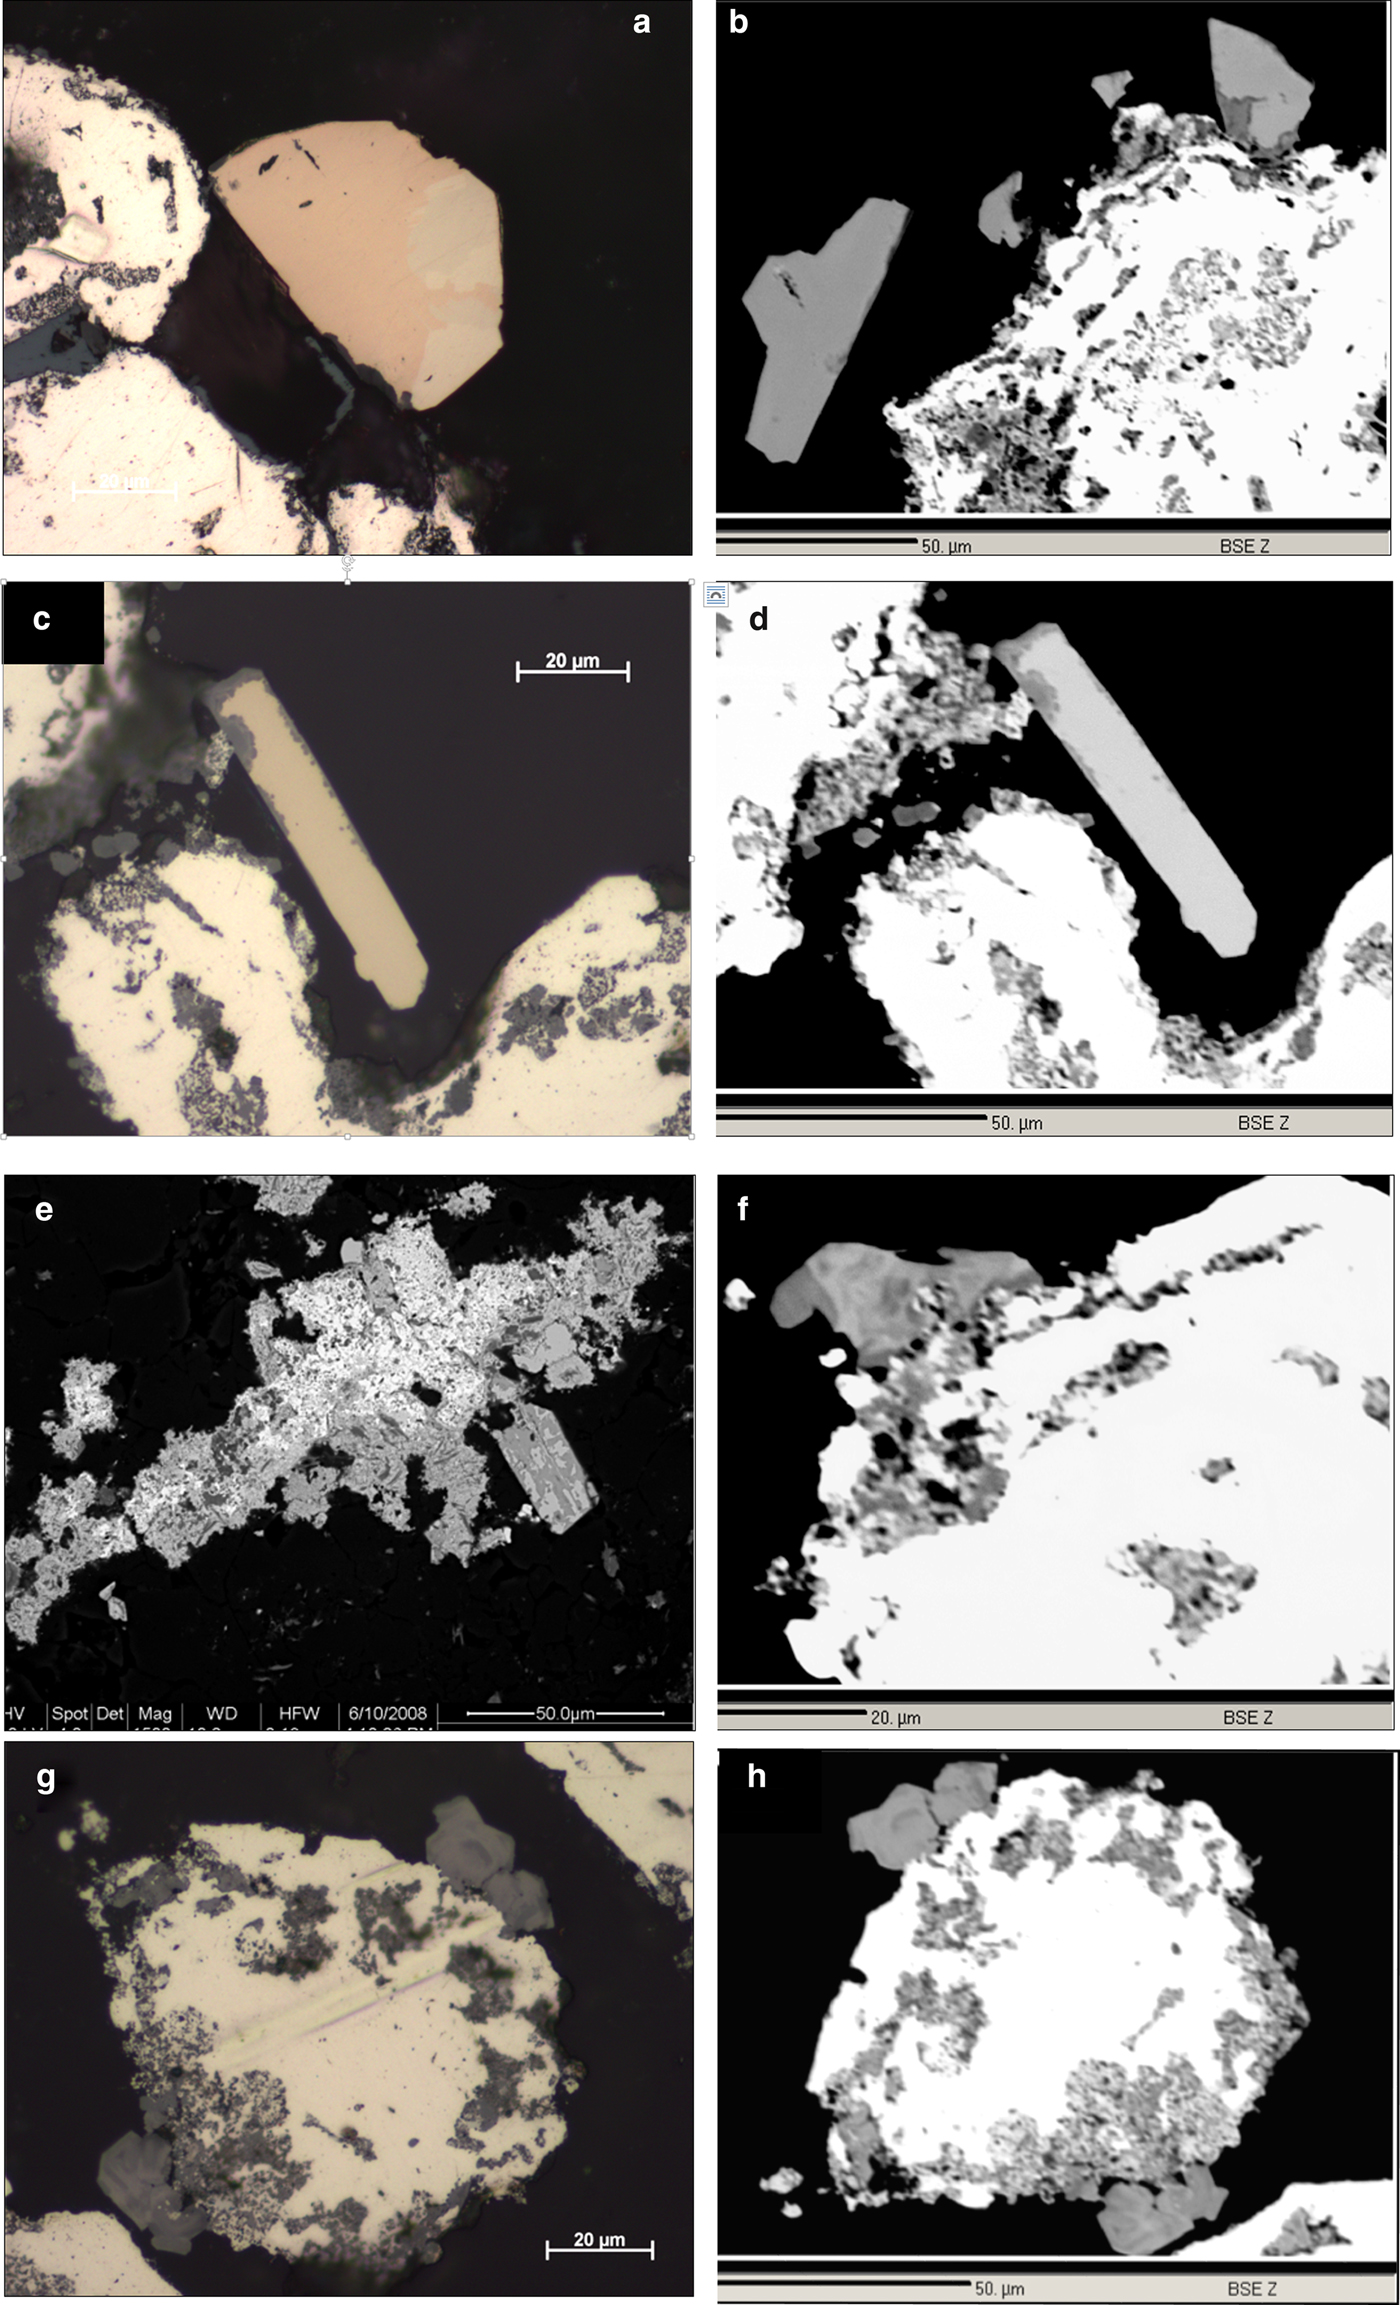
Fig. 6. (a) Magnification of Fig. 5h (RL, in oil). Native platinum (white, left) and grain of Pd–Sb–As compound (light brownish) showing two distinct lighter (strongly anisotropic) and darker (isotropic) areas. (b) Hypidiomorphic to idiomorphic grains of Pd–Sb–As compound (medium grey) on the periphery of native platinum (white). BSE, Hd5034a. (c) Native platinum (white with yellow tint) and idiomorphic grain of Pd–Sb–As compound (light brownish) with thin oxidation rim (dark grey). RL, Hd5034a. (d) as C, BSE image. Note darker oxidation rim. (e) Aggregate of various PGM in disaggregation. White areas are fine-grained native platinum surrounded by hypidiomorphic grains of Pd–Sb–As compound (lighter grey remnants) showing pervasive oxidation (Pd-Pt oxides/hydroxides, dark grey). BSE, Hd4086a. (f) Hypidiomorphic grain of zoned crystals of Pd-Pt oxide/hydroxide (light to dark grey) on the periphery of native platinum (white). BSE, Hd5034a. (g) Hypidiomorhic grains of zoned crystals of Pd–Pt oxides/hydroxide (darker grey) on the periphery of native platinum (white with yellowish tint). RL, Hd5034a. (h) as (g), BSE image.
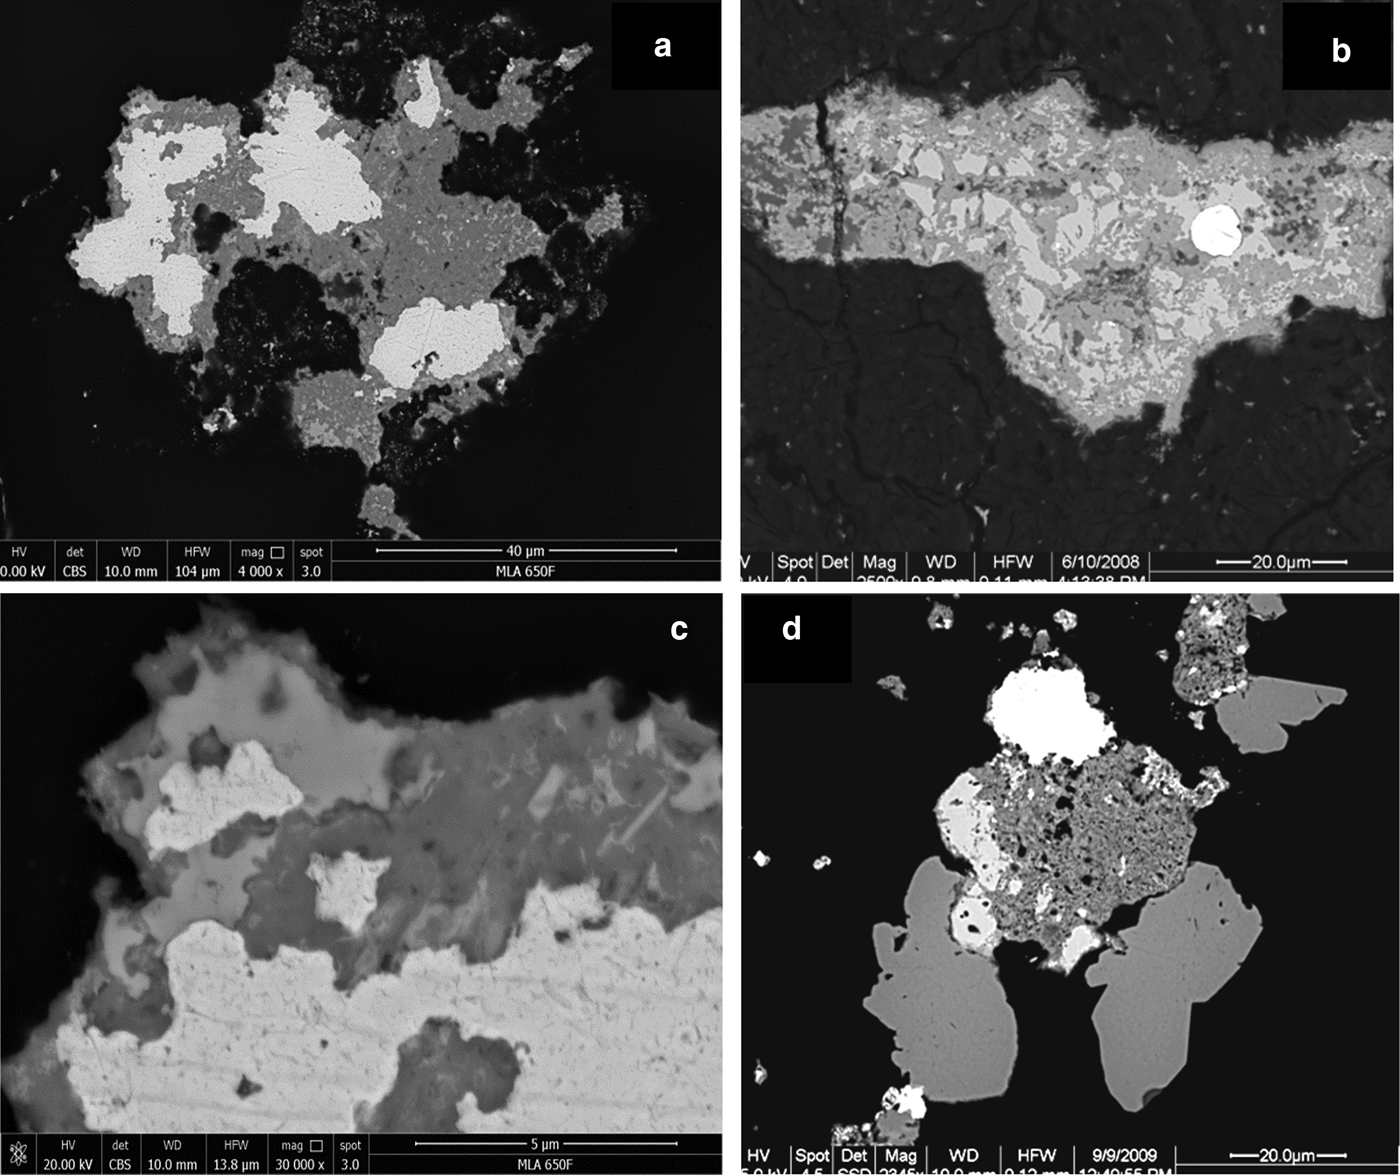
Fig. 7. Back-scatter electron images (BSE): (a) Ragged, Pd-bearing gold grains (white; Table 1, analyses 14) surrounded by Pd–Pt oxides/hydroxides (medium grey) which contain some remnants of Pd–Sb–As compounds (lighter grey). 9204b, Wat2009. (b) Gold grain (white) surrounded by Pd–Sb–As compound (lighter grey, remnants) and Pd–Pt oxides/hydroxides (medium grey). BSE, Hd4086a. (c) Magnification of (a), showing delicate intergrowth of gold (white), Pd–Pt oxides/hydroxides (medium grey) and remnants of Pd–Sb–As compounds (lighter grey). (d) Gold (white, top, slightly inhomogeneous and Pd-rich (~10–22 wt.% Pd; Table 1, analysis 15), Pd–Pt oxides (porous, dark grey, center), two hypidiomorphic grains of unnamed Pd3As (stillwaterite? – medium grey, bottom) and unnamed Pt2CuAs (light grey, left of mass of Pd–Pt-oxides). NHM-2, 9081c.
Incipient oxidation is commonly observed on the rims of the Pd–Sb–As compounds (Fig. 6b–d), and pervasive oxidation is present in the form of larger masses of Pd-oxides/hydroxides which may contain relics of the Pd–Sb–As compounds (Fig. 6e). In addition, zoned and translucent Pd-oxides/hydroxide crystals are locally found on the peripheries of grains of native Pt and Pt-Fe alloys (Fig. 6f–h). The main PGM and their compositional variation are described below.
Native Platinum and Pt–Pd alloys
Native Platinum (0.7–4.61 at.% Pd) and Pt–Pd alloys (6.40–30.76 at.% Pd), the most common PGM in the Waterberg ores (Fig. 5a–e), have variable, low iron contents (usually <0.5 at.% Fe). Copper contents are below the detection limit of ~0.1 at.% Cu, as are all other PGE (detection limits of ~0.2 at.%). However, distinct gold contents (average 0.27 at.% Au, maximum 1.67 at.% Au) are constantly present in both native Pt and the Pt–Pd alloys.
Pt–Cu alloys
Pt–Cu alloys locally form thin (≤10 µm) rims on native platinum (Fig. 5f). These rims are stoichiometric in composition, indicating the presence of the mineral hongshiite [PtCu]. Distler and Yudovskaya (Reference Distler and Yudovskaya2002) also detected “minerals of the Pt–Cu–(Au) system”, however, their analyses showed a much wider scatter in Pt–Cu ratios (Fig. 8). Notably, hongshiite has also been reported from BIF-hosted Au–Pd–Pt mineralization (‘jacutinga’) in Brazil (Kwitko et al., Reference Kwitko., Cabral, Lehmann, Laflamme, Cabri, Criddle and Galbiatti2002).
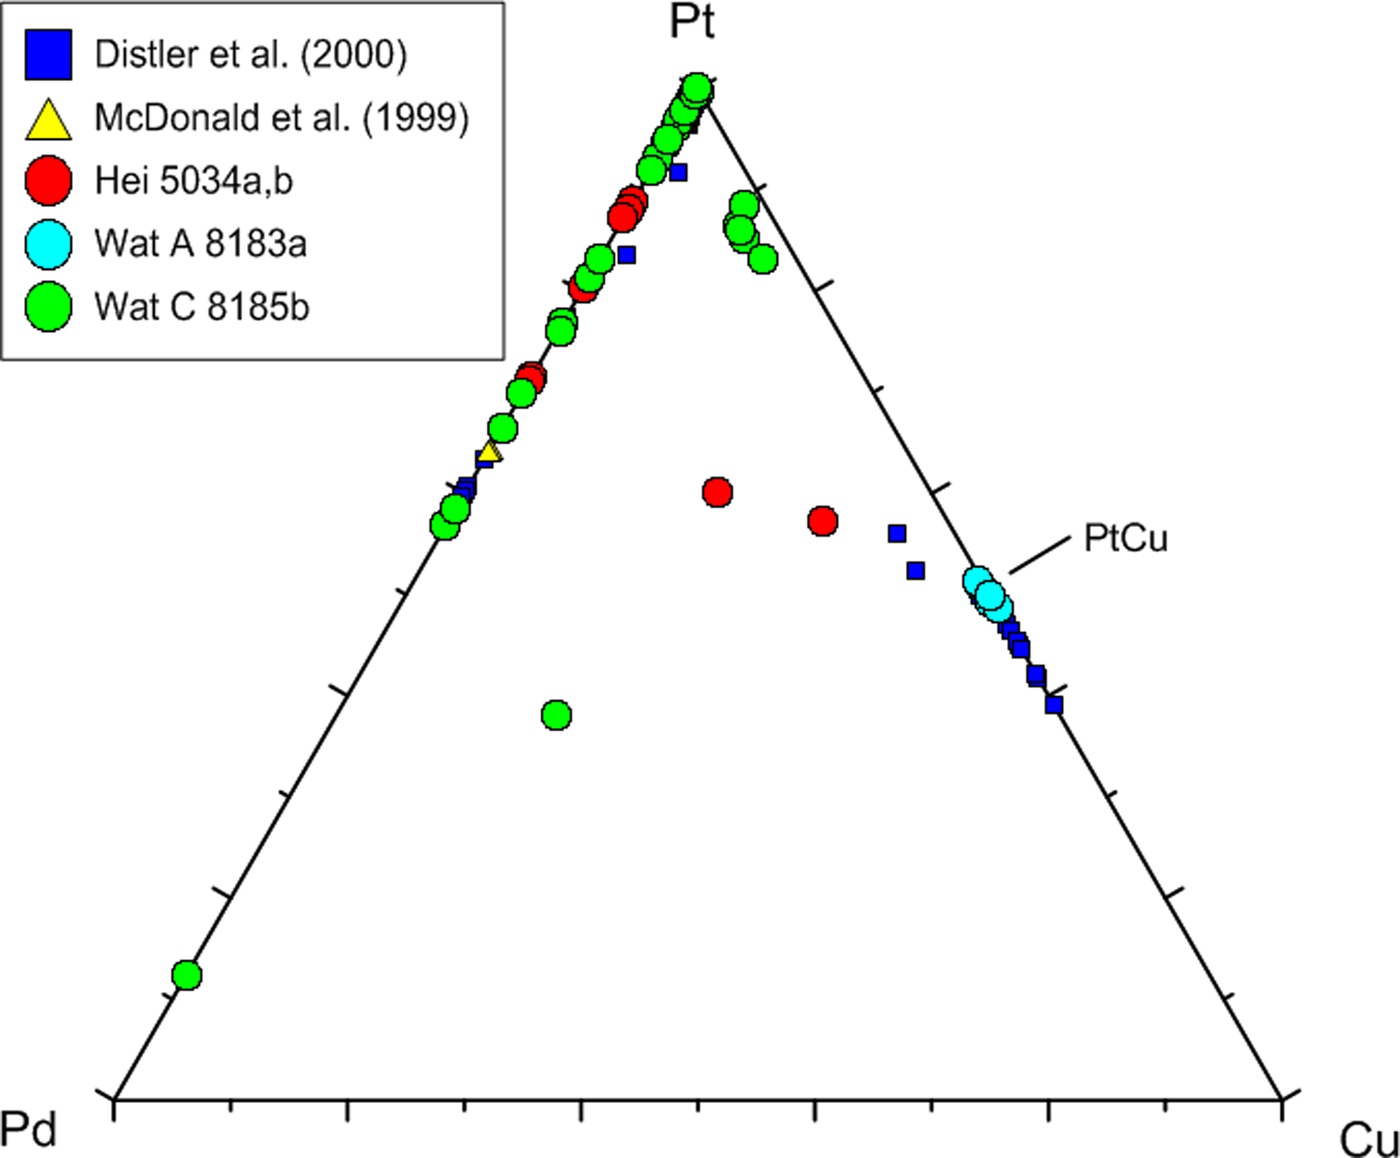
Fig. 8. Compositional variation of native Pt, Pt–Pd and Pt–Cu alloys in the triangular plot Pt–Pd–Cu (at.%). Included are 30 analyses from Distler et al. (Reference Distler, Yudovskaya, Prokof'ev, Sluzhenikin, Mokhov and Mun2000) and 11 analyses (7 plot on or close to Pt = 100) from McDonald et al. (Reference McDonald, Ohnenstetter, Rowe, Tredoux, Pattrick and Vaughan1999a). Own data comprise 64 analyses.
In Fig. 8, a large number of analyses underline the presence of the mineral hongshiite [PtCu], and a small cluster of Pt–Cu alloy grains with lower Cu contents (~10–15 at.%) comprises small, isolated grains in a matrix of Pd-oxides/hydroxides. The latter grains might represent the mineral kitagohaite [Pt7Cu], recently described by Cabral et al. (Reference Cabral, Lehmann and Jedwab2012, Reference Cabral, Skála, Vymazalová, Kallistová, Lehmann, Jedwab and Sidorinová2014) from placer concentrates from the DR Congo, and the authors suggest that the kitagohaite grains originate from hydrothermal quartz lodes. Cabral et al. (Reference Cabral, Lehmann and Jedwab2012, Reference Cabral, Skála, Vymazalová, Kallistová, Lehmann, Jedwab and Sidorinová2014) observed rims of hongshiite around their kitagohaite grains, very similar to the native platinum surrounded by hongshiite in the Waterberg deposit (Fig. 5f).
The peripheral replacement of native Pt by hongshiite attests to the activity of Cu-rich fluids present at the final stage of mineralization. An overview of the chemical variation of native Pt, Pt–Pd and Pt–Cu alloys is presented in Fig. 8, and analytical data are presented in Table 1, analyses 1–5.
In addition, one rare grain each approaching the composition [Pt2Cu] or [Pt2PdCu] were analysed (1,2), four grains close to [Pt2CuAs] in composition were detected (3), and several homogeneous grains of stillwaterite [Pd8As3] or unnamed [Pd3As] were identified (4,5). Their respective mineral formulae are: (1) [(Pt2.07Pd0.16)2.25(Cu1.05Fe0.29)1.34] (Z = 4); (2) [(Pt1.55Pd0.12)1.67(Cu0.79Fe0.22)0.99] (Z = 3); (3) [(Pt1.98Pd0.11)2.09Cu0.82As1.02] (Z = 4; average of 3 analyses); (4) [(Pd8.13Pt0.03)8.16As2.84] (Z = 11; average of 9 analyses); and (5) [(Pd2.96Pt0.01)2.97As1.03] (Z = 4; average of 9 analyses).
Pd–(Pt)–Sb–As compounds
A wide compositional range of minerals in the system Pd–(Pt)–Sb–As was encountered in this study. According to Cabri (Reference Cabri and Cabri2002), stibiopalladinite [Pd5+xSb2–x] (hexagonal) and mertieite-II [Pd8(Sb,As)3] (rhombohedral) are ‘related’. Both minerals are cream-yellow to yellowish white in colour and variably anisotropic. Cabri (Reference Cabri and Cabri2002) noted that Sb contents per formula unit range from about Sb1.26 to Sb1.95 in stibiopalladinite, and that the ratio Sb:(As,Te,Sn,Bi,Pb) is usually 5:1 in mertieite-II. Further, isomertieite (cubic) and mertieite-I (hexagonal), both [Pd11Sb2As2], are hard to distinguish optically (light yellowish white to brass or cream-yellow; anisotropy indistinct), have Sb:As ratios near unity, and usually have low contents of other elements besides Pd, As and Sb (Cabri, Reference Cabri and Cabri2002).
Pd–(Pt)–Sb–As compounds occur as idiomorphic grains (laths, well-formed crystals) overgrowing native Pt and Pt–Pd alloys (Figs 5g–h, 6a–d), and they are either distinctly anisotropic or isotropic. The Pd–(Pt)–Sb–As compounds are often intergrown with each other and distinction by both optical and chemical means is difficult. However, based on our analytical data (Fig. 9), distinction can be made between a ‘mertieite-II’ and an ‘isomertieite’ group. Microanalytical data are given in Table 1, analyses 6–9.

Fig. 9. Plot of (Pd/Pd+Pt) versus (Sb/Sb+As) showing the chemical variation of Pd–Sb–As compounds (EPMA). Further explanations are provided in the text.
Chemically, the ‘mertieite-II’ group of Pd–(Pt)–Sb–As compounds has Pd contents in the range 61.44 to 72.47 at.%. Distinct though variable platinum contents range from 0.20 to 10.77 at.% Pt. Antimony is the second major component (14.04–22.22 at.% Sb), and arsenic contents range from 4.13–10.54 at.% As. Sb/Sb+As ratios range from 0.73–0.84. Occasionally, some copper (up to 1.64 at.% Cu) was detected. Substantial substitution of Pt for Pd and As for Sb is obvious.
The ‘isomertieite’ group of Pd–(Pt)–Sb–As compounds displays Pd contents ranging from 58.74 to 73.43 at.%. Again, Pt contents are encountered constantly (range 0.30–12.78 at.% Pt). Antimony and As contents range from 8.52–15.51 at.% Sb and 9.77–13.60 at.% As. Sb/Sb+As ratios range from 0.45–0.65. Copper is constantly present and Cu contents range from 0.32–6.57 at.%. (average ≈ 2 at.% Cu).
The constant presence of distinct, high platinum contents (average 4.52, maximum 15.06 at.% Pt) in minerals of the Pd–Sb–As system is reported here for the first time. Cabri (Reference Cabri and Cabri2002) gives a maximum value of 0.17 wt.% Pt in mertieite-II, and no Pt contents for the other Pd–Sb–As compounds, and Shcheka et al. (Reference Shcheka, Solianik, Lehmann, Bieniok, Amthauer, Topa and Laflamme2004) report up to 4.13 wt.% Pt in detrital mertieite-II crystals of the Darya river, Aldan Shield, Russia.
Pd-/Pt-oxides/hydroxides
Pd-/Pt-oxides/hydroxides occur in the following forms: (1) as thin layers replacing Pd–Sb–As compounds from their rims (Figs 6c–d); (2) as larger masses which often contain relics of the Pd–Sb–As compounds (Fig. 6e); and (3) as zoned and translucent, newly-formed crystals (or complete replacements of Pd–Sb–As compounds?) on the peripheries of grains of native Pt and Pt–Fe alloys (Fig. 6f–h). The chemical compositions of these Pd-/Pt-oxides/hydroxides vary enormously, indicating that variable mixtures of Pd- and Pt-oxides/hydroxides and relic Pd–Sb–As compounds are present (Fig. 10). Some analyses approach the compositions [PdO] and [PdO2], however, although oxygen was analysed as well (range 7–55 at.% O), analytical totals average 93.46 wt.% only, probably due to the presence of hydroxides and the high porosity of the material.
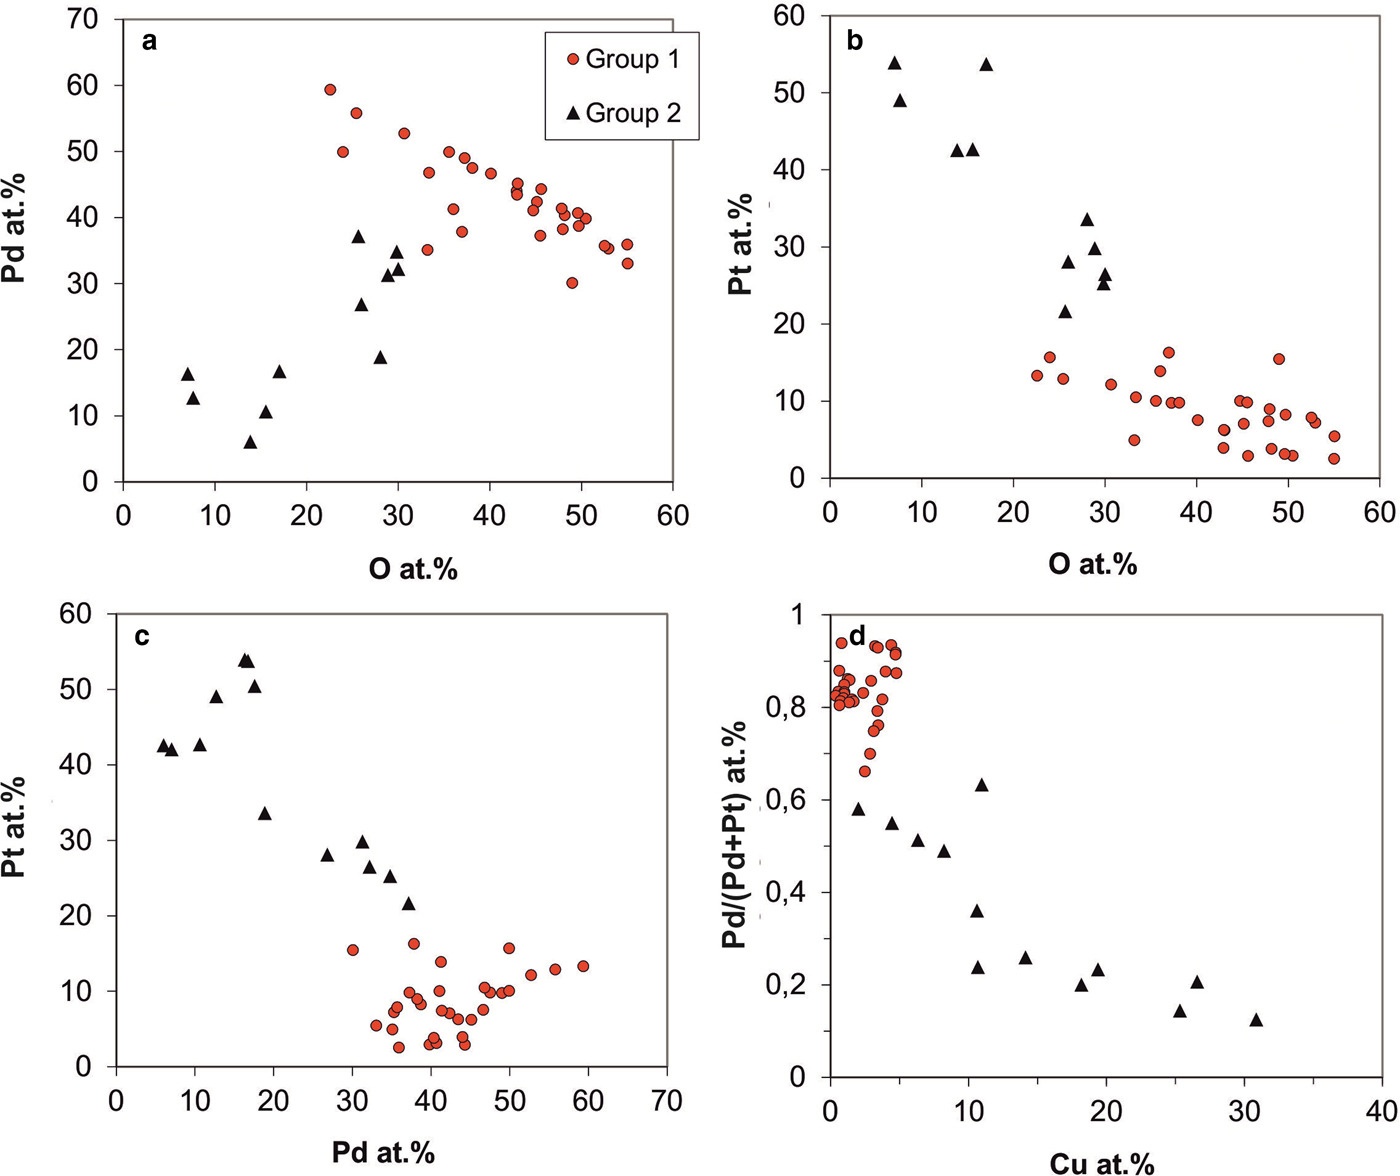
Fig. 10. Analytical variation of Pd-Pt-oxides/hydroxides by EPMA (in at.%). (a) Pd vs. oxygen contents. (b) Pt vs. oxygen contents. (c) Pt vs. Pd. (d) Pd/Pt ratios (formulated as Pd/Pd+Pt) vs. Cu contents.
The data presented in Fig. 10 indicate that at least two groups of Pd-/Pt-oxides/hydroxides can be distinguished. Most of the Pd-/Pt-oxides/hydroxides are Pd-dominated (Fig. 10a,c); Pd contents range from 30 to 60 at.% and Pt-contents are below 20 at.% (average 8.3 at.%; Fig. 10b); Pd/(Pd+Pt) ratios range from 0.66–0.97 (average 0.84; Fig. 10d). These phases have low, but variable Cu (average 2.2 at.%, max 4.8 at.%; Fig. 10d), As (average 2.2 at.%, max 5.3 at.%), Sb (average 1.5 at.%, max 3.6 at.%) and 22–58 at.% oxygen. Metal/oxygen ratios range from 1 to 3 (average 1.5).
The second group has lower Pd (<40 at.%) and elevated concentrations of Pt (average 38 at.%, range 15–54 at.%); Pd/(Pd+Pt) ratios range from 0.12–0.63 (Fig. 10a). In contrast to Pd-dominated oxide/hydroxide phases, they have higher Cu (average 14 at.%; Fig. 10d) and As (average 4.5 at.%) contents. Oxygen contents are lower than in the first group (mostly 7–30 at.%), with metal/oxygen ratios >2.3 and ranging up to 13.
Both groups of Pd-/Pt-oxides/hydroxides persistently have Sb and As contents, pointing to their origin from the disintegration of Pd–Sb–As compounds. Notably, Cu is constantly present in the Pd-/Pt-oxides/hydroxides (average 5.22 at.% Cu; range 0.17–30.87 at.% Cu), whereas Fe contents are low (average 0.29 at.% Fe). Occasionally, sulfur was detected (up to 19.64 at.%), probably indicating the presence of sulfates. Variable oxygen contents and partly high metal/oxygen ratios may indicate that disintegration of the precursor phases was incomplete. Microanalytical data are given in Table 2, analyses 10–12.
Table 2. Microprobe analyses of various PGM.
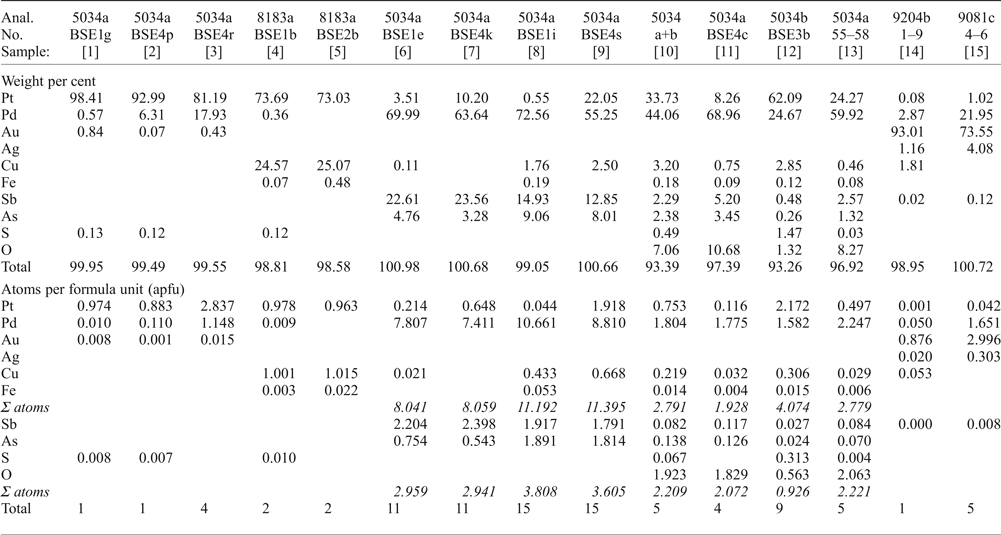
[1] native Pt; [2, 3] Pt–Pd alloys; [4, 5] Pt–Cu alloy [hongshiite]; [6, 7] ‘mertieite-II’; [8, 9] ‘isomertieite’; [10] Pd-Pt-oxide/hydroxide [massive material], average of 50 analyses; [11] Pd-rich Pd-Pt-oxide/hydroxide; [12] Pt-rich Pd-Pt-oxide/hydroxide; [13] translucent grains of Pd-oxide/hydroxide, average of 4 analyses; [14] Gold, Pd-bearing, average of 9 analyses [AS9204b]; [15] Gold, extremely Pd-rich, average of 3 analyses (AS9081c).
Notably, the PGE-oxides from Waterberg described by McDonald et al. (Reference McDonald, Ohnenstetter, Rowe, Tredoux, Pattrick and Vaughan1999a) differ chemically from those described here. Their PGE-oxides are all Pt-dominant with very minor Pd or Au, no Sb or As above the detection limit, and traces of Fe and S. Further, these authors propose that their Pt–O compounds intergrown with native Pt and Pt–Pd alloy are primary features of the ores deposited at elevated temperatures from solution.
The observed textures of the samples studied here are in line with the previous models of supergene formation of PGE-oxides. The Pd-/Pt-oxides/hydroxides are secondary in nature and formed more or less in situ as a result of the oxidation of PGM precursor minerals during weathering of the primary ore assemblage. This probably also accounts for the PGE-oxides associated with native Pt and Pt–Fe alloy as seen in Fig. 5a. These PGM aggregates have sufficient pore space to allow introduction of fluids under supergene conditions. The zoned and translucent crystals of Pd-/Pt-oxides/hydroxides are either complete replacements of other PGM, or neoformations (Fig. 6f –h). They are chemically less variable (Table 2, analysis 13) than the other PGE-oxide phases and approach compositions ranging from [(Pd,Pt)O] to [(Pd,Pt)3O2].
Gold
The ‘primary’ Pt–Pd alloy grains all contain measurable contents of Au (average 0.27 at.% Au, maximum 1.67 at.% Au; Table 1, analyses 1–3). Further, gold is present as discrete grains intergrown with Pd/-Pt-oxides/hydroxides and various Pd–Sb–As compounds including the unnamed [Pt2CuAs] and [Pd3As] (Fig. 7a –d). The gold grains are either slightly Pd-bearing (~2 wt.% Pd) or Pd-rich (up to 23.73 wt.% Pd). In addition, low copper (~1 wt.% Cu), silver (1–4 wt.% Ag) and mercury contents (~0.4–0.5 wt.% Hg) are constantly present; no Pt concentrations were detected (Table 2, analyses 14 and 15). Cabral et al. (Reference Cabral, Tupinamba, Lehmann, Kwitko-Ribeiro and Vymazalova2008), working on palladiferous gold from placers of the Serra do Espinaço in Brazil, described two stoichiometric alloys corresponding to [Au2Pd] and [Au3Pd] and suggest that these compositions might represent unnamed mineral phases. A [Au3Pd] compound, stable below ~800°C, is known in the synthetic Au–Pd system (Nagasawa et al., Reference Nagasawa, Matsuo and Kakinoki1965; Okamoto and Massalski, Reference Okamoto and Massalski1985), and analysis 15 in Table 2 closely approaches this composition.
Sulfides
Although no pristine sulfides were detected in the Waterberg ores, Wagner and Trevor (Reference Wagner and Trevor1923) and Wagner (Reference Wagner1929a,b) proposed that the secondary iron oxides (a mixture of hematite and limonite) were “presumably derived from the oxidation of pyrite”. Equally, later research (McDonald et al., Reference McDonald, Tredoux and Vaughan1995, Reference McDonald, Ohnenstetter, Rowe, Tredoux, Pattrick and Vaughan1999a; Distler et al., Reference Distler, Yudovskaya, Prokof'ev, Sluzhenikin, Mokhov and Mun2000; Prokof'yef et al., Reference Prokof'yev, Distler and Yudovskaya2001) failed to identify any sulfides. In the present work, just one single, oval grain within quartz was found, ~12 µm in diameter, composed of Cu, Bi and S only, probably emplectite [CuBiS2] or wittichenite [Cu3BiS3]. Therefore, general agreement is reached that the Waterberg mineralization is virtually bare of sulfides.
Summary
PGE mineralization of the Waterberg deposit
The Waterberg deposit is a hydrothermal quartz-hematite-PGM vein mineralization. Hematite is the predominating opaque mineral and sulfides are virtually lacking, indicating high oxygen and low sulfur fugacities of the mineralizing fluid. The PGM-bearing quartz veins are multiply banded signifying manifold pulses of fluid infiltration which produced a number of cementing quartz generations. The PGE mineralization was introduced contemporaneously with the earliest generation of vein quartz and hematite.
Geochemical aspects
The chondrite-normalized PGE distribution patterns of the Waterberg ores demonstrate that Pt, and to a lesser degree Pd and Au, are strongly fractionated (enriched) relative to the IPGE (Os, Ir, Ru) and Rh. The mineralization is characterized by low contents of the IPGE and Rh, at levels close to those of the primitive mantle. The Waterberg PGE distribution patterns, therefore, strongly contrast to those typical of magmatic, sulfide-bearing ores which generally show enrichments, at variable degrees, of all PGE and particularly the PPGE (Pt, Pd, Rh), as illustrated by the examples of the Merensky Reef, the UG-2 and the Main Sulfide Zone of the Great Dyke in Fig. 4a and b. The Waterberg patterns also differ from those of the platiniferous dunite pipes of the eastern Bushveld which display strong enrichments of Pt followed by Rh whereas Pd and Au display no or only weak upgrading relative to C1 (Oberthür et al., Reference Oberthür, Melcher, Sitnikova, Rudashevsky, Rudashevsky, Cabri, Kocks, Lodziak and Klosa2008; Fig. 4b). Instead, further elements associated with the Waterberg PGE mineralization are Sb and As, but not sulfur. The specific pattern of co-enrichment of Pt, Pd and Au is regarded to be characteristic for the mobilization and concentration of these elements by hydrothermal solutions.
Platinum-group minerals
Native Pt and Pt–Pd alloys together constitute >90% of the PGM assemblage. The grains never show idiomorphic crystal shapes; instead, they occur in verruciform bulges of the vein, as garlands or cockades, and occasionally show internal growth zoning. Smaller grains sometimes form emulsion-like textures. These ore textures indicate that the ‘platinum’ was deposited as a gel, corroborating the early suggestion of Wagner (Reference Wagner1929a). Similar chemical compositions of Pt and Pt–Pd alloys are hardly found in magmatic PGE deposits, where various Pt alloys with iron ([Pt3Fe], [PtFe]) and a large suite of sulfides, arsenides, tellurides and bismuthotellurides of Pt and Pd may be present (e.g. Kinloch, Reference Kinloch1982; Cabri, Reference Cabri and Cabri2002; Oberthür, Reference Oberthür2011). Native Pt and Pt–Pd alloys are more commonly found in placers (e.g. Cabri et al., Reference Cabri, Harris and Weiser1996; Weiser, Reference Weiser and Cabri2002; Oberthür et al., Reference Oberthür, Melcher, Gast, Wöhrl and Lodziak2004, Reference Oberthür, Weiser, Melcher, Gast and Wöhrl2013, Reference Oberthür, Weiser and Melcher2014). Therefore, the joint presence of native Pt and Pt–Pd alloys is quite exotic and testifies to unique conditions encountered in the Waterberg mineralization.
The idiomorphic Pd–Sb–As compounds (mertieite-II and isomertieite) with unusually high Pt contents overgrow the Pt and Pt–Pd alloy grains and therefore, were deposited slightly later. Their presence indicates a change of the mineralizing fluid from Pt-dominated to a more Pd-, Sb- and As-rich system.
In a closing stage, probably down-temperature at the waning period of mineralization, hydrothermal alteration of native Pt by Cu-rich fluids led to the formation of hongshiite. Hongshiite has been reported from a number of mafic-ultramafic ores and associated placer deposits as well as from jacutinga-type ores in Brazil where the mineral is regarded as a hydrothermal component and is associated with palladian gold and native platinum (Kwitko et al., Reference Kwitko., Cabral, Lehmann, Laflamme, Cabri, Criddle and Galbiatti2002). The presence of hongshiite attests to another change of the mineralizing fluid from Pt-dominated via Pd-, Sb- and As-rich to Cu-rich.
Finally, the PGM assemblage was overprinted, probably near-surface and in recent times, by the formation Pd/Pt-oxides/hydroxides, mainly by obvious replacement of Pd–Sb–As compounds during weathering/oxidation of the ores, as also shown by the occurrence of goethite. Notably, chemically similar Pd-bearing oxide and hydrated oxide compounds replacing mertieite-II crystals were reported from alluvial sediments of the Darya river, Aldan Shield, Russia (Shcheka et al., Reference Shcheka, Lehmann and Solianik2005). McDonald et al. (Reference McDonald, Tredoux and Vaughan1995, Reference McDonald, Ohnenstetter, Rowe, Tredoux, Pattrick and Vaughan1999a) identified Pt-oxide species approximating [PtO], [PtO2] or [Pt(OH)2] in composition intergrown with native Pt and Pt–Pd alloy, and intact ‘stibiopalladinite’ (our Pd–Sb–As phases). McDonald et al. (Reference McDonald, Ohnenstetter, Rowe, Tredoux, Pattrick and Vaughan1999a) suggested that their Pt-oxides might be primary constituents of the ores deposited at elevated temperatures from solution. However, their fig. 5 shows somewhat porous Pt/Pt–Pd alloy with the Pt-oxides occupying the pores. In our opinion, this oxidation of an unknown precursor phase may well be also secondary in nature. Notably, the PGE-oxides of the present study have Pd>Pt (Fig. 10 and Table 1) and are products of the replacement of Pd–Sb–As compounds. Accordingly, they probably represent a different group of PGE-oxides than those described by McDonald et al. (Reference McDonald, Ohnenstetter, Rowe, Tredoux, Pattrick and Vaughan1999a) as the latter are all Pt-dominant with very minor Pd or Au, no Sb or As above detection limit, and traces of Fe and S.
Descriptions of PGE-oxides, mainly of Pd, Pt and Ru, have increased continuously, both from surface-near ores worldwide (e.g. Jedwab et al., Reference Jedwab, Cassedanne, Criddle, du Ry, Ghysens, Meisser, Piret and Stanley1993; Jedwab, Reference Jedwab1995; Hey, Reference Hey1999; McDonald et al., Reference McDonald, Ohnenstetter, Ohnenstetter and Vaughan1999b; Tolstykh et al., Reference Tolstykh, Krivenko, Lavrentev, Tolstykh and Korolyuk2000; Oberthür and Melcher, Reference Oberthür, Melcher and Mungall2005; Locmelis et al., Reference Locmelis, Melcher and Oberthür2010; Bowles et al., Reference Bowles, Suárez, Prichard and Fisher2017), and placers (e.g. Weiser, Reference Weiser and Cabri2002; Shcheka et al., Reference Shcheka, Lehmann and Solianik2005; Oberthür et al., Reference Oberthür, Weiser, Melcher, Gast and Wöhrl2013). Although the PGE-oxides remain poorly characterized mineralogically and chemically, in all instances reported above, they were suggested to be secondary products which formed under supergene, low-temperature conditions. The observed textures of the samples studied here are in line with the previous models of supergene formation of PGE-oxides. The Pd-/Pt-oxides/hydroxides are secondary in nature and formed more or less in situ as a result of the oxidation of PGM precursor minerals during weathering of the primary ore assemblage.
Synopsis
The textural relationships indicate that the PGM assemblage of the present samples came into existence during three distinct depositional and alteration events, namely: (1) Initial deposition of Pt–Pd alloys (Pt>Pd) and native Pt from hydrothermal fluids, concomitant with precipitation of the earliest generation of vein quartz and hematite, immediately succeeded by deposition of Pd–Pt–Sb–As compounds (Pd>Pt). Alternatively, the incoming solutions may have changed to Sb-As-rich to produce the well-crystallized Pd–Pt–Sb–As compounds. (2) Locally, hydrothermal alteration of native Pt by Cu-rich fluids led to the formation of hongshiite, probably down-temperature at the waning stage of mineralization. (3) Formation of Pd-oxides/hydroxides mainly by replacement of Pd–Pt–Sb–As compounds during weathering/oxidation of the ores, possibly near-surface and in recent times.
Discussion
Hydrothermal PGE mineralization
The enigmatic nature of the Waterberg mineralization does not fit standard models for hydrothermal PGE deposits. This is due to the fact that most hydrothermal PGE deposits contain more Au and Pd than Pt. In contrast, the mineralization of the ‘Waterberg-type’ is characterized by unique metal proportions, namely Pt>Pd>Au.
Occurrences and ores of hydrothermal PGE-Au dominated mineralization (typically Au>Pd>Pt) are known from the Serra Pelada in Brazil (Meireles et al., Reference Meireles, Teixeira and Medeiros Filho1982; Moroni et al., Reference Moroni, Girardi and Ferrario2001; Şener et al., Reference Şener, Grainger and Groves2002; Cabral et al., Reference Cabral, Lehmann, Kwitko and Cravo Costa2002a,Reference Cabral, Lehmann, Kwitko-Ribeiro and Cravo Costab; Cabral, Reference Cabral2006), from the New Rambler Mine, Wyoming, USA (McCallum et al., Reference McCallum, Loucks, Carlson, Cooley and Doerge1976), from the unconformity-related uranium deposits in the Northern Territory of Australia (Jabiluka, Coronation Hill, Gold Ridge; Wilde et al., Reference Wilde, Bloom, Wall, Keays, Ramsay and Groves1989; Carville et al., Reference Carville, Leckie, Moorhead, Rayner, Durbin and Hughes1990; Şener et al., Reference Şener, Grainger and Groves2002; Wilde, Reference Wilde and Mungall2005), the Bleïda Far West deposit in Morocco (Barakat et al., Reference Barakat, Marignac, Boiron and Bouabdelli2002; El Ghorfi et al., Reference El Ghorfi, Oberthür, Melcher, Lüders, El Boukhari, Maacha, Ziadi and Baoutoul2006), and from unconformity-related, Triassic to early Jurassic mineralization in South Devon, UK (Clark and Criddle, Reference Clark and Criddle1982; Gunn and Styles, Reference Gunn and Styles2002; Shepherd et al., Reference Shepherd, Bouch, Gunn, McKervey, Naden, Scrivener, Styles and Large2005).
Remarkable are also the gold and PGE contents of the Kupferschiefer in Poland and Germany. Kucha (Reference Kucha1982) described extraordinary enrichments of Au, Pt and Pd in a thin bituminous layer at the base of the Zechstein black shale unit, and Oszczepalski et al. (Reference Oszczepalski, Rydzewski, Speczik and Stanley1999) proved an extensive Au–PGE mineralization in intimate association with barren, red-coloured rocks (‘Rote Fäule’) in the vicinity of the copper ores in the Lubin district of Poland. It is suggested that the precious metals were transported in oxidizing, slightly acidic, chloride brines derived from underlying red beds (Shepherd et al., Reference Shepherd, Bouch, Gunn, McKervey, Naden, Scrivener, Styles and Large2005).
In summary, the rare hydrothermal PGE occurrences portrayed above mainly represent special styles of hydrothermal gold mineralization (typically Au>Pd>Pt). Wilde (Reference Wilde and Mungall2005) states that the genesis of hydrothermal PGE ores is not well understood as yet, but most appear to be the result of highly oxidized Cl-rich aqueous fluids or even brines concentrating PGE that occur dispersed in host intrusions. Depositional sites are controlled by abrupt changes in fluid pH or redox state that are caused by changes in wall-rock chemistry. Under conditions of 1.5 kb total pressure, oxygen fugacity equal to that of the Ni–NiO buffer, and at temperatures between 600–800°C, NaCl brines can dissolve very high concentrations of Pt. For example, Pt-saturated brines containing 20 wt.% equivalent NaCl contain typically 1000–3000 ppm Pt (Hanley, Reference Hanley and Mungall2005). Platinum solubility increases with increasing temperature but decreases markedly with increasing NaCl concentration, suggesting that hydroxyl becomes the main ligand under these conditions.
For comparison, numerous studies have established that mesothermal (~200–400°C) or mesozonal orogenic shear zone hosted gold deposits were formed by H2O–CO2 fluids of low (<10% NaCl equivalent) salinity, and that gold is transported in the form of thio- or chloride-complexes in geofluids that form Au-quartz vein mineralization (e.g. Roedder, Reference Roedder and Foster1984; Groves et al., Reference Groves, Goldfarb, Gebre-Mariam, Hagemann and Robert1998, Reference Groves, Goldfarb, Robert and Hart2003; Mikucki, Reference Mikucki1998; Goldfarb et al., Reference Goldfarb, Baker, Dube, Groves, Hart and Gosselin2005; Goldfarb and Groves, Reference Goldfarb and Groves2015). Similar conditions as for gold may apply for the PGE, as significant PGE transport by thio- or chloride complexes is possible if certain physicochemical requirements are encountered (Wilde et al., Reference Wilde, Bloom, Wall, Keays, Ramsay and Groves1989; Wood, Reference Wood and Cabri2002; Wilde, Reference Wilde and Mungall2005; Hanley, Reference Hanley and Mungall2005).
The Waterberg deposit – PGE transport and deposition
For the Waterberg ores, abundant hematite and missing sulfides appear to rule out transport by thio-complexes; however, the conditions for chloride-complexes as transporting media may be met. McDonald et al. (Reference McDonald, Ohnenstetter, Rowe, Tredoux, Pattrick and Vaughan1999a) inferred that the fluids forming the Waterberg mineralization had relatively low salinities (<5 wt.% NaCl equiv.), were moderately acidic (presence of muscovite; pH 4–5), strongly oxidizing (abundant hematite; high ![]() $f_{{\rm O}_{\rm 2}} $), and that depositional temperatures ranged from 300–200°C. The statements of McDonald et al. (Reference McDonald, Ohnenstetter, Rowe, Tredoux, Pattrick and Vaughan1999a) were largely corroborated by van den Kerkhof and Sosa (Reference van den Kerkhof and Sosa2009) and van den Kerkhof et al. (Reference van den Kerkhof, Sosa, Oberthür, Graupner and Fußwinkel2009) who state that the fluids involved in the deposition of the early, PGE mineralization-related quartz have low salinities (~6 wt.% NaCl eq.) and gaseous components like CO2 or CH4 are absent. Depositional temperatures range from 400°C down to ~280°C, indicating continuous successive pulses of hot fluid infiltration followed by cooling.
$f_{{\rm O}_{\rm 2}} $), and that depositional temperatures ranged from 300–200°C. The statements of McDonald et al. (Reference McDonald, Ohnenstetter, Rowe, Tredoux, Pattrick and Vaughan1999a) were largely corroborated by van den Kerkhof and Sosa (Reference van den Kerkhof and Sosa2009) and van den Kerkhof et al. (Reference van den Kerkhof, Sosa, Oberthür, Graupner and Fußwinkel2009) who state that the fluids involved in the deposition of the early, PGE mineralization-related quartz have low salinities (~6 wt.% NaCl eq.) and gaseous components like CO2 or CH4 are absent. Depositional temperatures range from 400°C down to ~280°C, indicating continuous successive pulses of hot fluid infiltration followed by cooling.
Using the thermodynamic data of Gammons et al. (Reference Gammons, Bloom and Yu1992) for the solubility of Pt and Pd as chloride complexes, McDonald et al. (Reference McDonald, Ohnenstetter, Rowe, Tredoux, Pattrick and Vaughan1999a) calculated solubilities for an ore-forming fluid containing 0.6 wt.% NaCl, at 300°C, and an oxygen fugacity fixed by the Pt/PtO boundary, of 1350 ppm Pt and 500 ppb Pd at pH 4 and 13.5 ppm Pt and 5 ppb Pd at pH 5. Wood (Reference Wood and Cabri2002) supported the deductions of McDonald et al. (Reference McDonald, Ohnenstetter, Rowe, Tredoux, Pattrick and Vaughan1999a) and underlined that significant Pt and Pd can be transported as chloride complexes under the conditions outlined, and that the calculated solubilities are consistent with the Pt-rich nature of the deposit.
McDonald et al. (Reference McDonald, Ohnenstetter, Rowe, Tredoux, Pattrick and Vaughan1999a) identified a close intergrowth relationship of the Waterberg platinum mineralization with a REE-phosphate (‘monazite’) and concluded that the monazite acted as a substrate for Pt deposition and was derived from the mineralizing fluid. REE-phosphates intergrown with Pt are also present our samples, but they are too rare to permit profound comments and too small to allow exact EPMA or in situ dating of this phase. However, instead of hydrothermal monazite [CePO4], described from increasingly more ore deposits in recent studies including Au-PGE mineralization like Serra Pelada in Brazil (e.g. Meireles et al. Reference Meireles, Teixeira and Medeiros Filho1982; Şener et al. Reference Şener, Grainger and Groves2002; Cabral, Reference Cabral2006), the REE-phosphate might also be rhabdophane [CePO4·H2O], a rare mineral reported from a number of hydrothermal ore deposits (e.g. Anthony et al., Reference Anthony, Bideaux, Bladh and Nichols2000). Further micro-analytic work is needed to unravel the mineralogy and age of the REE-phosphate(s) associated with the PGE mineralization.
The observed quartz and ore textures like botryoidal growth, roundish to globular or verruciform grains of native platinum and Pt–Pd alloys occurring as garlands or cockades, and smaller grains occasionally forming emulsion-like textures already led Wagner (Reference Wagner1929a) to suggest that the platinum was transported in a colloidal form and was deposited as a gel. Ore microscopic work corroborated this suggestion and Ramdohr (op. cit. above) underlines that the platinum mineralization “surely” possesses “a gel nature”. In fact, the potential transport of Pt, Pd and Au as colloids (Pt0, Pd0, Au0) cannot be ruled out also in view of the deductions of Herrington and Wilkinson (Reference Herrington and Wilkinson1993) who indicated the possibility of initial precipitation of amorphous silica and colloidal gold followed by quartz overgrowths in mesothermal gold deposits. The observation (Oberthür et al., Reference Oberthür, Blenkinsop, Hein, Höppner, Höhndorf and Weiser2000) of disseminated, fine-grained, roundish to drop-like emulsion-like gold in chert-like quartz of Stori's Golden Shaft mine in Zimbabwe (Stori's reef) supports the hypothesis of Herrington and Wilkinson (Reference Herrington and Wilkinson1993) and might be extended to hydrothermal PGE deposits. In general, however, it must be stated that experimental work on the transport and deposition of PGE under hydrothermal conditions is insufficient to fully explain the unique, puzzling features of the Waterberg mineralization.
The Waterberg deposit – Pt–Pd–Au proportions
As described above, hydrothermal PGE-carrying ores are in general characterized by Au>Pd>Pt. In the economically most important magmatic, sulfide-controlled PGE ores, Pt/Pd ratios are mainly <1 or close to unity and element proportions are Pd≥Pt>Au (e.g. Maier, Reference Maier2005). Notably, the Merensky Reef of the whole Bushveld Complex and the UG-2 chromitite of the western Bushveld have Pt/Pd ratios close to 2, whereas this ratio is close to unity in the Platreef (e.g. Maier, Reference Maier2005). PGE mineralization with extremely high Pt/Pd ratios are all related to low-temperature formation in aqueous environments. Examples are (1) manganese nodules and crusts formed in the marine environment on the ocean floor (e.g. Balaram et al., Reference Balaram, Ramavati Mathur, Banakar, Hein, Rao, Gnaneswara Rao and Dasaram2006; Banakar et al., Reference Banakar, Hein, Rajani and Chodankar2007); (2) Mo–Ni–PGE black shale ores of China (Mao et al., Reference Mao, Lehmann, Du, Zhang, Ma, Wand, Zeng and Kerrich2002; Pašava et al., Reference Pašava, Zaccarini, Aiglsperger and Vymazalová2013) thought to have formed from evaporating sea water; (3) secondary oxide ores produced by weathering of primary mineralization (e.g. Great Dyke; Locmelis et al., Reference Locmelis, Melcher and Oberthür2010; Oberthür et al., Reference Oberthür, Weiser, Melcher, Gast and Wöhrl2013); and (4) placers (e.g. Weiser, Reference Weiser and Cabri2002, Reference Weiser2004; Oberthür et al., Reference Oberthür, Melcher, Goldmann, Wotruba, Dijkstra, Gerdes and Dale2016).
The Waterberg ores are unique due to their specific noble metal proportions (Pt>Pd>Au). These inter metal relationships may be related to the source of the metals, or to the physicochemical conditions of dissolution, transport and deposition by hydrothermal solutions. McDonald et al. (Reference McDonald, Ohnenstetter, Rowe, Tredoux, Pattrick and Vaughan1999a) put forward an unconventional concept, an oxidized fluid evolution model, by applying the thermodynamic data of Gammons et al. (Reference Gammons, Bloom and Yu1992) and by approximating the physicochemical conditions of the Waterberg mineralization considering mineralogical and chemical evidence. McDonald et al. (Reference McDonald, Ohnenstetter, Rowe, Tredoux, Pattrick and Vaughan1999a) calculated solubilities for an ore-forming fluid containing 0.6 wt.% NaCl, at 300°C, and an oxygen fugacity fixed by the Pt/PtO boundary, of 1350 ppm Pt and 500 ppb Pd at pH 4 and 13.5 ppm Pt and 5 ppb Pd at pH 5. Under the assumed conditions above, Pt has a higher solubility than Pd. If there is increasing pH during fluid evolution, Pd (and Au) might precipitate earlier resulting in a continuous increase of the Pt/Pd ratio in the evolving fluid leading to the formation of ores with a highly Pt-rich mineral assemblage at later stages (McDonald et al., Reference McDonald, Tredoux and Vaughan1995, Reference McDonald, Ohnenstetter, Rowe, Tredoux, Pattrick and Vaughan1999a). If so, this would imply that the Waterberg mineralization might be zoned, with more Pd-rich ores at depth and Pt-rich mineralization in the upper parts. Proof of this model would need the reopening of the mine or drilling.
We believe it is logical that the source of the metals in the Waterberg case are the rock and ore sequences of the Bushveld Complex. Notably, both the economic Merensky Reef and the UG-2 chromitite south of the TML have elevated Pt/Pd ratios of ~2 (Pt>Pd>Au) and therefore, would produce more Pt-rich fluids than most other source rocks in case of bulk extraction and subordinate metal fractionation by the transporting fluid. In general, however, we are led to conclude that the unique metal budget of the Waterberg mineralization still needs a satisfactory explanation.
The Waterberg deposit – sources of the PGE
Regarding the source of the PGE, Armitage et al. (Reference Armitage, McDonald and Tredoux2007) remark that the Main Lode of the Waterberg Platinum mine parallels the larger and even at the present time geothermally active Welgevonden fault which may be an extension of the Planknek–Ysterberg fault system that cuts mafic rocks of the Bushveld Complex south of Mokopane. Armitage et al. (Reference Armitage, McDonald and Tredoux2007) propose that the PGE could have been derived from slivers of PGE-rich reefs that were displaced along the fault zone to a position below the Main Lode, or via fluids that leached PGE from source rocks close to Mokopane and then travelled along the fault zone to deposit platinum and other metals in the Main Lode. Holwell et al. (Reference Holwell, Adeyemi, Ward, Smith, Graham, McDonald and Smith2017) extended this model by proposing the formation of an intermediate hydrothermal Ni–Pt–Pd deposit first that was remobilized at a later stage with further fractionation of Pt from Pd and the base metals to form the Pt-rich Waterberg veins. Notably, a suggestion similar to that of Armitage et al. (Reference Armitage, McDonald and Tredoux2007) was first made by Mertie (Reference Mertie1969, p. 44), and we concur with the above authors in principle, but would like to extend the source area leached by the fluids to possible unexposed Bushveld rocks towards the south of the deposit. The mineralizing ±400°C hot fluids may have travelled tens of kilometres, allowing access to this region of the Bushveld.
The Welgevonden fault is related to the Thabazimbi-Murchison-Lineament (TML; Fig. 1), a major crustal suture zone and long-living fault system that has been periodically reactivated since the mid-Archean (Good and De Wit, Reference Good and De Wit1997; McDonald and Tredoux, Reference McDonald and Tredoux2005). The TML has also been implicated as a major feeder for the Bushveld magma (Eales et al., Reference Eales, Field, De Klerk and Scoon1988; Maier and Eales, Reference Maier and Eales1994; Kruger, Reference Kruger2005). Mafic rocks of the Bushveld Complex may be present below or geographically proximate to the Waterberg deposit, and TML-related structures can provide passageways for hydrothermal fluids. Therefore, leaching of Pt–Pd–Au from platiniferous Bushveld rocks or ores by hydrothermal solutions and their transport to the Waterberg depositional site is a probable scenario. The question remains whether more Waterberg-type deposits can be found in and around the Bushveld Complex. A prime target area would be along the TML where geothermal springs are still active at the present time.
Summary and conclusions
The Waterberg deposit is a fault-bound hydrothermal quartz-hematite-PGE vein deposit. The ore-bearing quartz veins often show reniform or verruciform banding, and multiple fine layers indicate numerous consecutive pulses of fluid infiltration. The PGE mineralization was introduced contemporaneously with the earliest generation of vein quartz and hematite.
Hematite is the predominating opaque mineral (up to 10 vol.%), and sulfides are virtually lacking, indicating high oxygen and low sulfur fugacities of the mineralizing fluid.
The PGM assemblage reflects three main depositional and alteration events, namely (1) deposition of native Pt, Pt–Pd alloys (together >90% of the PGM assemblage) and Pd–Sb–As compounds from hydrothermal fluids concomitant with early quartz and hematite, followed by (2) local hydrothermal alteration of native Pt by Cu-rich fluids leading to the formation of Pt–Cu alloys and hongshiite [PtCu]; and finally (3) formation of Pd/Pt-oxides/hydroxides, mainly by replacement of Pd–Sb–As compounds in the course of weathering/oxidation of the ores.
We concur with McDonald et al. (Reference McDonald, Ohnenstetter, Rowe, Tredoux, Pattrick and Vaughan1999a) and Van der Kerkhof et al. (Reference van den Kerkhof, Sosa, Oberthür, Graupner and Fußwinkel2009) who inferred that PGE transport was probably facilitated by chloride complexes, that the fluids had relatively low salinities, were moderately acidic and strongly oxidizing, and that depositional temperatures were in the range 400–200°C.
Alternatively, the observed quartz and ore textures like botryoidal growth, roundish to globular or verruciform grains of native platinum and Pt–Pd alloys occurring as garlands or cockades, and smaller grains occasionally forming emulsion-like textures may hint to the possibility that Pt and Pd were transported in a colloidal form and were deposited as gels, as already proposed by Wagner (Reference Wagner1929a).
The hydrothermal Pt–Pd mineralization of the ‘Waterberg type’ is characterized by unique metal proportions, namely Pt>Pd>Au. These may either be interpreted as a fingerprint of the cradle of the metals, viz. mafic/ultramafic rock and ore sequences of the Bushveld Complex, or reflect an oxidized, evolving fluid which precipitated ores with a highly Pt-rich mineral assemblage (McDonald et al., Reference McDonald, Tredoux and Vaughan1995, Reference McDonald, Ohnenstetter, Rowe, Tredoux, Pattrick and Vaughan1999a).
As suggested by Armitage et al. (Reference Armitage, McDonald and Tredoux2007), leaching of Pt–Pd–Au from platiniferous Bushveld rocks by hydrothermal solutions and their transport through TML-related fault systems to the Waterberg depositional site is the most probable scenario regarding the source of the PGE. If so, further Waterberg-type deposits might be present in and around the Bushveld Complex, and a prime target area would be along the corridor of the TML where geothermal springs are still active today.
Acknowledgements
We are grateful to Marian Tredoux, Professor at the Department of Geology, University of the Free State, Bloemfontein, South Africa, who competently guided us at the location of the former Waterberg Platinum Mine in 2009. Meike Peters and Tobias Just conducted mineralogical and geochemical work on some samples and polished sections and provided valuable details of the mineralization. Most of the samples studied were obtained from museum collections including the collections of E. Reuning for the Museum für Naturkunde in Berlin (curator Dr. Ralf Thomas Schmitt – sample Wat-C is MFN_MIN_2014_04658 now) and P. Ramdohr at the University of Heidelberg (curator Dr. Michael Hanel). Further samples were loans from the Natural History Museum in London (BM 1985, MI15578), the Council for Geoscience in Pretoria, and the University of Cape Town, South Africa. Thanks to the colleagues at the BGR where Detlev Klosa and Christian Wöhrl performed the SEM studies, and Jerzy Lodziak conducted the microprobe analyses. Thoughtful and constructive inputs by the reviewers Louis J. Cabri and Iain McDonald are acknowledged with thanks.


