Introduction
Scientific interest in the potential effects of climate change on the polar regions has increased since computer simulations have shown that high latitudes are likely to experience enhanced warming. The response of sea-ice regions to a projected wanning has been of particular interest. To decide how snowmelt on the sea ice responds to climate variations, surface snowmelt must be examined. This project is a new-approach to determine the date of snowmelt onset for the Arctic sea-ice region using passive-microwave data from the Special Sensor Microwave Imager (SSM/I) platform. Previous work has shown strong variations in the date of the onset of snowmelt on sea ice from passive-microwave remote sensing (Reference AndersonAnderson, 1987a, Reference Andersonb; Reference Anderson, Crane and BarryAnderson and others, 1985) for different locations and from year-to-year. More-recent research using similar passive-microwave techniques on the Greenland ice sheet has determined variations in the data of melt onset and spatial coverage of the melting snow cover (Reference Abdalati and SteffenAbdalati and Steffen, 1995; Reference Mote and AndersonMote and Anderson, 1995). Results from these studies are used here to produce a new algorithm that detects the onset date of snowmelt on sea ice. This is possible because of the large increase in emissivity that occurs when liquid water is present in the snowpack. The algorithm is suited for the entire Arctic Basin since it works regardless of ice type (ice type was found to be an important factor in detecting melt). Melt onset is correlated with albedo changes. A better understanding of the albedo changes during the early spring and summer will allow computer models to give better estimates for surface energy balances.
Algorithm Development
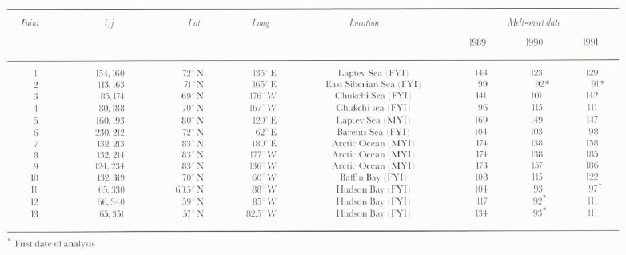
Several locations in the Arctic Basin, including first-year and multi-year ice regions (Table 1) were used to develop an algorithm that would represent the onset date of snowmelt. These locations are the same as those used in previous research (Reference Anderson, Crane and BarryAnderson and others, 1985; Reference AndersonAnderson, 1987a, Reference Andersonb) allowing comparison with prior results. To develop an algorithm, SSM/I passive-microwave brightness temperature (TB) data were obtained from the National Snow and Ice Data Center (NSIDC). These data are gridded into 25 × 25 km gridcells and archived on CD-ROM. In the development of the algorithm, time series of the TB were analyzed, although an algorithm was not developed solely using an individual passive-microwave channel. For example, the algorithm that detects melt onset on the Greenland ice sheet using a 37 GHz horizontal TB threshold technique (Reference Mote and AndersonMote and Anderson, 1995), could not be used because sea-ice TBs vary too much due to the presence of different ice types and Open water. In contrast, on the Greenland ice sheet, the snow cover is thick enough that TB signatures are of snow only, and do not reflect the underlying surface.
Table 1. Location sites and melt-onset dates
Time series of total ice (TI) and multi-year ice fraction (MYI), calculated using the NASA Team Algorithm (Reference Cavalieri, Gloerson and CampbellCavalieri and others, 1984), were also examined to detect the onset of melt. As previous research has shown (Reference Anderson, Crane and BarryAnderson and others, 1985; Reference AndersonAnderson, 1987a, Reference Andersonb) monitoring these parameters gives an indication of melt-onset dates. However, advection of different ice types into the location might give similar results. Therefore, use of TI and MYI would help define melt onset, but could not be used in a new algorithm.
Several different published ratios, as well as a new ratio, were calculated to assist in detecting the melt-onset date. For example, the polarization ratio (PR) and gradient ratio (GR) from the NASA learn sea-ice-concentration algorithm (Reference Cavalieri, Gloerson and CampbellCavalieri and others, 1984) were examined. The expressions for PR and GR are:


Analysis of the PR and GR time series showed that these ratios were sea-ice-type dependent In addition, crossthe cross polarization gradient ratio (XPGR) used by Abdalati and Steffen (1995) to show melt on the Greenland ice sheet was also investigated. The XPGR is defined by:

The XPGR reduces the dependence of the spatial variability of physical temperatures compared to the single-channel approach of Reference Mote and AndersonMote and Anderson (1995). However, the XPGR algorithm, when applied to sea ice, was also found to be ice-type dependent. These factors were determined to be important deficiencies: therefore these ratio algorithms were not pursued in the new algorithm development. Another ratio was calculated using the difference between the horizontal channels 37 and 19 GHz (XHGR) given by:

Similar results were found for the XHGR as were observed with the XPGR algorithm: the XHGR was dependent on ice type.
For all of these passive-microwave methods, it was fairly easy to determine visually the onset of melt because the parameters would start behaving differently. A threshold value for each technique could be set that determined melt onset, allowing the process to be automated. However, the problem with these techniques and their thresholds was that sea-ice type was needed to determine the direction of the parameter change.
The original TB time series were scrutinized further to determine whether other relationships could be observed in the data that might suggest the melt onset and not be dependent on the sea-ice type. A new melt algorithm using the difference between the 19 GHz and 37 GHz horizontally polarized channel (HG algorithm) was generated and is given by the following:
The horizontal channels reflect a strong dependence on snow conditions during melt. Rapid changes in snow conditions are observed in the TB. During melt conditions, the TB first increase from liquid water within the snowpack, then a decrease occurs because of freeze/thaw cycles increasing the snow grain-size i.e. Reference MätzlerMätzler, 1987: Reference Onstott, Grenfell, Mätzler, Luther and SvendsenOnstott and others, 1987), allowing the HG algorithm to detect these variations.
A single threshold value was determined by examining regions in the Arctic Basin (Table 1) for three years (1989–91) when the HG algorithm exhibited a change in the TB. Time series of the TB, TI and MYI concentrations, various ratios and the HG algorithm were analyzed for all sites. However, only two locations representing different ice types will be discussed. These two sites were chosen because they represent locations where variations with the algorithm existed and could be analyzed, compared to other sites where the algorithm was more consistent in determining the melt-onset date.
The first location is a first-year-ice region located in the Laptev Sea. The three time series for this location show general trends in TB and ice concentrations that would be expected during the late-winter through summer for a first-year-ice region (Figs 1–3). The TB for all four channels (19 H, and 37 H,V) average about 250 K during the winter period, with little separation between horizontal and vertical channels. After a spring/summer melt period where TBs vary greatly, the temperatures are indicative of open-water conditions (i.e. Reference Cavalieri, Gloerson and CampbellCavalieri and others, 1984). This is observed in all three years, though large variations take place in the timing of the inch periods. The ice concentrations and ratios also exhibit variations during the melt period. The HG algorithm shows that during the winter period before melt takes place, the difference between the 19 and 37 GHz channels is fairly consistent between 4–7K. Once melt takes place, the variations in the difference become quite large. However, in all three years the initial change was to increase the 37 H GHz TBs, resulting in a decrease in the HG values.
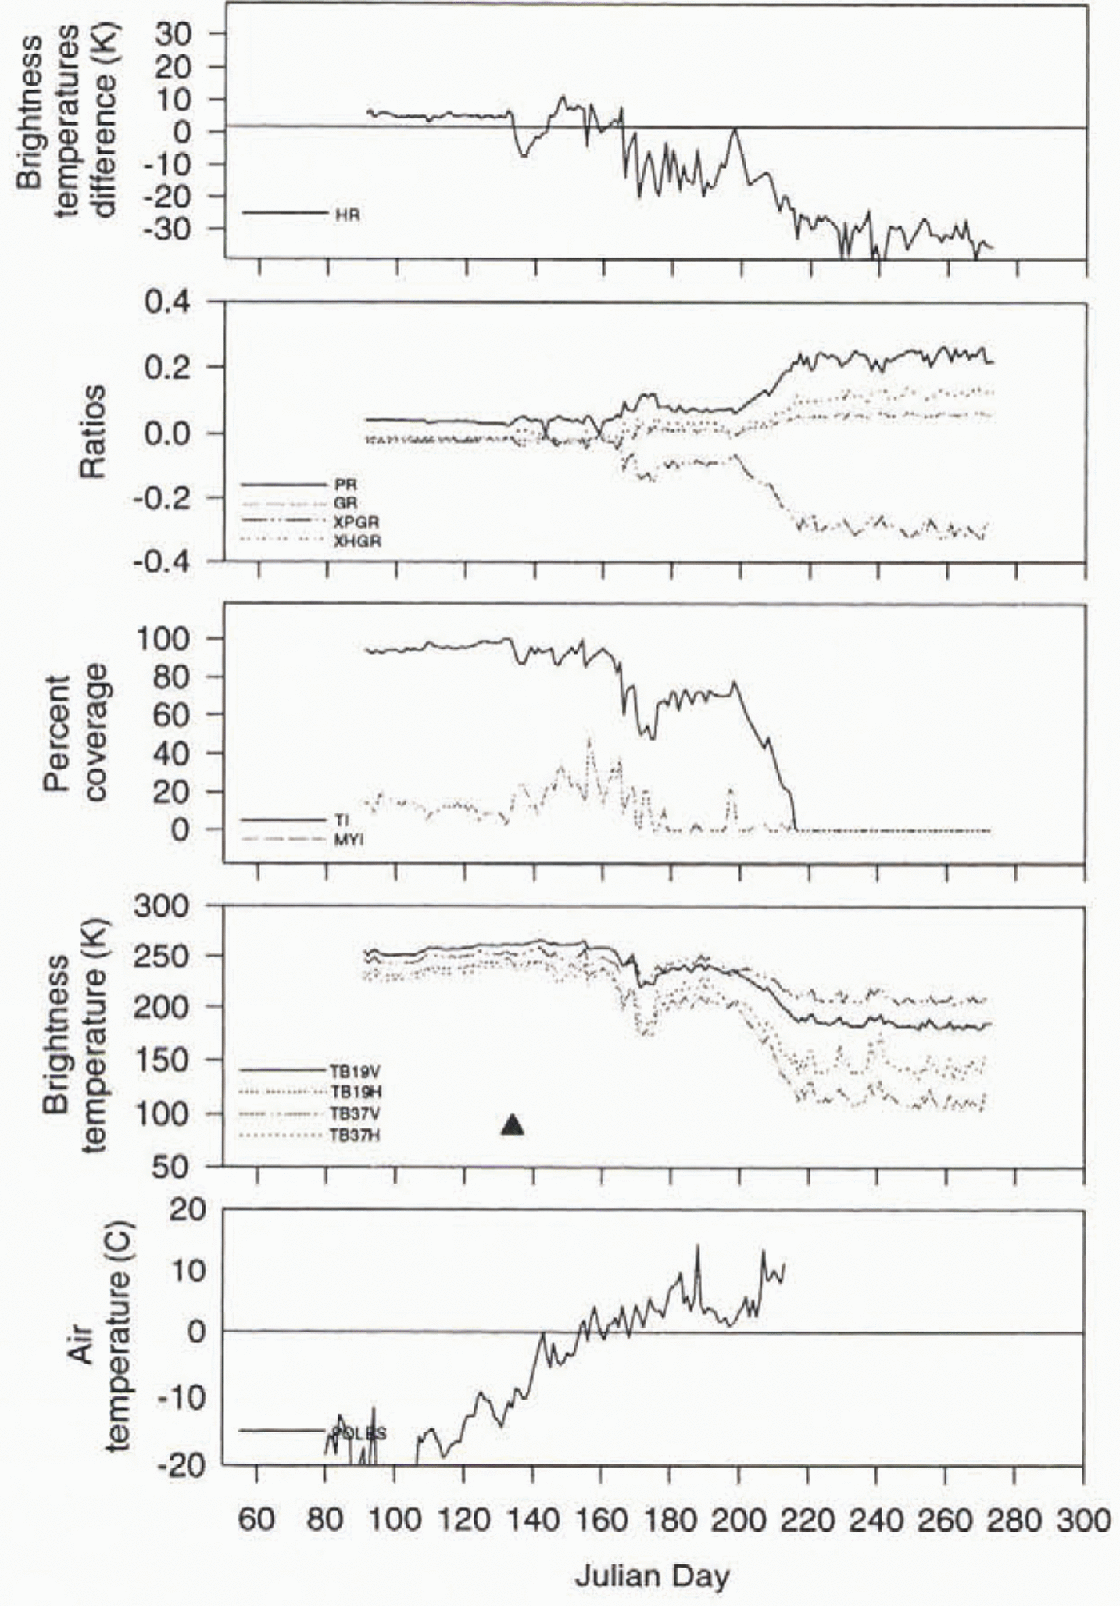
Fig. 1. Time-series analysis for a first-year-ice location in the Laptev Sea (72°N, 135°E) for 1989. The triangle represents the onset of melt as detected by the HR melt algorithm.
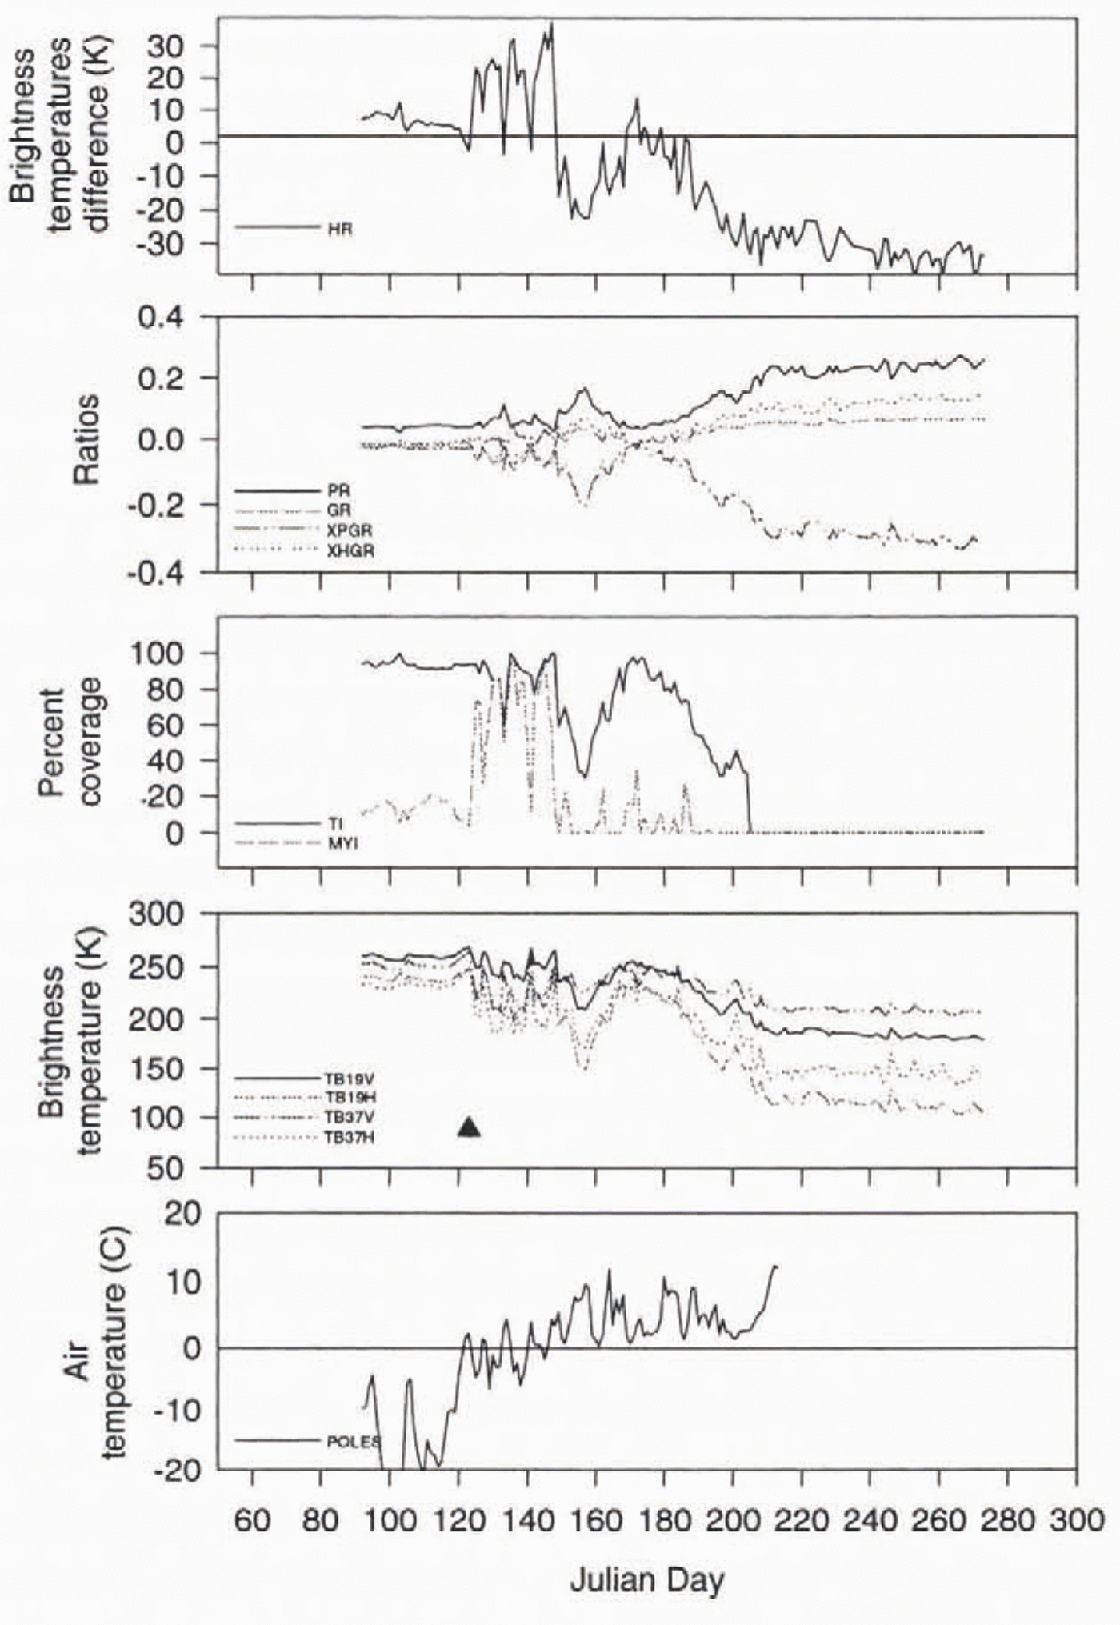
Fig. 2. Time-series analysis for a first-year-ice location in the Laptev Sea (72°N, 135°E) for 1990. The triangle represents the onset of melt as detected by the HR melt algorithm.
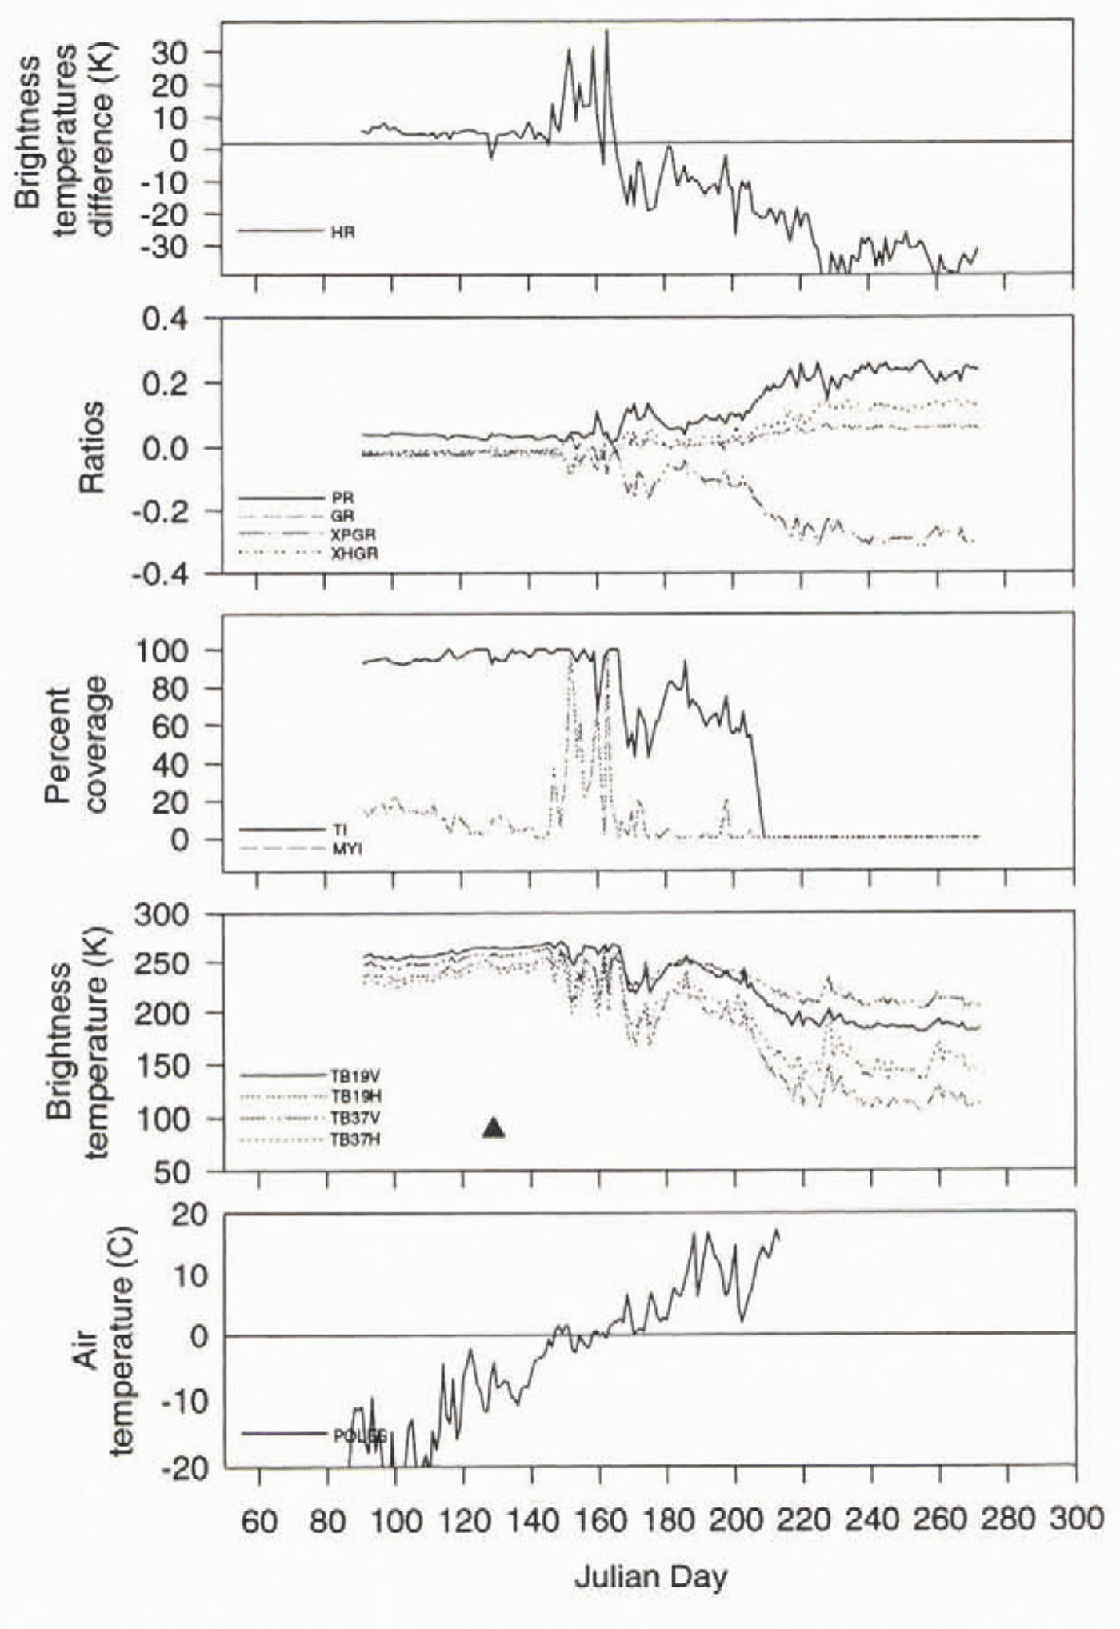
Fig. 3. Time-series analysis for a first-year-ice location in the Laptev Sea (72°N, 135°E) for 1991. Ihe triangle represents the onset of melt as detected by the HR melt algorithm.
Similar patterns were found for multi-year ice locations. For discussion purposes, one site only will be presented, although others were analyzed. The site, a multi-year-ice location found in the central Arctic Ocean (Table 1), also exhibits general seasonal trends in the parameters for the three years (Figs 4–6). The TBs exhibit three distinct periods: winter conditions with generally consistent temperatures; a melt period where large variations are observed; and summer conditions followed by winter conditions. The multi-year-ice concentrations and various ratios (PR, GR, XPGR and XHGR) also exhibit fluctuations during the melt period. The HG algorithm also shows variations in the TB difference taking place during melt. The HG temperature variations are larger than the ones observed for the first-year-ice regions (Figs 1–3).
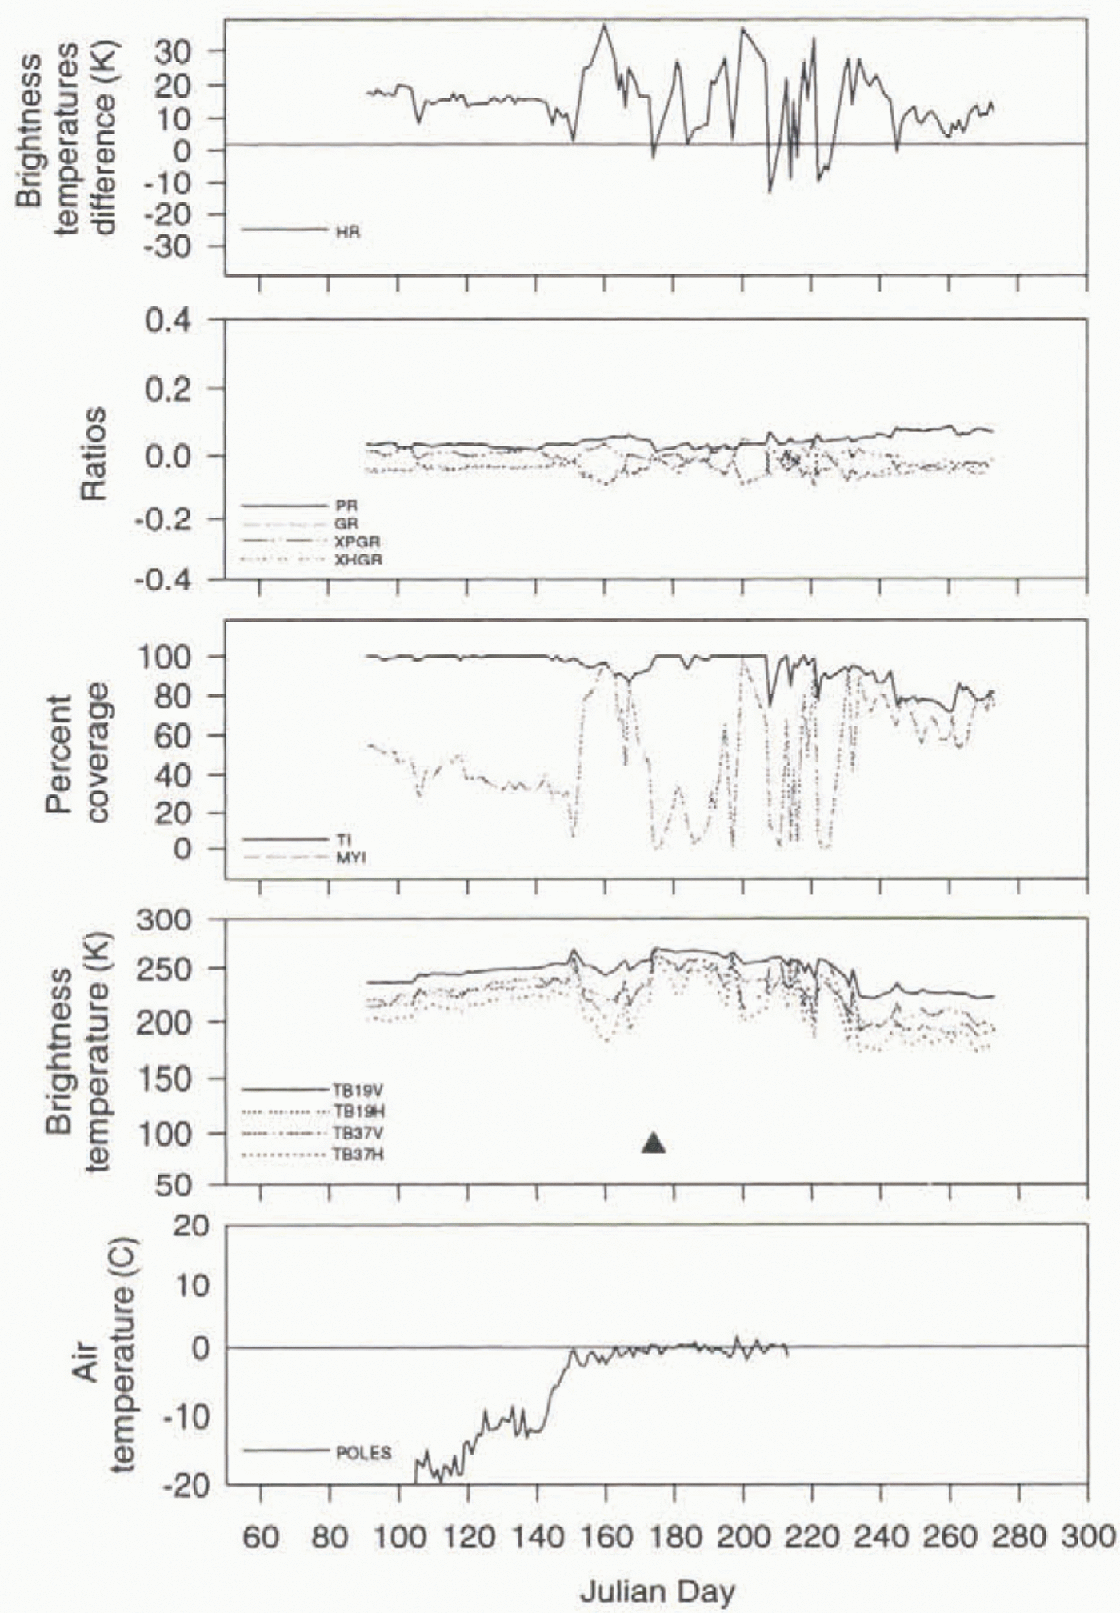
Fig. 4. Time series analysis for a multi-year-ice location in the central Arctic Ocean (83°N, 180°W) for 1989. The triangle represents the onset of melt as detected by the HR melt algorithm.
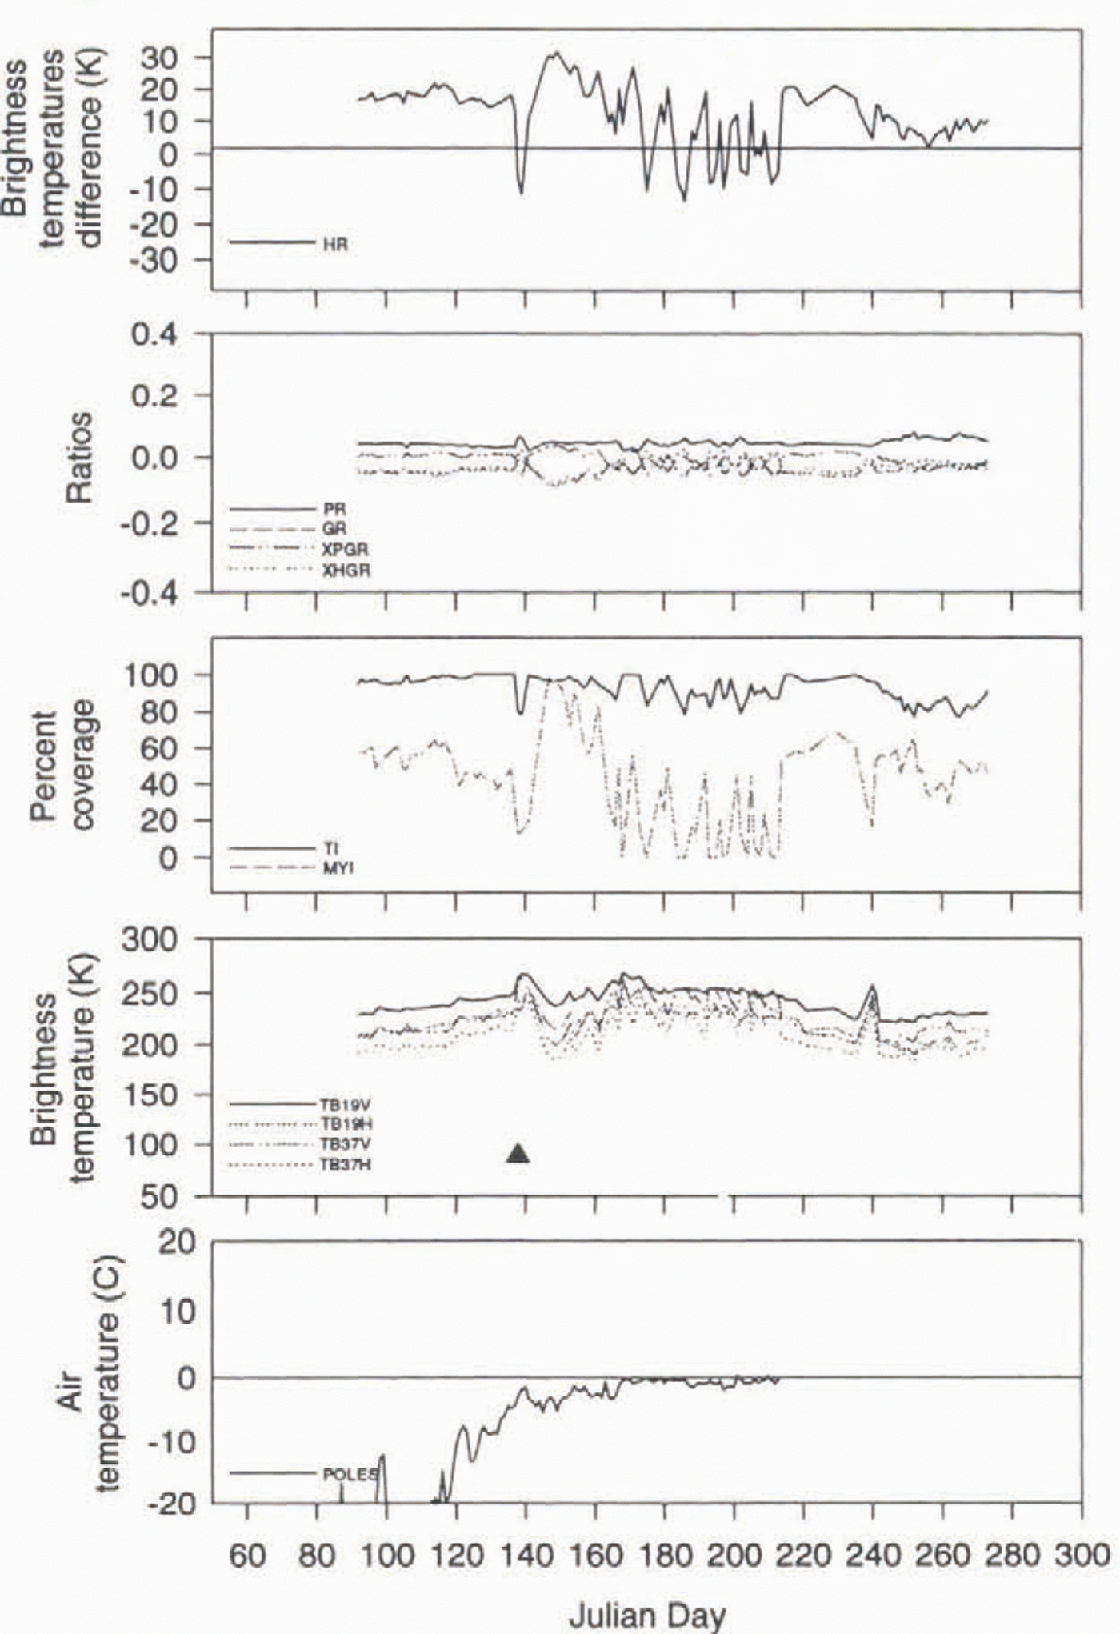
Fig. 5. Time-series analysis for a multi-year-ice location in the central Arctic Ocean (83°N, 180°W) for 1990. The triangle represents the onset of melt as detected by the HR melt algorithm.
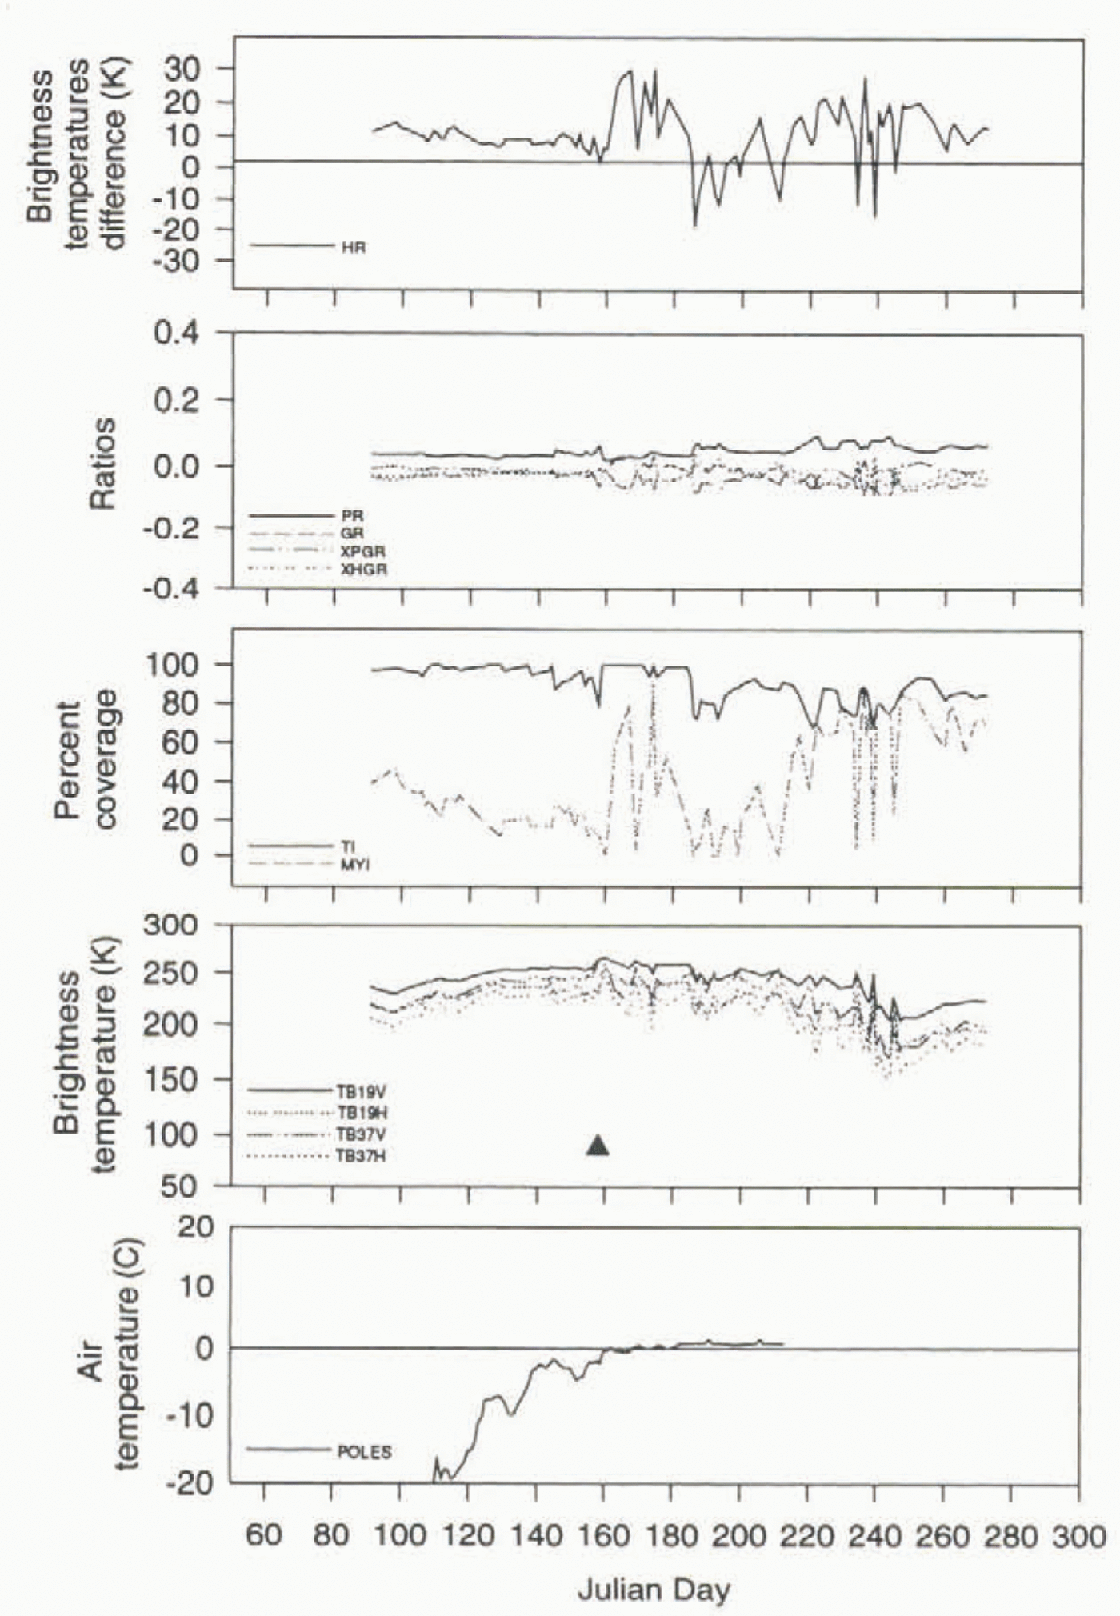
Fig. 6. Time-series analysis for a multi-year-ice location in the central Arctic Ocean (83°N, 180°W) for 1991. The triangle represents the onset of melt as detected by the HR melt algorithm.
Using all sites (Table 1) it was
determined that a melt threshold would be assigned when the HG
was
![]() with ice concentrations >15%. When snowmelt takes place
the snow cover should become nearly a perfect black-body emitter and the
difference between the 19 and 37 GHz channels should be very small. A 2 K
threshold was chosen because of the large SSM/I grid size and inhomogeneities
within any grid.
with ice concentrations >15%. When snowmelt takes place
the snow cover should become nearly a perfect black-body emitter and the
difference between the 19 and 37 GHz channels should be very small. A 2 K
threshold was chosen because of the large SSM/I grid size and inhomogeneities
within any grid.
To help determine whether the HG algorithm is detecting the onset of melt, air temperatures have been obtained from the Polar Exchange at the Sea Surface (POLES) data set. The POLES temperature data are derived from Arctic buoy data, AVHRR surface temperatures and land observations and averaged over a 21 hour period to correspond to the microwave data. When comparing the HG algorithm’s determination of the melt-onset date with the nearest gridpoint of the POLES temperature data, there is a Strong association. The HG algorithm indicates melt onset when the POLES data approach or reach the freezing point figs 1–6). The best relationships between the air temperature and the HG algorithm are for the multi-year-ice location. It should be noted that multi-year-ice locations might be better depicted by the POLES data because of the way the air temperatures are generated: the POLES data are a combination of buoy, satellite and land surface observations. POLES temperatures are not as reliable for first-year-ice regions, generally located along the coastline, since land-surface temperature observations included in the calculation may not be representative of sea-ice conditions . personal communication from J. Maslanik, 1996).
Generally speaking, whenever a global threshold is applied to a dataset, there will be times and locations when a single threshold will not represent all situations. For example, at the first-year-ice location discussed (Figs 1–3) the HG threshold captures the start of the melt period two out of the three years (1990 and 1991). In the third year (1989), the HG algorithm indicates the melt onset while the temperatures are still well below freezing. However, there is an increase in the POLES temperature during that period, although the air temperatures do not approach the freezing point as closely as in the other years. In 1991, the HG algorithm produces a melt onset that appears too early. The algorithm indicates melt, but the other microwave parameters do not display inch characteristics until later. The POLES air temperatures show a fairly strong increase during that time period, although they are still below freezing. The discrepancies between the HG algorithm and the POLES air temperatures may be in the way the air temperatures are calculated, not representing sea-ice conditions.
The HG algorithm also captures melt two out of three years for the multi-year site (Figs 4–6) compared to the POLES air temperatures. In this case, an earlier melt onset is missed in 1989 by the HG algorithm. The time series in 1989 shows a distinct melt event that the HG temperature difference did not meet or exceed the chosen threshold while air temperatures are very close to freezing. In the other two years, the HG algorithm indicates the melt onset when the air temperatures would also indicate melting in the snowpack.
To determine if these missed years could be detected better by the HG algorithm, the HG melt threshold was varied. If the threshold was increased (raised to 3 and then 4K) the first-year-ice locations usually showed earlier melt-onset dates to the order of several weeks to months, although melt conditions were not observed in the other microwave parameters and considered not to have taken place. The earlier melt-onset dates were indicated by the HG algorithm because first-year-ice regions usually varied between 3 to 7 K throughout the winter. Increasing the threshold docs not differentiate melt occurrences from winter conditions at the first-year-ice location. When the HG threshold was increased for the multi-year-ice location, an earlier melt date was also indicated, but only in 1989 (Fig. 1). In this case, the earlier melt-onset date was probably justified. the HG threshold was also decreased (1K) to determine a lower sensitivity. Very little variation was observed in the melt-onset dates for the sites analyzed compared lo the 2 K values since the 37 H GHz TBs were observed to become larger than the 19 H GHz TBs during melt episodes, producing a negative HG value. If there was a difference in onset date, the onset date was usually delayed only a day or two, In summary, increasing the threshold mainly affected first-year regions in a negative manner, although it might slightly benefit the multi-year location. Decreasing the threshold had little effect on onset dates for either ice-type location. Therefore, to maintain a global threshold independent of ice type, the 2 K threshold was retained.
Using the 2 K threshold, dates of initial melt onset for the entire Arctic Basin were produced from the three year dataset by the HG algorithm to show the spatial distribution of melt (Fig. 7). Several generalizations can be made from this analysis. The first shows the substantial nature of the algorithm. In each year, the melt-onset dates are spatially consistent, and show the poleward progression of melt taking place from the southern first-year-ice locations to later multi-year locations. However, linear features were observed for several locations among the years analyzed. These were further explored to determine a cause for the linear nature of the dates. For example, one of these features is located along the 135th meridian from the pole to the coast in 1991 (Fig 7c). At several locations along this linear feature, perpendicular transects were made to analyze the melt-onset dates and their TB time series.
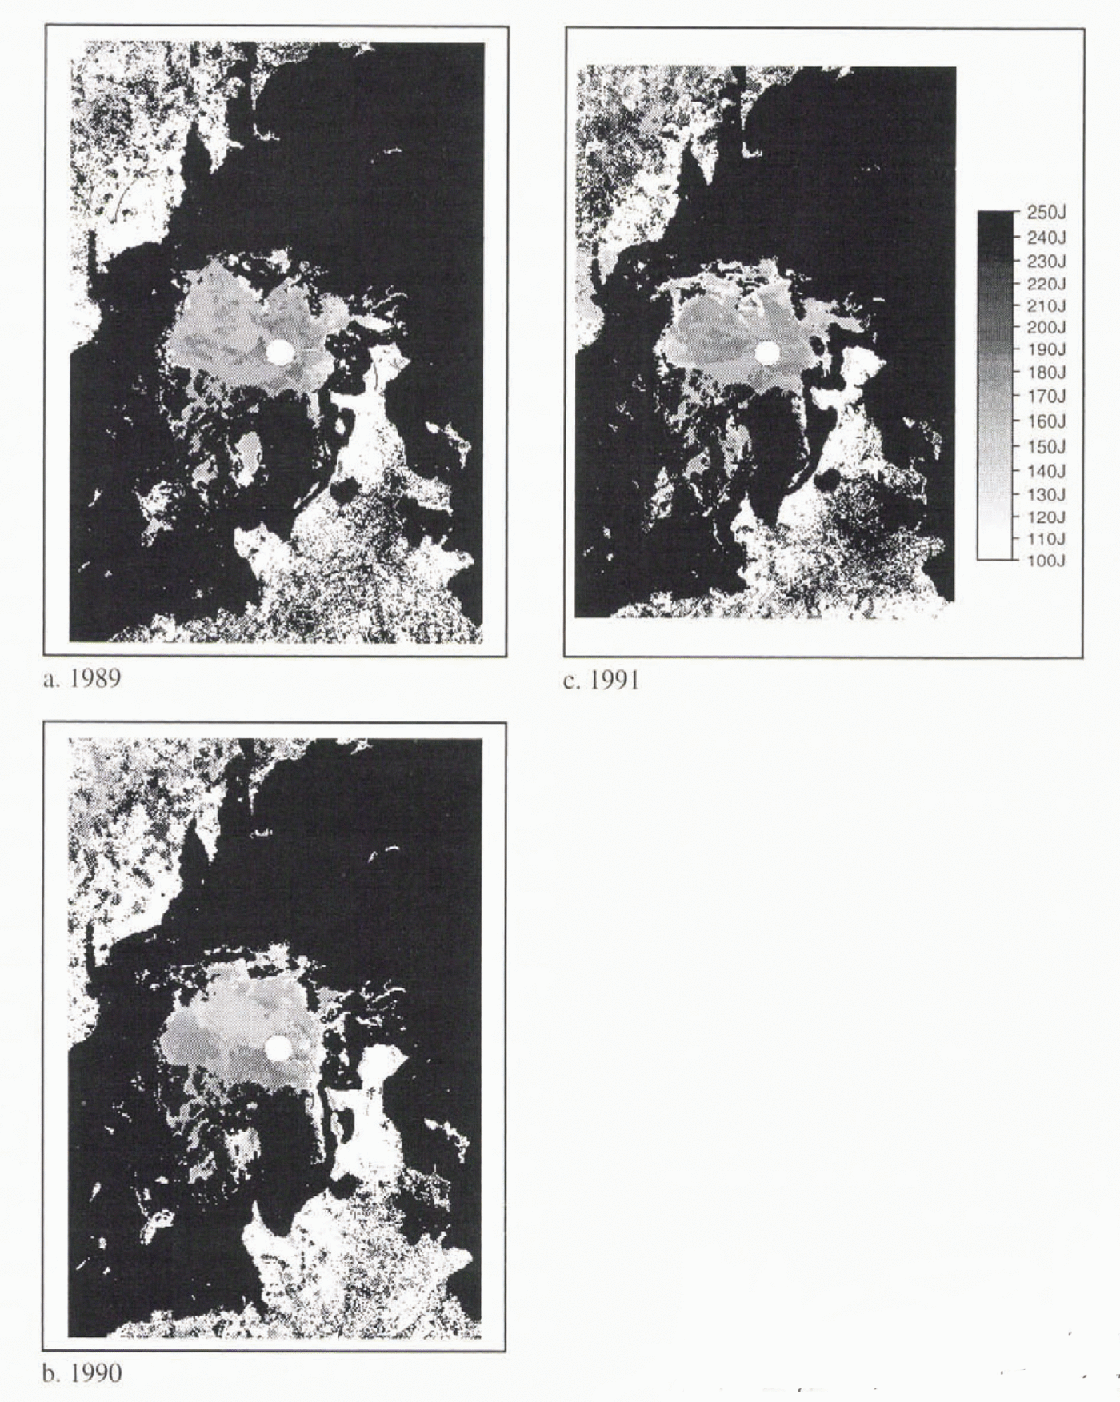
Fig. 7. Initial melt-onset dates as delected by the HR melt algorithm for (a) HR melt algorithm for (a) 1989, (b) 1990 and (c) 1991.
Examining the gridcells on either side of the linear feature, it was easy to determine why the feature existed. The gridcells to the west of the feature (later onset dates) exhibited changes in the TBs but these did not surpass the HG threshold criteria. It was not due to missing data, but to the region not meeting the HG threshold. Similar situations were found for the Other years examined. the other major generalization would be that the HG algorithm is consistent from year-to-year in its determination of melt-onset dates for the entire Arctic Basin. There are small variations within regions between the years analyzed, but this would be expected.
The spatial analysis also demonstrates, however, that at many locations in the ocean region that do not have an ice cover, the algorithm still analyzed a melt date. These points, usually south of 60° need to be filtered and removed from the dataset. It was originally thought that these points were removed through weather filters applied to the concentration dataset before the HG algorithm was applied. However, the spatial analysis gives a different picture. New fillers will have to be developed and applied to ensure an accurate melt dataset in open-ocean regions.
To show that the variation in the threshold was mainly a first-year-ice problem and not a result of the initial locations investigated, spatial maps of the Arctic Basin were produced using the different threshold values for the three years studied. Fhe first-year-ice region onset dates were generally the most affected by the variation in the threshold value. In summary, using a global threshold value will not always give the most accurate response for all locations. However, using the 2 K threshold appears to be the best value for the entire Arctic Basin.
Melt-onset Variability
To show the Capabilities of the melt algorithm to produce a melt climatology, the two example sites will be further discussed, although other locations have been investigated (Table 1). Again, these sites were chosen because they represent both first-year and multi-year ice conditions. The analysis was completed for 1989–91. The HG algorithm determined that the initial melt occurred between Julian Days 123–134 for the three years (Table 1; Figs 1–3), an 11 day variation.
The time series for the first-year-ice location, found in the central Arctic Ocean (Table 1), shows similar results (Figs 4–6). The initial melt occurrences showed a greater range than at the first-year-ice location. The HG algorithm indicated that melt occurred between julian day 138 and 174, a 36 day variation among the three years analyzed.
It can be assumed that the actual range in dates among years for most locations is relatively small, although variations do exist. Again, this would enhance the current thinking that melt occurrence in the Arctic Basin is mainly regulated by the radiational changes that take place in the Arctic throughout the spring period. However, the variations in initial date for each location are going to be driven by local annual variations controlling the amounl of solar radiation received and the atmospheric sensible heat adverted into the region to initiate melt.
Summary
A study was launched lo develop a new melt algorithm that would detect the onset of melt for the entire Arctic sea-ice basin with no dependence on ice type. The HG melt algorithm developed produces initial melt-onset dates when the sea-ice snowpack begins to show melt in the passive-microwave remotely sensed data. The melt algorithm was then applied to three years of data to show the nature of the algorithm for different ice-type locations. The results from this investigation show that the entire passive-microwave TB dataset can be analyzed to produce a melt-onset date climatology. The climatology can be derived from passive microwave TBs from SMMR and other SSM/I platforms. Once the climatology is produced, a more complete understanding of the relationships between atmospheric effects and ice conditions, especially considering modeled climate variations, can be investigated.
Acknowledgements
I would like to thank the two anonymous reviewers for their helpful suggestions and comments. I would also like to thank J. Maslanik for supplying the 24 hour averaged POLES temperature data. The original POLES data were obtained from the Polar Science Center, University of Washington, Seattle, WA. The SSM/I gridded-brightness temperatures obtained on CD-ROM were from the National Snow and Ice Data Center, Boulder. CO. This work was supported at the University of Nebraska by NASA grant NAGW-1266 and by NASA contract NAS-5-32392 to the University of Colorado.


