


Intelligence, often simply referred to as g (Spearman, Reference Spearman1904), general cognitive ability or general cognitive function (Davies et al., Reference Davies, Armstrong, Bis, Bressler, Chouraki, Giddaluru and Deary2015), describes the variance that is shared between different tests of cognitive function. This shared variance explains approximately 40% of the variation between individuals’ scores on tests of cognitive function (Carroll, Reference Carroll1993). Intelligence predicts both educational and occupational success (Strenze, Reference Strenze2007), whereby individuals with a higher level of intelligence tend to stay in school longer, and attain higher qualifications, than those with a lower relative level of intelligence. Intelligence is also predictive of physical and mental health, as well as of longevity, with a higher level of intelligence being associated with a lower risk of illness, and a greater lifespan (Calvin et al., Reference Calvin, Batty, Der, Brett, Taylor, Pattie and Deary2017; Deary et al., Reference Deary, Weiss and Batty2010). This link between intelligence with physical and mental health is partially explained by genetic variants that act across traits (Bulik-Sullivan et al., Reference Bulik-Sullivan, Finucane, Anttila, Gusev, Day, Loh and Neale2015; Hill et al., Reference Hill, Davies, Liewald, McIntosh and Deary2015).
The heritability of intelligence is around 50% when considering variants from across the full spectrum of the allelic frequency (Hill et al., Reference Hill, Arslan, Xia, Luciano, Amador, Navarro and Penke2018), and around 20% when including only common variants tagged by genotyped single nucleotide polymorphisms (SNPs; Marioni et al., Reference Marioni, Davies, Hayward, Liewald, Kerr, Campbell and Deary2014). Consistent with other quantitative phenotypes such a height (Wood et al., Reference Wood, Esko, Yang, Vedantam, Pers, Gustafsson and Frayling2014), and schizophrenia (Schizophrenia Working Group of the Psychiatric Genomics Consortium, 2014), the discrepancy between the heritability estimate and the variance explained by SNPs that attain genome-wide significance, is indicative of a phenotype where each variant captures only a negligible portion of a sizable genetic influence. In order to reliably detect such small individual effects, large sample sizes are required.
Such sample sizes are typically attained by meta-analyzing multiple Genome-wide Association Studies (GWAS) on intelligence (Davies et al., Reference Davies, Armstrong, Bis, Bressler, Chouraki, Giddaluru and Deary2015, Reference Davies, Lam, Harris, Trampush, Luciano, Hill and Deary2017). However, a recently published method, Multi-Trait Analysis of GWAS (MTAG) (Turley et al., Reference Turley, Walters, Maghzian, Okbay, Lee and Fontana2018), enables a meta-analysis to be conducted on genetically correlated traits; crucially, and unlike similar methods that test against a null hypothesis that each SNP is associated with none of the traits (Bolormaa et al., Reference Bolormaa, Pryce, Reverter, Zhang, Barendse, Kemper and Goddard2014; Zhu et al., Reference Zhu, Feng, Tayo, Liang, Young, Franceschini and Redline2015), MTAG can produce associations specific to one of the traits analyzed. This affords the advantage that, should a trait be burdensome to measure, as is the case for intelligence, a proxy phenotype can be used to ensure that a sufficiently large sample size can be generated, improving the chance of detecting individual loci associated with the trait of interest.
Educational attainment, measured as either years spent in education or a binary classification of whether or not a participant attained a college or university-level degree, has been used as a proxy phenotype for intelligence (Rietveld et al., Reference Rietveld, Esko, Davies, Pers, Turley, Benyamin and Koellinger2014). The ease with which educational attainment can be measured facilitates the collection of large samples. Moreover, education's strong genetic correlation of ~0.70 with established tests of intelligence (Bulik-Sullivan et al., Reference Bulik-Sullivan, Finucane, Anttila, Gusev, Day, Loh and Neale2015) demonstrates that this simple-to-measure trait has a very similar genetic architecture to intelligence and, therefore, may be used as a proxy phenotype for intelligence (Rietveld et al., Reference Rietveld, Esko, Davies, Pers, Turley, Benyamin and Koellinger2014). Lam et al. (Reference Lam, Trampush, Yu, Knowles, Davies, Liewald and Lencz2017) recently reported a large-scale GWAS of intelligence, which they called ‘cognitive ability’. Using MTAG (Turley et al., Reference Turley, Walters, Maghzian, Okbay, Lee and Fontana2018) to combine GWAS data sets on the correlated phenotypes of cognitive ability and education, Lam et al. derived 70 loci that they described as ‘trait-specific’ (page 2609) to cognitive ability. The purpose of this commentary is to examine whether the use of MTAG, in this case (Lam et al., Reference Lam, Trampush, Yu, Knowles, Davies, Liewald and Lencz2017), has resulted in genetic information about a phenotype that is more similar to education than to cognitive ability.
Methods, Results, and Discussion
Lam et al. (Reference Lam, Trampush, Yu, Knowles, Davies, Liewald and Lencz2017) correctly state that MTAG (Turley et al., Reference Turley, Walters, Maghzian, Okbay, Lee and Fontana2018) can generate trait-specific associations from a meta-analysis of different, genetically correlated traits. However, this is not the case when the statistical power for the different GWASs of the meta-analyzed traits are highly dissimilar, as seen below. The level of power in a GWAS data set can be gauged by examining the mean χ 2 statistic. Whereas these statistics are absent from Lam et al.’s published manuscript, they were presented by Lam et al. and can be viewed at the following URL (https://youtu.be/e9K1EOQSat4?t=19m29s; beginning at 19 min and 29 s). These are reported as mean χ 2 = 1.245 for the cognitive ability phenotype (labeled Sniekers+COGENT (Sniekers et al., Reference Sniekers, Stringer, Watanabe, Jansen, Coleman, Krapohl and Posthuma2017; Trampush et al., Reference Trampush, Yang, Yu, Knowles, Davies, Liewald and Lencz2017)), and mean χ 2 = 1.638 for the ‘years of education’ phenotype (taken from the publically available data provided by Okbay et al., Reference Okbay, Beauchamp, Fontana, Lee, Pers, Rietveld and Benjamin2016). These represent very different levels of statistical power, and the authors of the MTAG (Turley et al., Reference Turley, Walters, Maghzian, Okbay, Lee and Fontana2018) method clearly state that the False Discovery Rate (FDR) can become substantial if MTAG is applied to GWAS that differ a great deal in power. This issue applies to the analysis of Lam et al. (Reference Lam, Trampush, Yu, Knowles, Davies, Liewald and Lencz2017). Indeed, this potential problem is the reason that, in the MTAG method manuscript, all the traits presented had a mean χ 2 statistic that was quite similar.
The downstream consequences of combining two very differently powered traits can be seen in Supplementary Table 14 of Lam et al.’s paper (Reference Lam, Trampush, Yu, Knowles, Davies, Liewald and Lencz2017), and are presented in Table 1 herein. In Lam et al.’s Supplementary Table 14, genetic correlations are derived between four measures of education, with cognitive ability before and after the application of MTAG (labeled, respectively, in Lam et al. as METAL (Sniekers et al., Reference Sniekers, Stringer, Watanabe, Jansen, Coleman, Krapohl and Posthuma2017; Trampush et al., Reference Trampush, Yang, Yu, Knowles, Davies, Liewald and Lencz2017) and MTAG (Okbay et al., Reference Okbay, Beauchamp, Fontana, Lee, Pers, Rietveld and Benjamin2016; Sniekers et al., Reference Sniekers, Stringer, Watanabe, Jansen, Coleman, Krapohl and Posthuma2017; Trampush et al., Reference Trampush, Yang, Yu, Knowles, Davies, Liewald and Lencz2017)). Also provided by Lam et al. (Reference Lam, Trampush, Yu, Knowles, Davies, Liewald and Lencz2017) are the genetic correlations between years of education (labeled in Lam et al. as Education (Okbay et al., Reference Okbay, Beauchamp, Fontana, Lee, Pers, Rietveld and Benjamin2016)) with the same four measures of education. This makes it possible to determine whether the polygenic signal in the MTAG data set of Lam et al. more closely resembles cognitive ability or education. As can be seen in Table 1, the genetic correlation between four measures of education with cognitive ability are around 0.73; however, and crucially, following the application of MTAG, the magnitude of these genetic correlations increases to around 0.96. This increase in the magnitude of each of the four genetic correlations is statistically significant (Figure 1), indicating that the polygenic signal in the MTAG data set of Lam et al. (Reference Lam, Trampush, Yu, Knowles, Davies, Liewald and Lencz2017) is appreciably different from that of a GWAS data set composed solely of cognitive measures (see Appendix).
TABLE 1 Genetic Correlations Between the Three Cognitive Phenotypes Used in the Analysis of Lam et al. (Reference Lam, Trampush, Yu, Knowles, Davies, Liewald and Lencz2017), Years of Education from Okbay et al. (Reference Okbay, Beauchamp, Fontana, Lee, Pers, Rietveld and Benjamin2016) Labelled ‘Education’, ‘Cognitive Ability’ Grom a Meta-Analysis of Sniekers et al. (Reference Sniekers, Stringer, Watanabe, Jansen, Coleman, Krapohl and Posthuma2017) and Trampush et al. (Reference Trampush, Yang, Yu, Knowles, Davies, Liewald and Lencz2017), and the Deemed ‘Intelligence-MTAG’ Meta-Analysis of Lam et al. (Reference Lam, Trampush, Yu, Knowles, Davies, Liewald and Lencz2017), with Four Education Phenotypes
These figures are taken from Supplementary Table 14 of Lam et al. (Reference Lam, Trampush, Yu, Knowles, Davies, Liewald and Lencz2017). As can be seen, following the application of MTAG, the genetic correlation between Cognitive ability and Education approaches unity (middle row of Table 1). All genetic correlations greater than 1* (education from Okbay et al. (Reference Okbay, Beauchamp, Fontana, Lee, Pers, Rietveld and Benjamin2016) with College completion r g = 1.11, education from Okbay et al. (Reference Okbay, Beauchamp, Fontana, Lee, Pers, Rietveld and Benjamin2016) with Years of Schooling r g = 1.08, education from Okbay et al. (Reference Okbay, Beauchamp, Fontana, Lee, Pers, Rietveld and Benjamin2016) with Years of Schooling 2013 r g = 1.09) were treated as 1 (Walters, Reference Walters2016).
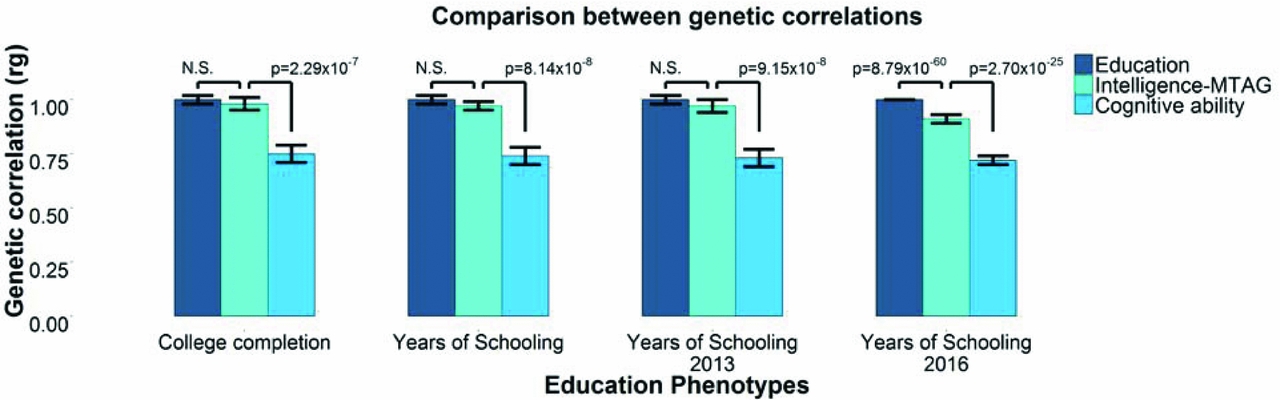
FIGURE 1 Lam et al. (Reference Lam, Trampush, Yu, Knowles, Davies, Liewald and Lencz2017) used three phenotypes (‘Education’ (Okbay et al., Reference Okbay, Beauchamp, Fontana, Lee, Pers, Rietveld and Benjamin2016), ‘Cognitive ability’ from a meta-analysis of Sniekers et al. (Reference Sniekers, Stringer, Watanabe, Jansen, Coleman, Krapohl and Posthuma2017) and Trampush et al. (Reference Trampush, Yang, Yu, Knowles, Davies, Liewald and Lencz2017), and the so-called ‘Intelligence-MTAG’ meta-analysis of Lam et al. (Reference Lam, Trampush, Yu, Knowles, Davies, Liewald and Lencz2017)) to derive genetic correlations with four measures of education.
The genetic correlations derived using years of education from Okbay et al. (Reference Okbay, Beauchamp, Fontana, Lee, Pers, Rietveld and Benjamin2016) and the four measures of education examined by Lam et al. (Reference Lam, Trampush, Yu, Knowles, Davies, Liewald and Lencz2017) were around unity, as would be expected when comparing data sets measuring highly similar phenotypes (Table 1). However, the genetic correlations derived using Lam et al.’s ostensible ‘intelligence-MTAG’ also approached unity with these same four measures of education. There were no significant differences between three of the four genetic correlations of the supposedly intelligence-MTAG data set with education, and those of the Okbay education data set with education (Figure 1).
This demonstration, carried out using the information in the manuscript of Lam et al. (Reference Lam, Trampush, Yu, Knowles, Davies, Liewald and Lencz2017), illustrates that the MTAG meta-analysis conducted by Lam et al. (Reference Lam, Trampush, Yu, Knowles, Davies, Liewald and Lencz2017) has not produced associations specific to cognitive ability but, rather, the polygenic signal found within the meta-analytic data set derived using MTAG is more similar to that of education.
Further supportive evidence for this conclusion includes the result that the genetic correlation with schizophrenia switches from negative, rg = -0.19, SE = 0.03, p = 2.85×10⁻¹⁰ consistent with previous findings (Hill et al., Reference Hill, Davies, Liewald, McIntosh and Deary2015) when examining Sniekers+COGENT (Sniekers et al., Reference Sniekers, Stringer, Watanabe, Jansen, Coleman, Krapohl and Posthuma2017; Trampush et al., Reference Trampush, Yang, Yu, Knowles, Davies, Liewald and Lencz2017; i.e., a solely cognitive combination), to near-zero (rg = -0.04, SE = 0.03, p = .11) when including education (which elsewhere has a zero or positive genetic association with schizophrenia (Bulik-Sullivan et al., Reference Bulik-Sullivan, Finucane, Anttila, Gusev, Day, Loh and Neale2015; Hagenaars et al., Reference Hagenaars, Harris, Davies, Hill, Liewald, Ritchie and Deary2016; Hill et al., Reference Hill, Davies, Liewald, McIntosh and Deary2015). Focusing on bipolar disorder, another change is observed: a non-significant genetic correlation with Sniekers+COGENT (Sniekers et al., Reference Sniekers, Stringer, Watanabe, Jansen, Coleman, Krapohl and Posthuma2017; Trampush et al., Reference Trampush, Yang, Yu, Knowles, Davies, Liewald and Lencz2017) is first observed, rg = -0.02, SE = 0.04, p = .66, consistent with other findings (Bulik-Sullivan et al., Reference Bulik-Sullivan, Finucane, Anttila, Gusev, Day, Loh and Neale2015; Hill et al., Reference Hill, Davies, Liewald, McIntosh and Deary2015) that examined the genetic correlation between bipolar disorder and cognitive ability, but this changes to a significant positive genetic correlation, rg = 0.16, SE = 0.03, p = 1.09×10⁻⁶, after education is added (positive associations are typically observed between bipolar disorder and education (Bulik-Sullivan et al., Reference Bulik-Sullivan, Finucane, Anttila, Gusev, Day, Loh and Neale2015; Hagenaars et al., Reference Hagenaars, Harris, Davies, Hill, Liewald, Ritchie and Deary2016; Hill et al., Reference Hill, Davies, Liewald, McIntosh and Deary2015)). These observations, too, point to a phenotype with a genetic architecture more similar to education than cognitive ability.
In addition, Lam et al. (Reference Lam, Trampush, Yu, Knowles, Davies, Liewald and Lencz2017) did not report the ‘max FDR’ calculation, as recommended by the authors of the MTAG methodology manuscript, which can show the extent of the false positive associations in this data set. This is an important step in the MTAG analysis and could have alerted the authors to the problems in their analysis.
MTAG (Turley et al., Reference Turley, Walters, Maghzian, Okbay, Lee and Fontana2018) is a promising new tool, able under certain conditions to produce the trait-specific associations claimed by Lam et al. (Reference Lam, Trampush, Yu, Knowles, Davies, Liewald and Lencz2017). However, in instances where there are substantial differences in statistical power among the various GWASs being meta-analyzed, there will be inflation in the FDR. Importantly, as seen in the results of Lam et al. (Reference Lam, Trampush, Yu, Knowles, Davies, Liewald and Lencz2017), the trait-specific associations will not be correctly derived. The results of Lam et al. (Reference Lam, Trampush, Yu, Knowles, Davies, Liewald and Lencz2017) are more relevant to the genetic contributions to education than they are to the genetic contributions to intelligence.
Acknowledgments
This was undertaken at The University of Edinburgh Centre for Cognitive Ageing and Cognitive Epidemiology, supported by funding from the Biotechnology and Biological Sciences Research Council (BBSRC) and the Medical Research Council (MRC; MR/K026992/1) and the University of Edinburgh. WDH is supported by a grant from Age UK (Disconnected Mind Project).
Appendix
Here, the scripts are presented to derive a p value (two-sided) describing whether the differences between the correlations found in Supplementary Table 14 of Lam et al. (Reference Lam, Trampush, Yu, Knowles, Davies, Liewald and Lencz2017) are significant. Cognitive ability is labeled as METAL (Sniekers et al., Reference Sniekers, Stringer, Watanabe, Jansen, Coleman, Krapohl and Posthuma2017; Trampush et al., Reference Trampush, Yang, Yu, Knowles, Davies, Liewald and Lencz2017), and the MTAG analysis is labeled MTAG (Okbay et al., Reference Okbay, Beauchamp, Fontana, Lee, Pers, Rietveld and Benjamin2016; Sniekers et al., Reference Sniekers, Stringer, Watanabe, Jansen, Coleman, Krapohl and Posthuma2017; Trampush et al., Reference Trampush, Yang, Yu, Knowles, Davies, Liewald and Lencz2017), finally education is labeled Education (Okbay et al., Reference Okbay, Beauchamp, Fontana, Lee, Pers, Rietveld and Benjamin2016), as can be seen in Lam et al. (Reference Lam, Trampush, Yu, Knowles, Davies, Liewald and Lencz2017). All genetic correlations greater than 1 were treated as 1 (Walters, Reference Walters2016).
METAL (Sniekers et al., Reference Sniekers, Stringer, Watanabe, Jansen, Coleman, Krapohl and Posthuma2017; Trampush et al., Reference Trampush, Yang, Yu, Knowles, Davies, Liewald and Lencz2017) vs. MTAG (Okbay et al., Reference Okbay, Beauchamp, Fontana, Lee, Pers, Rietveld and Benjamin2016; Sniekers et al., Reference Sniekers, Stringer, Watanabe, Jansen, Coleman, Krapohl and Posthuma2017; Trampush et al., Reference Trampush, Yang, Yu, Knowles, Davies, Liewald and Lencz2017)
## Years of schooling (proxy cognitive performance)
2*pnorm(-abs(abs(0.7373 - 0.9673) / sqrt(0.0356^2 + 0.0239^2)))
##Years of schooling 2013
2*pnorm(-abs(abs(0.7282 - 0.9654) / sqrt(0.0362^2 + 0.0257^2)))
##Years of schooling 2016
2*pnorm(-abs(abs(0.7176 - 0.9143) / sqrt(0.0182^2 + 0.0052^2)))
##College completion
2*pnorm(-abs(abs(0.7509 - 0.9847) / sqrt(0.0366^2 + 0.0265^2)))
Education (Okbay et al., Reference Okbay, Beauchamp, Fontana, Lee, Pers, Rietveld and Benjamin2016) vs. MTAG (Okbay et al., Reference Okbay, Beauchamp, Fontana, Lee, Pers, Rietveld and Benjamin2016; Sniekers et al., Reference Sniekers, Stringer, Watanabe, Jansen, Coleman, Krapohl and Posthuma2017; Trampush et al., Reference Trampush, Yang, Yu, Knowles, Davies, Liewald and Lencz2017)
## Years of schooling (proxy cognitive performance)
2*pnorm(-abs(abs(1 - 0.9673) / sqrt(0.0208^2 + 0.0239^2)))
##Years of schooling 2013
2*pnorm(-abs(abs(1 - 0.9654) / sqrt(0.0225^2 + 0.0257^2)))
##Years of schooling 2016
2*pnorm(-abs(abs(0.9991 - 0.9143) / sqrt(0.000046449^2 + 0.0052^2)))
##College completion
2*pnorm(-abs(abs(1 - 0.9847) / sqrt(0.024^2 + 0.0265^2)))


 Open access