


Introduction
The variability in the measurements of density of ice has been given considerable study, using ice of various ages and from numerous sources, and various techniques of measurement. However, since there is no apparent agreement of the values obtained by the different experiments, it can be assumed that the density of ice is dependent on the type of ice, on the conditions under which it was frozen, on its history, and on its crystal structure. Whether the ice is in the form of a single crystal or is a crystal aggregate may affect the values of densities obtained.
DorseyReference Dorsey 1 gives a rather thorough compilation of results obtained by various experimenters who give density values varying between 0.908 gm./cm.3 to 0.918 gm./cm.3 at 0° C. These values are for both natural and artificial ice aggregates.
Ginnings and Corruccini Reference Ginnings and Corruccini 2 calculated the density of ice from the calibration of their ice calorimeter, the heat of fusion of ice, and the densities of water and mercury, and arrived at a value of 0.91671 gm./ml. for ice at 0° C. and one atmosphere. This compares favorably with the value of 0.9168±0.0005 gm./ml. given in the International Critical Tables. 3 No evidence was obtained with the ice calorimeter that the true density of ice is anything but constant.
None of the investigators appears to have attempted accurate determination of the density of single ice crystals. The experimental work reported here was carried out in the refrigerated laboratories of SIPRE at Wilmette, Illinois.
List of Symbols Used
-
W s Weight
-
V s Volume
-
D s Density
-
s=1 for empty 10-ml. pycnometer
-
s=2 for 10-ml. pycnometer plus liquid
-
s=3 for empty 100-ml. pycnometer
-
s=4 for 100-ml. pycnometer plus liquid
-
s=5 for ice in air
-
s=6 for submerged ice
-
s=7 for 10-ml. pycnometer plus mercury
The primed weight symbols (W′ s ) refer to the vacuum-corrected weights
-
t 1=temperature at which density of liquid was determined (−4.5° C.)
-
t 2=temperature at which density of ice specimen was determined
-
=density of air at temperature t 2

-
D w =density of balance weights
-
=density of mercury at temperature t 1
-
=density of ice at temperature t 2
-
=density of liquid at temperature t 1
-
ΔV=change in volume of liquid between t 1 and t 2
-
V w =volume of balance weights
-
α=coefficient of cubical expansion of pyrex glass
-
k=coefficient of cubical expansion of liquid.
Experimental Procedure
Any list of the physical properties of a substance usually includes its density or specific gravity. If density values obtained for the same substance by different observers or different methods are to be relied upon, they must be both accurate and comparable. Therefore, the previously mentioned disagreement of ice density values obtained by different observers and different methods, assuming both to be reliable, must be due to other factors.
The density determinations discussed in this paper were made with the hydrostatic weighing method: the specimen of ice was first weighed in air, and then weighed while suspended in a liquid of known density. The liquid was 2, 2, 4-trimethylpentane, chosen for its low density and its insolubility in water.
The density of the liquid (saturated with H2O by contact with ice) was determined by pycnometer. For this, two special 10-milliliter pycnometers were designed, similar to that of Washburn and Smith,Reference Washburn and Smith 4 with a graduated capillary and fitted with a ground glass cap which could be sealed with grease to prevent any evaporation of the highly volatile liquid.
For the accuracy desired in this work, the effect of the buoyancy in air of the objects on the balance pans was taken into account. The formula for obtaining the true vacuum-corrected weight W′ from the weight W needed to balance an object of volume V is given by:

where


was employed. P is the barometric pressure in millimeters of mercury, H is the relative humidity as a percentage

Triple distilled dental mercury was used as the calibrating liquid for the 10-ml. pycnometer. The mercury was dripped into the pycnometer with a capillary tube of small enough diameter to allow the displaced air to escape, thus preventing any air from being trapped between the mercury-glass interface. The volume of the so-ml. pycnometer was then calculated from the relation

where W′7 and W′1 are the vacuum-corrected weights of the pycnometer plus mercury and of the empty pycnometer respectively and D m is the density of mercury at t°1 C. The pycnometers were then filled with 2,2,4-trimethylpentane, the density of which was obtained from

where W′2 is the weight of the 10-ml. pycnometer plus liquid.
A 100-ml. pycnometer of similar design was employed in determining the coefficient of expansion of the liquid. It was necessary to know this in order to determine the density of the liquid at any temperature t 2. The diameter of the uniform capillary of this pycnometer was measured with a filar micrometer mounted on a microscope, and thereby the average volume of each division of the capillary was obtained. Then the l00-ml. pycnometer plus liquid was submerged in a constant temperature bath and, varying the temperature of the bath, the change in volume of the liquid in the pycnometer capillary was noted.
The volume, V 3, of the 100-ml. pycnometer was obtained by

where W′4 and W′3 are the.vacuum-corrected weights of the pycnometer plus liquid and of the empty pycnometer respectively.
The volume of the 100-ml. pycnometer V 3 at temperature t 2 was determined by the relation
where α is the coefficient of cubical expansion of Pyrex glass.
and
where k is the cubical expansion coefficient of the liquid and ΔV is the observed change in volume of the liquid between t 2 and t 1

where k′ is the difference between the expansion coefficients of liquid and glass.
Therefore the expansion coefficient of the liquid was determined by:

With the density of the liquid known at one temperature
The ice specimens used were large, clear, pure single crystals from the Mendenhall Glacier near Juneau, Alaska, which is a temperate glacier (i.e. the temperature of the ice at a depth of more than approximately 40 ft. is always the melting point at the corresponding pressure). The ice crystals were machined into cylinders approximately 4 cm. in diameter and of approximately 60 gm. weight. About
The density of the specimen of ice at t° C.,

where
Results and Discussion
For determining the density of 2,2,4-trimethylpentane, two 10-ml. pycnometers were used. Two volumes of these bottles are given in Table I, p. 557. Table II gives the values of the density of the liquid determined at −4.5° C. The two independent determinations yielded the same value to the fifth decimal place, and this value was used in calculating the volume of the 100-ml. pycnometer given in Table III.
Table I Volume of 10-ml. Pycnometers

Table II Density of 2,2,4-Trimethylpentane
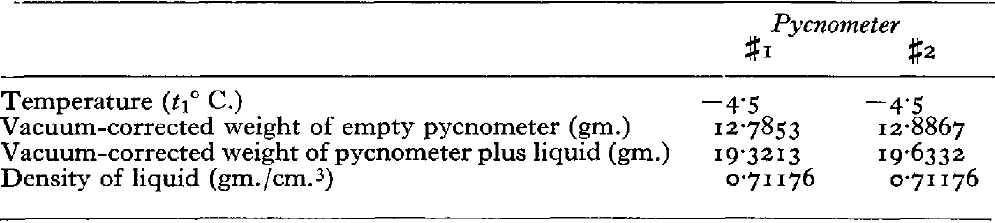
Table III Volume of 100-ml. Pycnometer

Table IV gives the measurements made in determining the coefficient of expansion of 2,2,4-trimethylpentane. The value of k obtained was used to determine the density of the liquid at t 2, that is, at any other temperature within the range.
Table IV Coefficient of expansion of 2,2,4-trimethylpentane
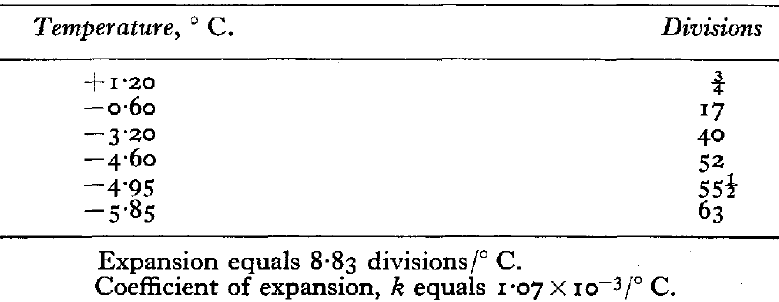
Table V gives the measurements made for the determination of the density of the single ice crystal. Column 1 gives the number arbitrarily assigned to each single ice crystal. The letters a, b, c, etc., refer to different samples taken from one single crystal. Column 2 gives the volume of each specimen, and Column 4 the computed densities at t2° C., given in Column 3. Column 5 refers to values in Column 4 corrected to −3.5° C., using an approximate coefficient of cubical expansion of 1.6×10⁻⁴/° C. This value is very nearly that of 1.58×10⁻⁴ given by Dorsey.Reference Dorsey 1 Column 6 lists the mean of the corrected values of each individual sample, and Column 7 the deviation from the mean. How individual specimens deviate from pure, single ice crystals is noted in Column 8. Specimens 21a and 21b were cut from a block of clear commercial ice with no air bubbles, to give a comparison between single ice crystals and another type of ice.
Table V Density of single ice crystals

Examination of the data shows that the maximum deviation from the mean of several determinations is ±0.00001. An error calculation was performed. This error is an estimated error; that is, it was computed on the basis of the estimated error of each individual measurement, such as the weighings and the density determination of the liquid. The estimated error was calculated using the general formula for computing the error of a function where
and

Δu 1, Δu 2, Δu 3 … Δu n are the estimated errors involved in each measurement.
The calculated estimated error of the density determinations of the ice specimens is ±2.1×10⁻⁵ gm./cm.3. The maximum deviation from the mean of several determinations falls well within the limits of this error.
Samples 20c and 20d, containing the Tyndall figure (hexagonal prismatic voids), were cut up and the approximate volume of the prisms obtained by measuring the length of the sides of the hexagonal face and the height of the prism under a microscope. Since the hexagonal faces were irregular, the mean of the lengths was used and approximate volumes obtained by the formula for the volume of a hexagonal prism, Volume=2.598hs 2, where s is the length of a side and h is the height. This approximation is good because of the small volumes involved. Table VI is a tabulation of the measurements and calculations. Corrected densities were obtained by assuming the Tyndall voids to be filled by ice of the same density as a pure specimen (♯20a). The new density value for 20c is well within the estimated error. However, the value for 20d falls outside. This may be due to the very slight fogging that occurs in this sample, or to other, unknown factors.
Table VI Correction for Tyndall Figures

Conclusions
The conclusions obtained by the examination of all these data are:
-
Density is slightly but measurably variable from one crystal to another.
-
Any imperfections, such as appear in samples 20c, 20d and 20e, are immediately evident in the density determinations, and correction for these imperfections gives a corrected density essentially the same as that of clear samples with no apparent imperfections.
-
Clear crystal aggregates can have a lower density than pure single ice crystals.


