


MX-80 bentonite is proposed for use in high-level radioactive waste (HLRW) repositories in several countries. The clay buffer in the KBS-3 method applied in Finland and Sweden (SKB, 2011; Posiva, 2012) is placed between a copper canister containing the waste and the granitic host rock. Therefore, among other functions, the buffer material should have very low hydraulic conductivity in order to limit the mass transport to diffusion only, but it also should be ductile enough to dampen the rock movements (Juvankoski, Reference Juvankoski2013). As the lifespan of the repository will be extremely long, the estimations of its performance are based on computer modelling. Currently, no consistent models explaining all of the macroscopic properties of bentonite exist (Savage, Reference Savage2012). Therefore, a better understanding of the material is needed in order to form a solid scientific basis for the models used in the safety assessment of HLRW repositories.
One of the key factors influencing bentonite behaviour is its microstructure. Numerous articles presenting the microstructure of swelling clays exist in the literature, covering a variety of approaches and techniques. In various cases, either commercial bentonites or purified, homo-ionic materials were analysed. Investigation of the size and shape of individual montmorillonite platelets by means of atomic force microscopy (AFM) is usually done on Na- or Ca-montmorillonite (Cadéne et al., Reference Cadéne, Durand-Vidal, Turq and Brendle2005; Ploehn & Liu, Reference Ploehn and Liu2006; Cao et al., Reference Cao, Fasulo and Rodgers2010; Pettersson et al., Reference Pettersson, Thormann and Claesson2010) or on purified material if various bentonites are compared (Delavernhe et al., Reference Delavernhe, Steudel, Darbha, Schäfer, Schuhmann, Wöll, Geckeis and Emmerich2015). Electron microscopy is also used to visualize clay systems. Scanning electron microscopy (SEM) may be used to characterize the microstructural features of clays in terms of being either humid, dried, frozen or embedded in a polymer matrix (Montes-Hernandez, Reference Montes-Hernandez2005; Katti & Katti, Reference Katti and Katti2006; Cuisinier et al., Reference Cuisinier, Deneele, Masrouri, Abdallah and Conil2014; Kaufhold et al., Reference Kaufhold, Halisch, Zacher and Kaufhold2016). Similarly, transmission electron microscopy (TEM) samples are either embedded or frozen (Pusch, Reference Pusch1999; Carlsson et al., Reference Carlsson, Muurinen, Matusewicz, Root, Carranza, Duffo and Rebak2012; Segad et al., Reference Segad, Hanski, Olsson, Ruokolainen, Åkesson and Jönsson2012). The methods using electron microscopy and ion milling are undergoing intense development. Combining advanced sample preparation (freezing the porewater to vitreous ice and embedding it in polymer resins) and precise 3D imaging of the samples means such methods give excellent insight into the clay microstructure (Holzer et al., Reference Holzer, Münch, Rizzi, Wepf, Marschall and Graule2010; Desbois et al., Reference Desbois, Urai, Pérez-Willard, Radi, Offern, Burkart, Kukla and Wollenberg2013; Houben et al., Reference Houben, Desbois and Urai2013; Keller et al., Reference Keller, Seiphoori, Gasser, Lucas, Holzer and Ferrari2014). Another approach giving 3D information on the clay microstructure, albeit with a lower resolution, is X-ray tomography. Its advantage is the possibility of monitoring processes such as wetting in situ (Harjupatana et al., Reference Harjupatana, Alaraudanjoki and Kataja2015) and of being combined with other methods like small-angle X-ray scattering (SAXS) or SEM (Suuronen et al., Reference Suuronen, Matusewicz, Olin and Serimaa2014; Kaufhold et al., Reference Kaufhold, Halisch, Zacher and Kaufhold2016). X-ray diffraction and scattering methods are very common ways of studying the microstructure of swelling clays, providing information about the basal spacing – the periodic distances between stacked clay platelets. Most often, water-saturated, compacted samples are measured outside confined conditions (Muurinen, Reference Muurinen2009; Holmboe et al., Reference Holmboe, Wold and Jonsson2012; Cuisinier et al., Reference Cuisinier, Deneele, Masrouri, Abdallah and Conil2014; Villar et al., Reference Villar, Gutiérrez-Rodrigo, Iglesias, Campos and Gutiérrez-Nebot2016), but also in situ measurements in confined conditions have been made (Devineau et al., Reference Devineau, Bihannic, Michot, Villiéras, Masrouri, Cuisinier, Fragneto and Michau2006; Warr & Berger, Reference Warr and Berger2007; Perdrial & Warr, Reference Perdrial and Warr2011). Mercury intrusion porosimetry (MIP) is the most commonly used method to determine pore-size distribution (Delage, Reference Delage2007; Ye et al., Reference Ye, Cui, Qian and Chen2009; Lubelli et al., Reference Lubelli, de Winter, Post, van Hees and Drury2013). It is also applied to swelling clays; however, only dry systems may be analysed, and the minimum pore aperture that may be resolved with MIP is ~5 nm (Marcial et al., Reference Marcial, Delage, Ruiz and Cui2006; Lloret & Villar, Reference Lloret and Villar2007).
As the montmorillonite platelets are the main structural components of bentonite, the porosity of bentonite is complex, and it varies depending on conditions such as the density or the level of hydration (Holmboe et al., Reference Holmboe, Wold and Jonsson2012; Villar et al., Reference Villar, Gómez-Espina, Campos, Barrios, Gutiérrez, Mancuso, Jommi and D'Onza2012; Muurinen et al., Reference Muurinen, Carlsson and Root2013). The definition of the various groups of pores in bentonite is widely accepted. Interlamellar (interlayer, interlaminar) pores – slit-like pores with an aperture <2 nm – are formed between stacked montmorillonite platelets. All remaining pores (non-interlamellar) are sometimes divided into intra-aggregate and inter-aggregate porosities (Pusch et al., Reference Pusch, Karnland and Hökmark1990; Villar, Reference Villar2002). Consequently, many authors suggest the existence of waters of various properties in bentonite (Bourg et al., Reference Bourg, Bourg and Sposito2003; Bradbury & Baeyens, Reference Bradbury and Baeyens2003; Fernández et al., Reference Fernández, Baeyens, Bradbury and Rivas2004; Wersin et al., Reference Wersin, Curti and Appelo2004; Kozaki et al., Reference Kozaki, Liu and Sato2008); therefore, some microstructural information may be deduced by looking at the water that is present in pores. In line with this suggestion, anion exclusion from the pore space may be used to draw conclusions on the microstructure (Muurinen et al., Reference Muurinen, Karnland and Lehikoinen2004; Van Loon et al., Reference Van Loon, Glaus and Müller2007). Nuclear magnetic resonance (NMR) relaxation techniques are sometimes used to obtain pore-size distributions (Sørland et al., Reference Sørland, Djurhuus, Widerøe, Lien and Skauge2007), and these techniques have been used to obtain information about water in swelling clays (Ohkubo et al., Reference Ohkubo, Kikuchi and Yamaguchi2008; Dvinskikh & Furó, Reference Dvinskikh and Furó2009; Matusewicz et al., Reference Matusewicz, Pirkkalainen, Liljeström, Suuronen, Root, Muurinen, Serimaa and Olin2013). Among the cited works, some use only purified clay (Ploehn & Liu, Reference Ploehn and Liu2006; Kozaki et al., Reference Kozaki, Liu and Sato2008; Pettersson et al., Reference Pettersson, Thormann and Claesson2010; Segad et al., Reference Segad, Hanski, Olsson, Ruokolainen, Åkesson and Jönsson2012; Matusewicz et al., Reference Matusewicz, Pirkkalainen, Liljeström, Suuronen, Root, Muurinen, Serimaa and Olin2013; Delavernhe et al., Reference Delavernhe, Steudel, Darbha, Schäfer, Schuhmann, Wöll, Geckeis and Emmerich2015; Harjupatana et al., Reference Harjupatana, Alaraudanjoki and Kataja2015) and a few use both purified and original clay (Montes-Hernandez, Reference Montes-Hernandez2005; Devineau et al., Reference Devineau, Bihannic, Michot, Villiéras, Masrouri, Cuisinier, Fragneto and Michau2006; Holmboe et al., Reference Holmboe, Wold and Jonsson2012), while most focus on the original bentonites.
In this work, MX-80 bentonite is studied along with sodium and calcium montmorillonite obtained by purification of MX-80. It has to be kept in mind that the purification of MX-80 bentonite does not result in pure montmorillonite; rather, it is most accurate to use the term ‘fine fraction’ of MX-80 bentonite. However, as montmorillonite is the dominant clay mineral in the fine fraction of MX-80 bentonite, the authors use the simplified terms ‘Na-montmorillonite’ and ‘Ca-montmorillonite’ in this text. Each data point presented corresponds to one sample. The purified clay is intended to serve as a simplified system that might be used to better understand the influence of chemical conditions and density on the compacted, water-saturated clay microstructure. This research is focused on characterizing the changes in the clay microstructure induced by the purification process and on characterizing the pore structure of compacted, water-saturated clay.
Materials
Calcium and sodium montmorillonite were obtained by purification of MX-80 bentonite (CETCO, UK) used in experiments. The purification method included removal of coarse particles by centrifugation, of carbonates by acid treatment, of iron oxides by citrate buffer treatment and of organic matter by H2O2 treatment (Tributh & Lagaly, Reference Tributh and Lagaly1986). After drying, the purified clay was ground to the same grain size as MX-80 using a vibrating-disc mill. Cylindrical clay samples (1 cm high, 2 cm in diameter) were prepared at various densities by uniaxial compaction, water saturated and left to equilibrate with 0.1 M NaClO4 (Ca(ClO4)2 for Ca-montmorillonite) solution for a minimum of 1 year.
Methodology
Transmission electron microscopy and AFM have been used to investigate the changes induced in clay by the purification process. Transmission electron microscopy images give qualitative information about the microstructure of the samples. The samples were high-pressure frozen with a Leica EM Pact machine (Studer et al., Reference Studer, Graber, Al-Amoudi and Eggli2001), embedded in EPON™ epoxy resin, sliced with a microtome and imaged in an FEI Tecnai 12 microscope at a working voltage of 120 kV. Atomic force microscopy imaging was used to calculate the particle size and shape distributions of the clay particles. The clay suspensions were treated with ultrasound and deposited on a freshly cleaved mica surface. Imaging was then carried out using the scan assist mode of the Nanoscope MultiMode scanning probe microscope (Bruker Corporation, MA, USA). The image analysis was done using SPIP software (Image Metrology, Denmark), in which perimeters of platelets were marked manually. The shapes collected in this way were used to calculate the equivalent diameter (defined as the diameter of a circle having an area equal to the area enclosed by the particle's perimeter) and the aspect ratio (defined as the ratio of the particle length at the broadest point to its width in the perpendicular direction). Those simple geometrical parameters were chosen to determine whether the average size and shape of clay platelets changed during the purification process.
The porosity investigation was based on three different methods: (1) SAXS; (2) anion exclusion; and (3) proton-relaxation NMR. The SAXS patterns were obtained using an X-ray tube with a Cu anode (PANalytica, The Netherlands). The X-ray beam was collimated and monochromated to Cu-Kα radiation (wavelength 1.54 Å) using a Montel-multilayer mirror. The scattered intensity was collected using a Bruker Hi-Star area detector. The 0.3 mm section of compacted, water-saturated sample was confined with a thin polypropylene film to prevent drying during the measurement. The SAXS patterns were used to calculate the average distance between adjacent montmorillonite layers (d IL), which, together with the specific surface area (SSA), were applied as in equation 1 (Matusewicz et al., Reference Matusewicz, Järvinen, Olin and Muurinen2017):
 $$V_{\rm IL} = 0.5\cdot\,\,d_{\rm IL}\cdot\,SSA\cdot\,\displaystyle{{n - 1} \over n}$$
where n is the average number of layers per stack to estimate the volume of the interlamellar pores (V IL). It was assumed that the edge surface area of montmorillonite was small enough to be disregarded in this calculation and the total SSA was used. The SSA value taken from the literature was 624 ± 7 m2 g–1 and was obtained using the ethylene glycol monoethyl ether (EGME) adsorption method (Kiviranta & Kumpulainen, Reference Kiviranta and Kumpulainen2011). The average height of the pore multiplied by the specific surface area of the slit-like pore forming montmorillonite particles gives the interlamellar pore volume. A correction for finite size of the stack needs to be included in the calculation. The ratio of interlamellar pore volume and the total sample volume is called ‘interlamellar porosity’ in the following text.
Anion exclusion was estimated by measuring the number of perchlorate ions that diffused into the sample during the sample equilibration. The anions were leached out of the clay, and their concentration in the leachate was measured using an ion-selective electrode (Nico2000 Ltd, UK). To calculate the anion-accessible porosity, it was assumed that the equilibration time was long enough to achieve the same perchlorate concentration in the accessible pore space as in the equilibrating solution and so no more anions would enter the sample. The anion-accessible volume is defined as the number of anions in the sample divided by the concentration of anions. The ratio of the anion-accessible volume to the total sample volume is referred to as the anion (in this work, perchlorate)-accessible porosity.
The NMR technique used was the 1H NMR Carr–Purcell–Meiboom–Gill (CPMG) echo-type experiment (Santyr et al., Reference Santyr, Henkelman and Bronskill1988), which is a spin-locking pulse sequence with τ = 22 μs. The measurements were carried out with a high-field Chemagnetics CMX Infinity 270 MHz NMR spectrometer. Relaxation curves were analysed using XPfit software (SoftScientific, Israel). The hydrogen nuclei in the sample during the experiment were brought to an excited state, with the recorded signal being the relaxation of the hydrogen nuclei of water molecules. As the relaxation time depends on the average distance of the water molecule from the pore wall, a cut-off time (Ohkubo et al., Reference Ohkubo, Kikuchi and Yamaguchi2008; Matusewicz et al., Reference Matusewicz, Pirkkalainen, Liljeström, Suuronen, Root, Muurinen, Serimaa and Olin2013) was used to represent the total water population as a function of the pore size. The cut-off time was chosen to correspond to the relaxation time of water protons in a nanometre-sized pore. This means that the water population was confined to very fine pores, including interlamellar pores, as the relaxation time is shorter than the chosen cut-off time. The remaining water was found in the larger-pore structures.
More detailed descriptions of the sample preparation and the methods applied can be found in our previous work (Carlsson et al., Reference Carlsson, Muurinen, Matusewicz, Root, Carranza, Duffo and Rebak2012; Matusewicz et al., Reference Matusewicz, Pirkkalainen, Liljeström, Suuronen, Root, Muurinen, Serimaa and Olin2013).
Results and discussion
Transmission electron micrographs provide distinct images of MX-80 bentonite and the purified samples. In the case of MX-80, wavy, complex aggregates are seen (Fig. 1, right panel), whereas in purified samples, well-oriented layers of platelets dominate (Fig. 1, left and centre panels). The purification process, where clay is treated mostly in suspensions, destroys aggregates present in MX-80, and drying of the suspension towards the end of the process results in relatively organized deposition of fine-fraction platelets. No accessory minerals were visible in purified samples, whereas they were easily found in the original MX-80.
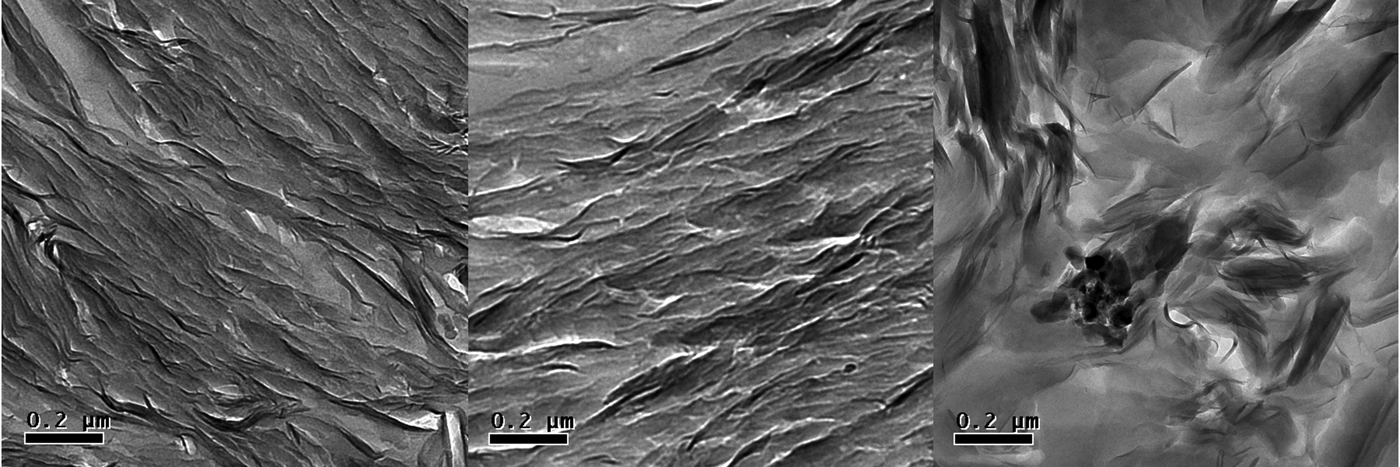
Fig. 1. Transmission electron micrographs of Na-montmorillonite (left), Ca-montmorillonite (centre) and MX-80 (right); magnification ×9300. The dry density of the clay is 1.1 g cm–3.
Atomic force micrographs show a micrometre-sized area with a nanometre-sized vertical resolution (Fig. 2). This allows measuring of the lateral size of individual clay platelets. If enough platelets are measured, statistical analysis can be performed. The sample preparation procedure applied did not break down all of the aggregates, so only delaminated, clearly separated platelets were taken into account.
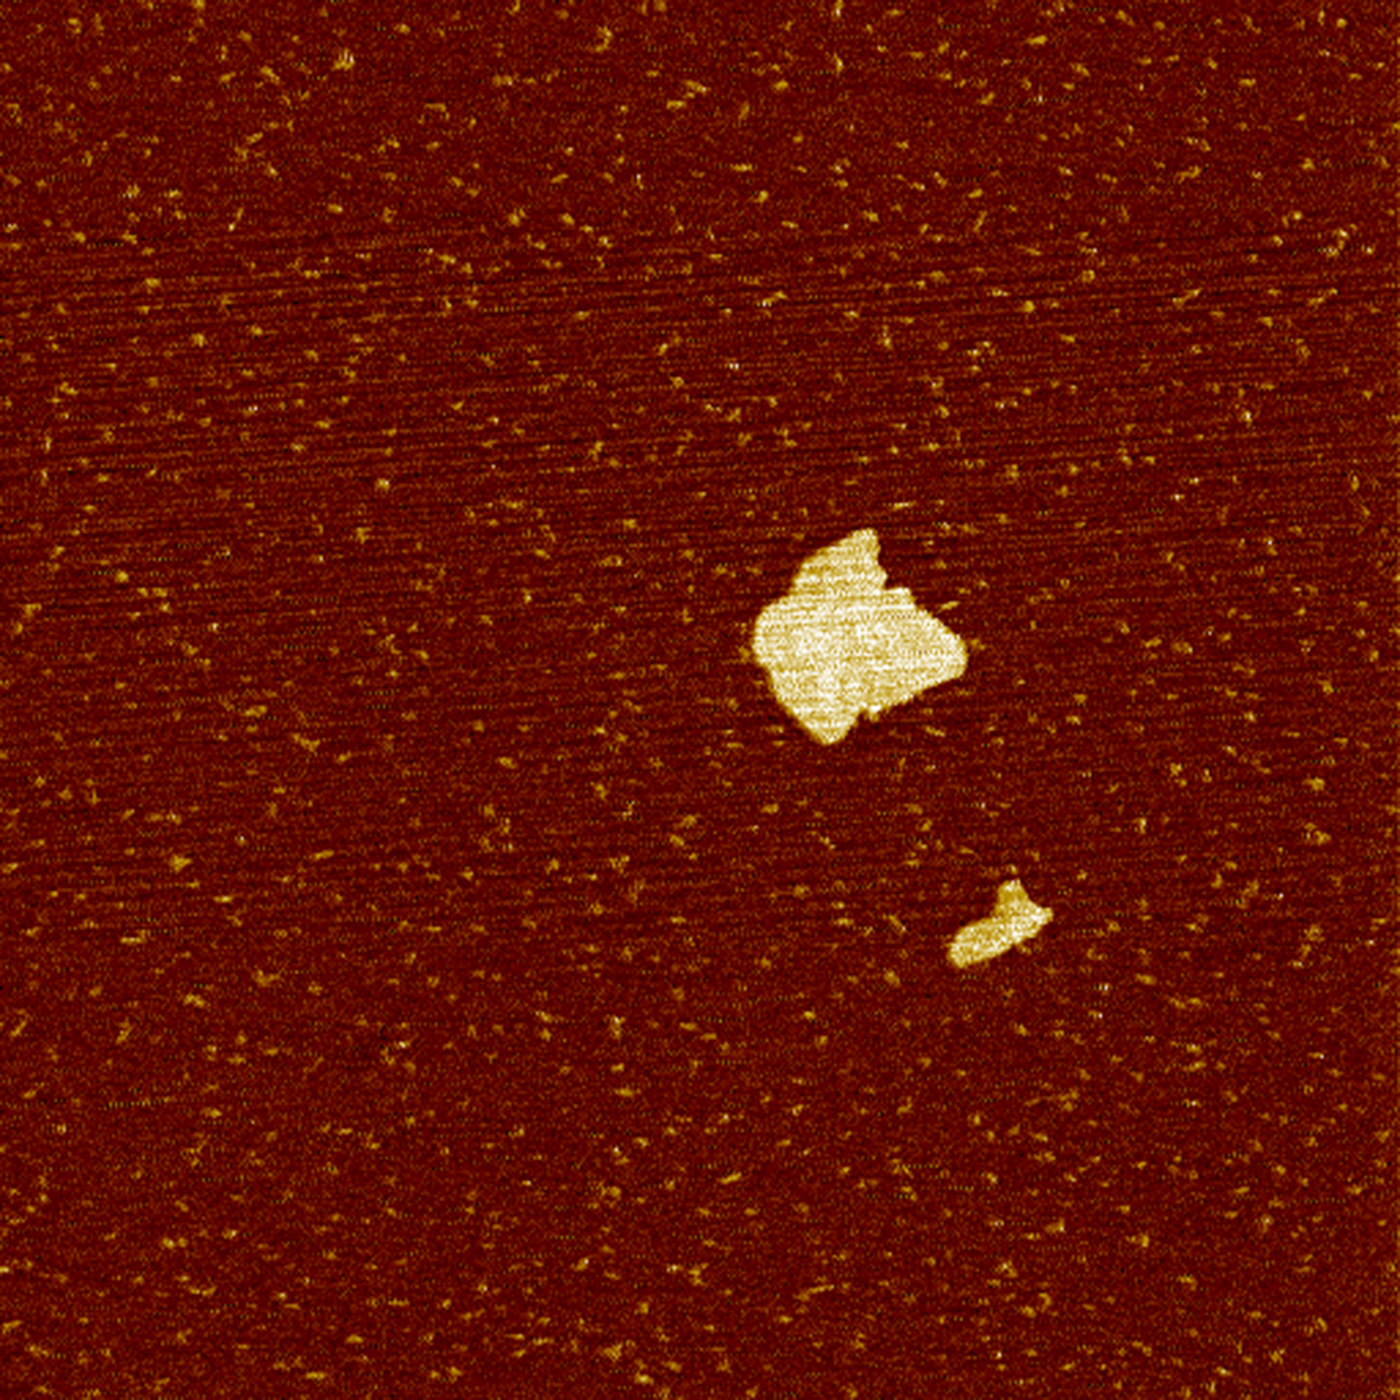
Fig. 2. Atomic force micrograph of montmorillonite platelets in an MX-80 bentonite sample. The edge length of the image is 2 μm.
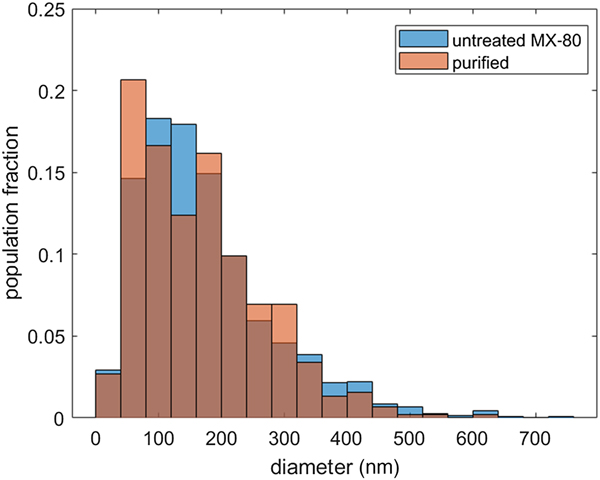
Histograms of particle-size distribution show slightly different distributions for MX-80 and the purified material (Fig. 3). In both samples, most of the particles have a diameter in the range of 50–250 nm, yet within that range, the distributions vary. In the case of MX-80, the most populated region of the size distribution is between 100 and 150 nm, whereas in the case of the purified clay, it is between 50 and 100 nm. However, the purified distribution is bimodal, having a second peak with a value <200 nm. This range of sizes agrees well with the data previously reported in the literature (Ploehn & Liu, Reference Ploehn and Liu2006; Delavernhe et al., Reference Delavernhe, Steudel, Darbha, Schäfer, Schuhmann, Wöll, Geckeis and Emmerich2015).

Fig. 3. Particle-size distribution of MX-80 bentonite (blue) and purified clay (red). Note that the brown colour denotes the overlap of the two distributions. The equivalent diameters were calculated for populations of 1500 and 500 particles, respectively.
Few larger particles of equivalent diameter >600 nm and a log-normal distribution over the whole distribution were observed for MX-80, whereas purified clay particles >600 nm were not detected and the size distribution appears to be a superposition of two log-normal distributions. In another study reporting the platelet-size distribution in purified clay, sizes of >500 nm also were not observed (Delavernhe et al., Reference Delavernhe, Steudel, Darbha, Schäfer, Schuhmann, Wöll, Geckeis and Emmerich2015). However, it may be that the observation of very few particles >600 nm is linked to the larger population of the measured samples of MX-80 compared to the purified clay or to slight differences in the sample preparations. Nevertheless, the number of measured particles in the purified samples is large enough for the statistical analysis.
Some differences between fine-fraction platelets of MX-80 and purified clay are visible when analysing the particle aspect ratio. Note that in this research we focused on the aspect ratio between lateral platelet dimensions, whereas often in nanoscience the aspect ratio between the height and width of the platelets is of interest (Ploehn & Liu, Reference Ploehn and Liu2006; Cao et al., Reference Cao, Fasulo and Rodgers2010). Comparing the results presented in Fig. 4, a higher number of long, narrow particles (length to width ratio >3) is present in the purified clay. At the same time, the fraction of particles with an aspect ratio <1.5 is higher in purified clay samples. The presence of long and narrow particles could be a direct consequence of grinding at the end of the purification process, where dried clay was ground to grains of the same diameter as MX-80. Despite some variation in the fraction of the particles with the highest and lowest aspect ratios, the vast majority of platelets have an aspect ratio <2.5 for both samples.

Fig. 4. Fine-fraction platelet aspect ratio in MX-80 bentonite (blue) and purified clay (red). Note that the brown colour denotes the overlap of the two distributions.
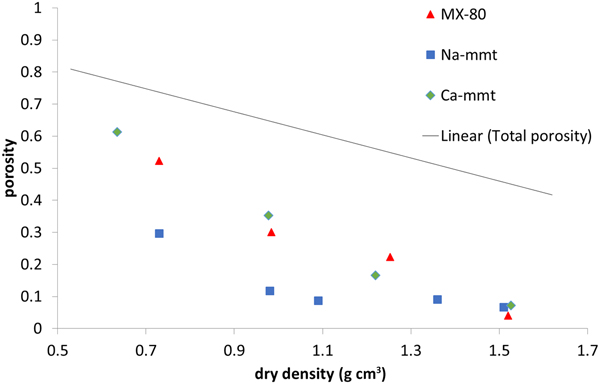
In all of the approaches to characterizing the porosity of bentonite, the most important factor controlling the material microstructure is density (Sato et al., Reference Sato, Ashida, Kohara, Yui and Sasaki1992; Marcial et al., Reference Marcial, Delage, Ruiz and Cui2006; Muurinen et al., Reference Muurinen, Carlsson and Root2013). It is expected that the degree of compaction affects the pore structure, but the following results show the finer influence of purification and chemical conditions observed with various methods.
Perchlorate-accessible porosity (Fig. 5) is clearly lower than the total porosity of the samples, which was expected due to the negative charge of montmorillonite platelets. The effect of the ionic strength of the solution, influencing the anion exclusion (Van Loon et al., Reference Van Loon, Glaus and Müller2007; Tournassat & Appelo, Reference Tournassat and Appelo2011), has to be considered here. The electrical double layer is thinner in solutions with a higher ionic strength; therefore, with a higher ionic strength, the exclusion effects decrease. The three analysed materials have different ionic strengths: Na-montmorillonite has the lowest strength (1:1 electrolyte, pure material), while MX-80 (1:1 electrolyte, accessory minerals dissolving in the pore space) and Ca-montmorillonite have higher strengths (pure material, but saturated with 2:1 electrolyte). MX-80 and Ca-montmorillonite samples behaved in a similar way throughout the whole density range analysed, whereas in Na-montmorillonite, for the densities <1.2 g cm–3, the anion-accessible porosity was clearly lower. Higher values for the anion-accessible volume in Ca-montmorillonites have been reported before (Muurinen & Carlsson, Reference Muurinen and Carlsson2013). For all of the samples measured, perchlorate-accessible porosity decreased with increasing sample density not only in absolute values, but also as a fraction of the total porosity.

Fig. 5. Perchlorate-accessible porosity for MX-80 and purified Ca- and Na-montmorillonite (mmt) as a function of dry density. The solid line represents the total porosity of the system.
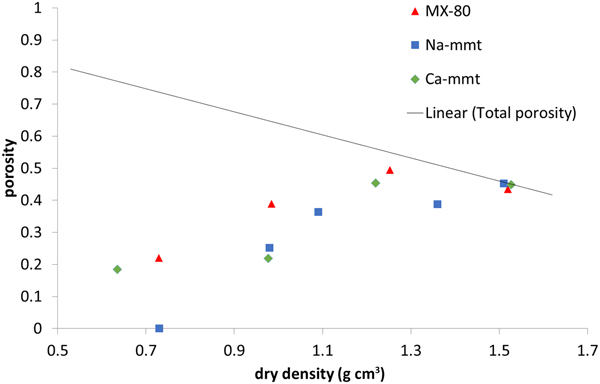
Interlamellar porosity calculated from X-ray scattering patterns (Fig. 6) showed a similar trend for all of the samples, with Ca-montmorillonite having slightly higher values than MX-80 and Na-montmorillonite having slightly lower values than MX-80. The reason for this is that Ca-montmorillonite tends to form larger stacks than Na-montmorillonite (Schramm & Kwak, Reference Schramm and Kwak1982). With increasing density, the fraction of interlamellar porosity increased for all of the samples, but did not reach the total porosity at densities of up to 1.5 g cm–3.
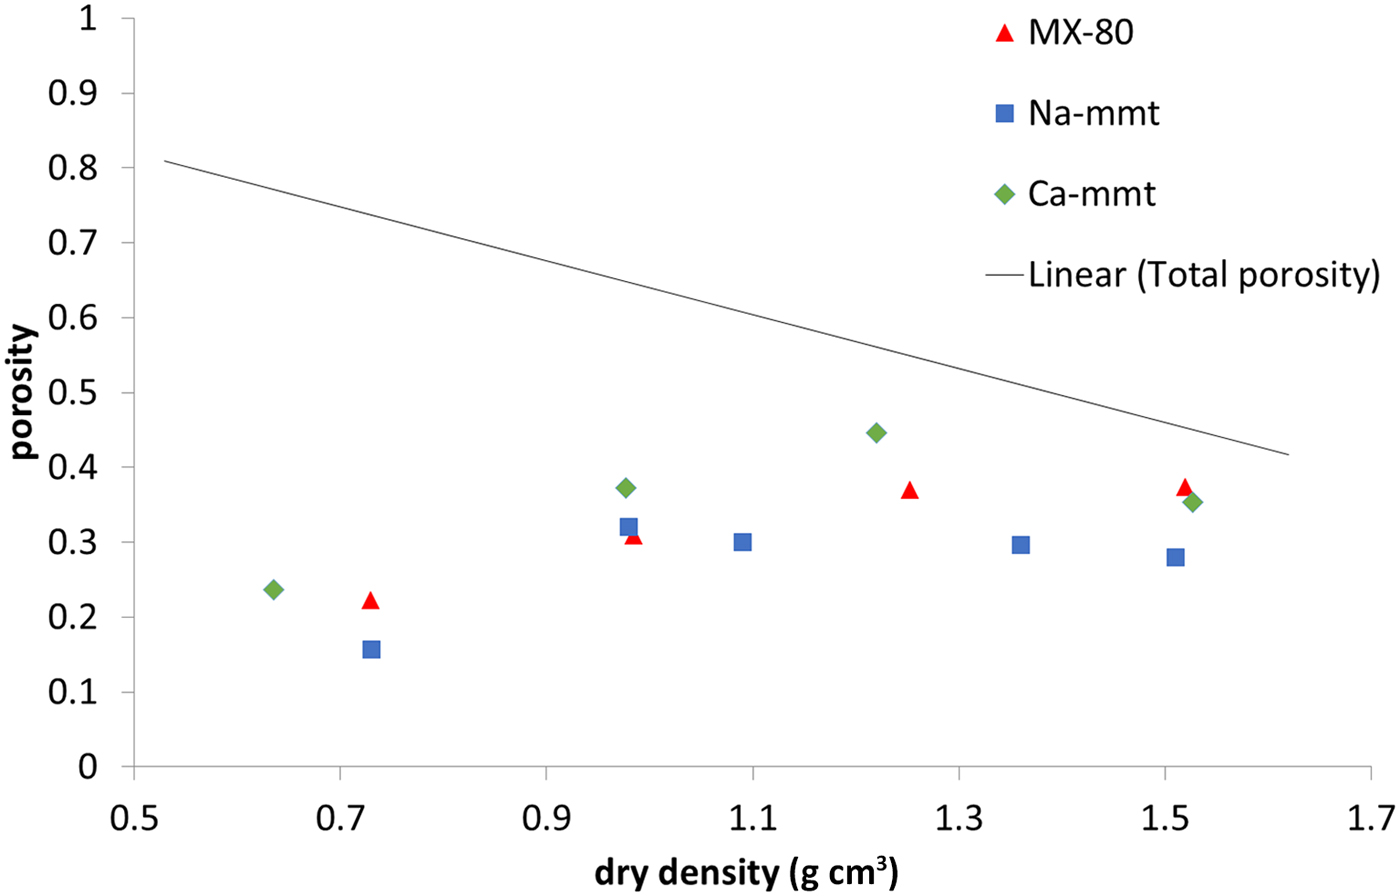
Fig. 6. Interlamellar porosity based on SAXS for MX-80 and purified Ca- and Na-montmorillonite (mmt) as a function of dry density. The solid line represents the total porosity of the system.
The amount of water confined in the nanopore space measured in NMR experiments (Fig. 7) is practically equal to the total porosity in all of the samples at 1.5 g cm–3 dry density, as has been suggested previously by some authors (Holmboe et al., Reference Holmboe, Wold and Jonsson2012). Naturally, with decreasing density, pore size increases, and what is observed is a steady decrease of the nanopore volume. Still, at a dry density of ~0.7 g cm–3 in MX-80 and Ca-montmorillonite samples, the volume of nanopores was close to 20% of total sample volume, while no nanopores were observed in the Na-montmorillonite sample. It has to be mentioned that the duration of the measurement allows for the exchange of water particles between pores of various sizes. This means that some of the water molecules may diffuse out of the nanometre-sized interlamellar pores to larger pores. Therefore, the nanopore volume may be underestimated using this NMR technique. However, the values obtained for Ca-montmorillonite and MX-80 are comparable with the values calculated using other methods in this research and with values reported in the literature (Muurinen et al., Reference Muurinen, Carlsson and Root2013).
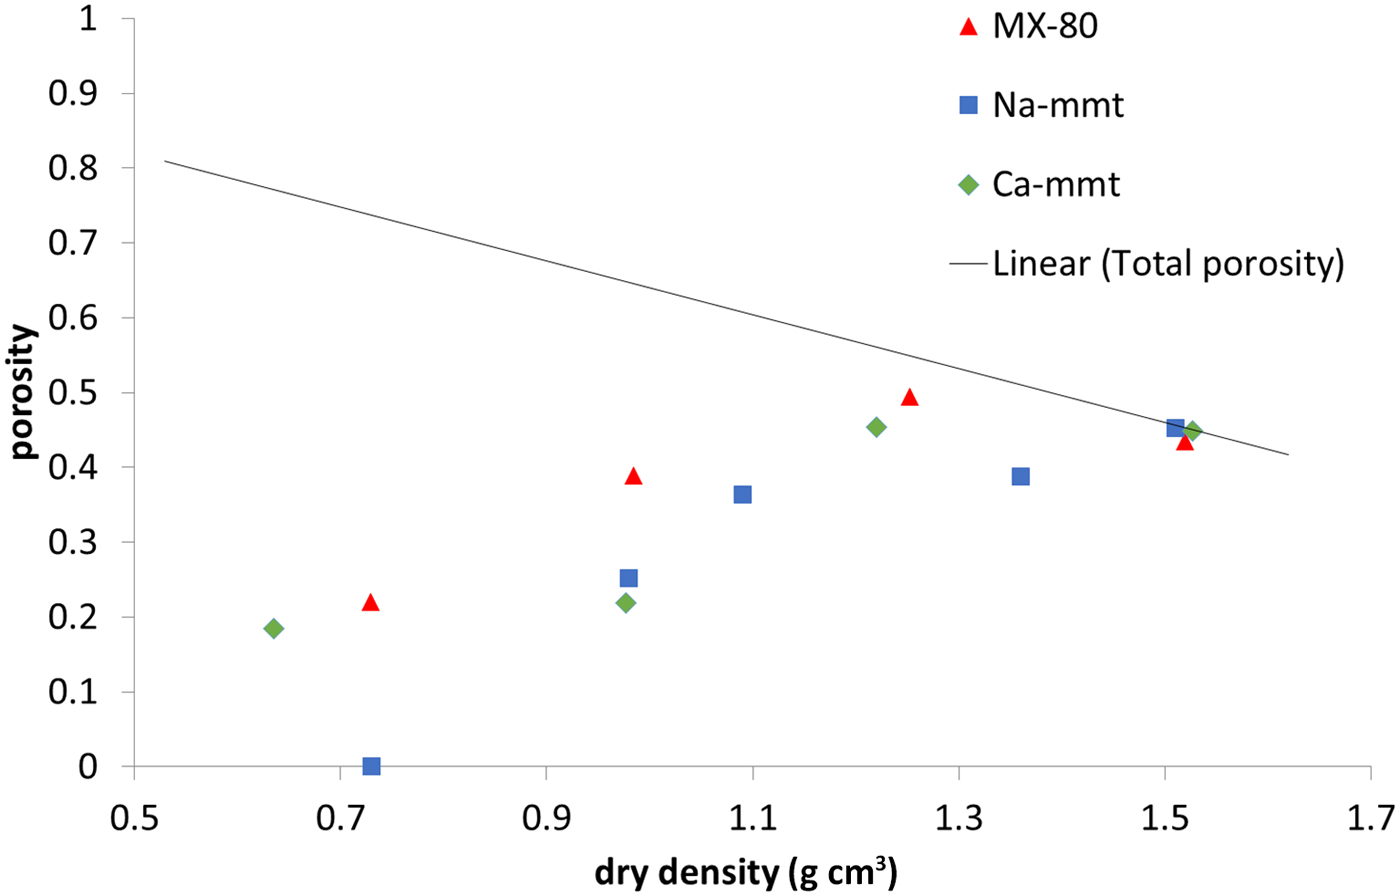
Fig. 7. Water population in nanopores based on NMR for MX-80 and purified Ca- and Na-montmorillonite (mmt) as a function of dry density. The solid line represents the total porosity of the system.
The investigated samples generally followed similar trends throughout the measured density range. The exception was Na-montmorillonite, which behaved differently from other samples at 0.7 g cm–3 dry density. It was observed that fewer anions were able to penetrate this sample; it had the lowest volume of interlamellar pores and the lowest population of water confined in nanopores. This may be explained by assuming a smaller size of tactoids in the sodium clay, where the structure partially resembles a gel formed of single, delaminated montmorillonite platelets.
Conclusions
Bentonite clay is applied as a buffer material between bedrock and copper canisters containing HLRW. The estimated time of its protective functioning is at least tens of thousands of years. Therefore, a detailed understanding of bentonite is necessary. Changes to the exchangeable-cation composition in bentonite cause changes in properties – instead of studying the mixed-cation forms, it is common to study purified Na- or Ca-montmorillonite because homo-ionic materials provide results that are easier to interpret. As only few works have compared purified clays with ‘as-delivered’ bentonites, the results of this study will help us to understand the differences between those systems.
The main factor affecting the porosity of bentonites is the density caused by compaction. The effect of exchangeable cations is much smaller – differences in the pore structures of compacted samples are most visible at low densities, where the sodium form of montmorillonite has less porosity confined in nanometre-sized pores, including interlamellar spaces, than the calcium form of montmorillonite and MX-80 bentonite. At high compaction densities, therefore, under conditions similar to those that would be expected in the repository, the differences between the samples, as well as those caused by the compensating cation composition, seem to be less pronounced.
The obtained results also allow for the conclusion that the applied purification process clearly affected the clay microstructure. The montmorillonite platelet-size distribution shifted towards smaller particles for purified clays, with ~35% of particles having an equivalent diameter of between 40 and 120 nm. A change in shape was also noticed, with purified clay having a greater fraction of long, narrow particles than MX-80. The different size and shape distributions of the montmorillonite platelets in MX-80 clay and clay obtained by purification may be attributed to additional grinding at the end of purification (separately from chemical treatment and multiple washing cycles). Naturally, various purification procedures may affect variably the montmorillonite platelets in the purified material.
The long-term performance analysis of bentonite for safe disposal of spent nuclear fuel is based on modelling of both chemical and mechanical behaviour. Microstructural data are used, for example, in modelling diffusion and sorption by surface complexation modelling or as a basis for water transport and mechanical models. Calculating the diffusion of anions requires data on the porosity that is available for them, and diffusion is applied to the transport of corroding agents and radionuclides. Another possible application is extending surface complexation modelling from dilute to compacted systems and the estimation of the extension of diffuse double layers in the pore system. Swelling and swelling pressure formation are connected to the distribution of water between larger pores and the interlamellar space, and the data regarding microstructure also provide important guidance for mechanical modelling. The development of advanced structural models (dual porosity or more complicated assumptions) of compacted swelling clays may make use of porosity values and the differences between the methods. However, porosity should be measured with various methods in many different conditions (salinity, pH, temperature and pressure). This will provide experimental results for testing the developed models under various conditions.
Acknowledgements
The research leading to these results has received funding from the European Atomic Energy Community's Seventh Framework Programme (FP7/2007-2011) under Grant Agreement no. 295487, the BELBaR project and the Finnish Research Programme on Nuclear Waste Management (KYT) 2015–2018, Thebes project. A. Root, V. Liljeström, J.-P. Suuronen and A. Muurinen are thanked for cooperation and fruitful discussions.


 Open access