Introduction
Emissions of dimethyl sulphide (DMS) in the remote marine atmosphere represent a major natural source of sulphur, both in the remote atmosphere and on a global scale (Reference Spiro, Jacobs. and Logan.Spiro and others, 1992). DMS is the only atmospheric source of methane sulphonate (MSA−), and measurements of MSA in the atmosphere and in ice cores offer a potential indicator of marine biogenic activity in the present and past. (MSA− is generally assumed to be transported and deposited in its acidic form, methane sulphonic acid (MSA), but is generally measured by ion chromatography as the anion MSA−.) Non-sea-salt sulphate (nssSO42) is also produced by DMS in the atmosphere, and several studies have measured MSA and nssSO42 in aerosol, surface snow, firn and ice cores to evaluate short- and long-term changes in marine emissions of DMS (Reference Legrand, Feniet-Saigne, Saltzman., Germain., Barkov. and Petrov.Legrand and others, 1991; Reference Pasteur, Mulvaney., Peel., Saltzman. and Whung.Pasteur and others, 1995; Reference Wagenbach, Wolff and Bales.Wagenbach, 1996).
In the reconstruction of past atmospheric composition from ice cores, the assumption is often made that there is no post-depositional modification of the chemistry during diagenesis of the firn. However, it has been reported that MSA− shows post-depositional relocation in some Antarctic firn and ice cores (Reference Mulvaney, Pasteur., Peel., Saltzman. and Whung.Mulvaney and others, 1992); Reference Minikin, Wagenbach., Graf. and Kipfstuhl.Minikin and others, 1994; Reference PasteurPasteur, 1996). Aerosol and surface-snow measurements confirm that MSA− reaches a maximum in summer, and is at a minimum in winter (Reference SavoieSavoie and others, 1993; Reference Wagenbach, Wolff and Bales.Wagenbach, 1996), consistent with the predominantly summertime production of DMS. A similar summer/winter contrast in MSA− is also seen in the first few layers of snow deposition. Deeper in the firn, however, MSA− can become concentrated in the winter layer, defined by nssSO42 and oxygen isotope (δ 18O) ratios reaching their winter minimum values. This apparent change in the seasonality of MSA− is demonstrated in an ice-core profile from Berkner Island (78°18′ S, 46°17′ W), situated on the Filchner Ronne Ice Shelf, Antarctica (Fig. 1). In the shallower section the MSA− concentrations are highest during the summer and in phase with nssSO42− and δ 18O, whilst in the deeper core section the MSA− concentrations are highest during the winter period, as shown by nssSO42 winter minima. The change in the location of MSA− from the summer layer to the winter layer occurs at varying depths and times before drilling in ice cores from various locations in the Antarctic.
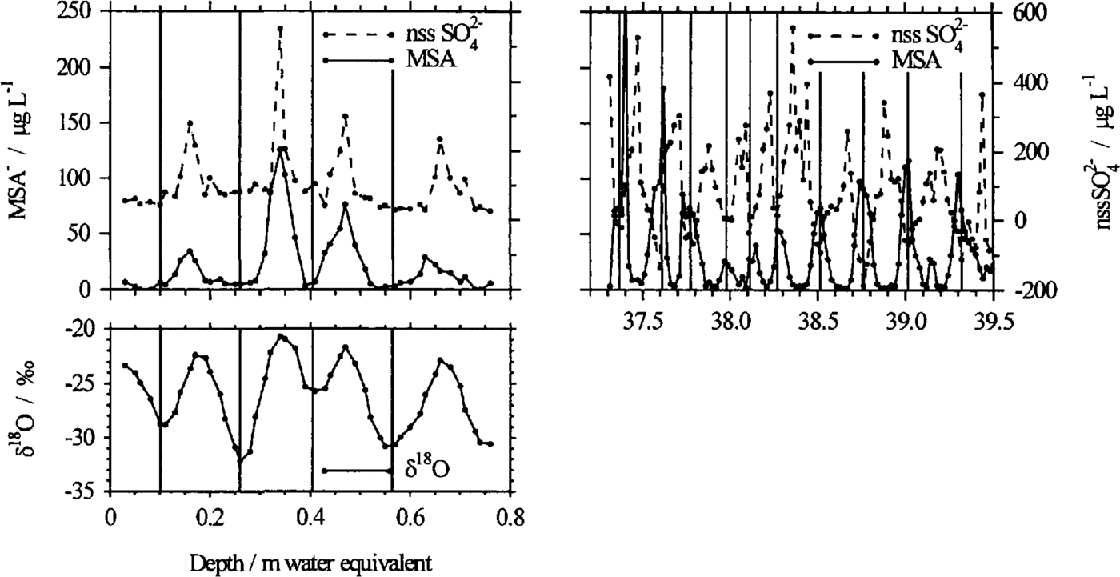
Fig. 1. Anion profiles from near the surface and at depth in ice cores collected from Berkner Island (78° 18′ S, 46° 17′ W). The near-surface MSA and nssSO42− have maxima in the summer, when the oxygen isotope signal, δ18 O, is also at a maximum. Deeper in the core, MSA and nssSO42− are out of phase, with MSA reaching a maximum in the winter layer. Isotope data are not available for this section.
In the study reported here, the aim is to investigate the phenomenon of the change in seasonal location of MSA− in Antarctic cores, by trying to mimic the conditions under which the change takes place under controlled conditions.
Experimental
The firn-core sections used for this experiment were from the Dyer Plateau (70°31 ′S, 65°01 ′W) on the Antarctic Peninsula, from a depth of 10 m from the surface. This section was chosen because the Dyer Plateau has relatively low MSA− concentrations (average 8 μg L1) and there would therefore be little interference from background levels.
Two 10 cm lengths of core were taken and the outer surfaces removed with a clean scalpel. Both lengths were then cut vertically into four sections with a band-saw (Fig. 2). Each section weighed approximately 100 g. One section from each core length was used as a blank and was sealed in pre-cleaned layflat tubing and stood vertically in an insulated Perspex core holder. 0.5 mL of solution containing the sodium salt of MSA− (10 mg L−1) and potassium salts of F− (10 mg L−1), NO3− (10 mg L−1), Cl (60 mg L1) and SO42− (60 mg L1) was pipetted onto the top of the three remaining core sections. This volume and concentration were chosen to give an approximate mean concentration similar to that seen in coastal ice cores, of 300 μg L−1 Cl− and SO42− and 50 μg L−1 each of F−, NO3− and MSA−, if mixed with the full 100 g of liquid in each section: this is used later to test the conservation of the ions after storage (Table 2). The solution was added dropwise over the full cross-section (apart from the outer 2 mm) to minimise immediate percolation. Each of the two firn-core lengths was treated in the same manner. These sections were then sealed in polyethylene tubing and stored vertically and in the same orientation as the blanks. The firn sections were labelled 1a–d and 2a–d, where la and 2a were blanks and 1b–d and 2b–d were the doped samples.
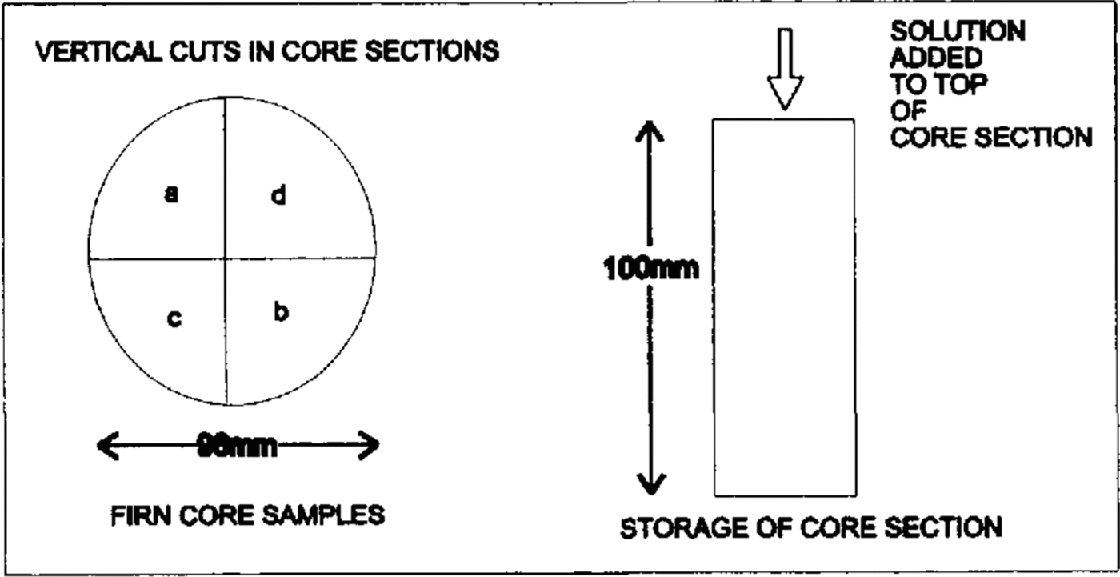
Fig. 2. Method of cutting and doping the samples.
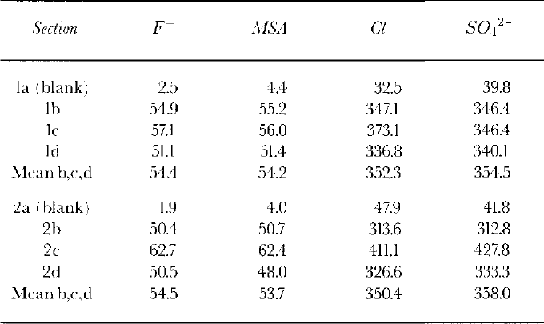
Table 2. Overall budget of anions (μg L1) calculated by summing the concentrations for each subsample
The ice-core sections were stored for 8 months at a range of temperatures, which were recorded using an electronic temperature logger. The blank (1a and 2a) and one of the doped sections (1b and 2b) were stored in a cold room at nominally –22°C (actual range –25° to –20°C). Figure 3 shows the temperature variations over a 1 day period, and for this cold room the two spikes in temperature represent defrost cycles for the freezer unit. Samples 1c and 2c were stored in a cold room at nominally –10°C. The fluctuation in temperature in this cold room is quite high, with variations from –11° to 5°C (Fig. 3). Samples 1d and 2d were stored in a chest freezer at –5°C; the temperature in this freezer was relatively constant (Fig. 3). For a period of 10 weeks during the 8 months, this freezer was required for other purposes, and the samples were then stored at –22°C.

Fig. 3. Typical temperature regimes experienced by the firn sections during the 8 month storage period. A: –5° C chest freezer, measured at 10 min intervals (samples 1d and 2d); B: –10°C cold room, measured at 5 min intervals (samples 1c and 2c); C: –22°C cold room, measured at 40 min intervals (samples 1a, 1b, 2a and 2b).
At the end of the 8 month storage period, the core sections were cut into 1 cm samples, with cuts made parallel to the upper doped surface, and melted for analysis. Analyses were carried out on a Dionex ion chromatograph, using AG11/AS11 columns, a degassed hydroxide eluent and a gradient pump, using a 500 μL sample volume. During all cutting, doping, subsampling and analytical work, full clean-room clothing including face mask and polythene gloves were worn to avoid any contamination of the samples. The melting containers were all pre-cleaned several times with 18 MΩ cm water.
Results
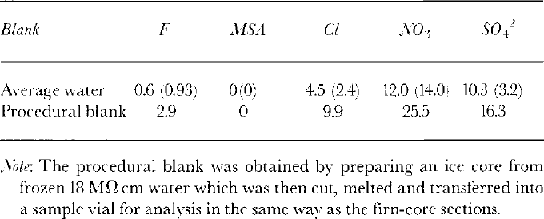
Table 1 shows the blank concentrations measured for several pure water samples and a procedural blank from an artificial ice core made from frozen pure water which was processed in the same way as the samples. The concentrations for nitrate were high and variable, so these data are not presented here. In Table 2, we calculate a full budget of the analytical results from each sample and we note that we can account for the full amount of introduced dopant; none was lost from the stored ice sections.
The results of the two series of doped and blank firn samples are shown in Figure 4: the results for series 1 and 2 are almost identical. If the dopant remained confined to the uppermost sample, we would expect concentrations of 3000 μg L−1 for Cl− and SO42−, and 500 μg L−1 for F− and MSA− in this sample. In all three doped sections, Cl− and SO42− have high concentrations in the top sample (similar to the value expected if the dopant remained in this sample) and then concentrations drop to background levels in second and subsequent samples. We conclude that none of the added anion solution percolated more than 1 cm though the core sample at any of the storage temperatures. F shows a high concentration in the top sample, and a concentration above the level of the blank in the second sample for the sections stored at 10° and 5°C. The third sample, which is 20–30 mm from the top, shows the doped samples at the same concentrations as the blank, and therefore represents the lower limit of percolation through the core section.
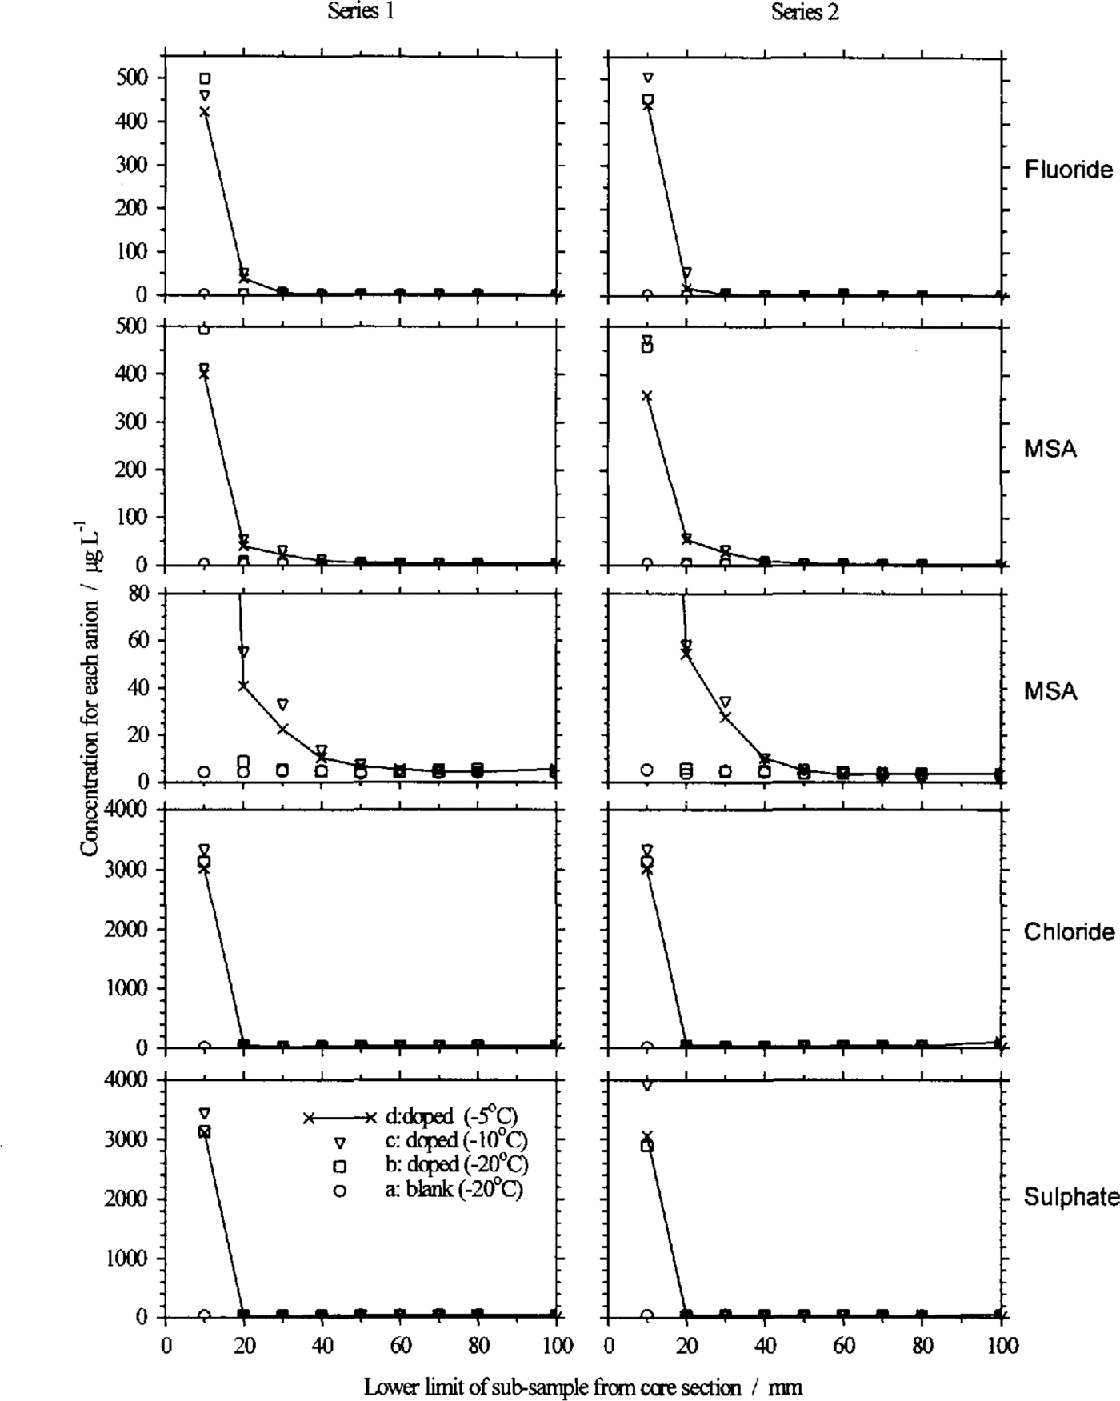
Fig. 4. Blank corrected anion profiles along the two series of doped fun sections: symbols for all panels are defined at lower left; connecting lines through symbols are omitted for clarity from all except sections d; subsample 0–10 mm plotted at 10 mm on the abscissa, etc. For Cl and SO42 the added solution remains in the top 10 mm sample. For F− there is higher concentration in the second sample (10–20 mm) as well as the top sample. However, the most pronounced change is in the MSA profile of the sections stored at 10° and 5°C (shown here at two scales for clarity), with higher than background MSA in the top four samples.
The result for MSA− shows a greater change: the top four samples all have concentrations higher than the blank at –5° and –10°C. This shows that some of the MSA added to the top of the core section has migrated up to 40 mm over the 8 month period. This is an important result: it confirms that a winter maximum in MSA− could be due to the migration of MSA− in firn from the summer to winter layers and not due to deposition of MSA− during winter months. Even at cold polar sites, summer temperatures in the upper few-metres of the snowpack can be as warm as –5°C, making this result generally relevant.
Discussion
The most significant feature of the data shown in Figure 4 is the obvious change in the MSA− signal below the doped surface. This change does not occur in the sample which was stored in the –22°C cold room (section b), but does occur in the core sections stored at –10°C (c) and –5°C (d). Temperature therefore clearly has some inf1uence over the movement of MSA−. The MSA− in core section c appears to show a slightly greater degree of relocation than d which was stored at a warmer temperature with occasional periods at –22°C, but we can draw no conclusion from this. Despite no observation of MSA− migration in the samples stored at –22°C, it is clear from the Berkner Island data that migration can occur at a site where the temperature measured at 10 m (approximating to the mean annual air temperature) is about –24°C. At this site, migration is observed in the upper 10 m where summer temperatures are higher than the mean annual temperature, but is observed to continue below 10 m where the ice remains colder than –22°C. Presumably, the time-scale for migration is longer at lower temperatures.
We can speculate on the migration process. During snowfall, impurities can be incorporated by nucleation scavenging, where aerosol particles act as condensation nuclei, or by within-cloud and below-cloud scavenging where particles and gases collect on the growing snowf1ake. Fresh snowfall can therefore hold impurities both within the ice structure and on the surface. During burial, however, re-crystallisation forces some impurities to the boundaries of the growing snow grains. In a study of natural ice in an analytical scanning electron microscope, Reference Mulvaney, Wolff. and Oates.Mulvaney and others (1988) showed that in an Antarctic ice sample sulphuric acid was located at the boundaries of grains. They concluded that this acid must be liquid at ice-sheet temperatures since sulphuric acid remains liquid as the composition follows the freezing-point curve of sulphuric-acid/water mixtures. At decreasing temperatures, water is lost from the mixture until it finally freezes at the eutectic temperature of –73°C. MSA (the form in which MSA− is deposited on the ice sheet) is a similar strong acid, with a similar freezing curve in dilute solutions (reproduced in Fig. 5), and a eutectic temperature of below –70°C. We propose that MSA is also located as a dilute liquid at the grain boundaries in the ice sheet.
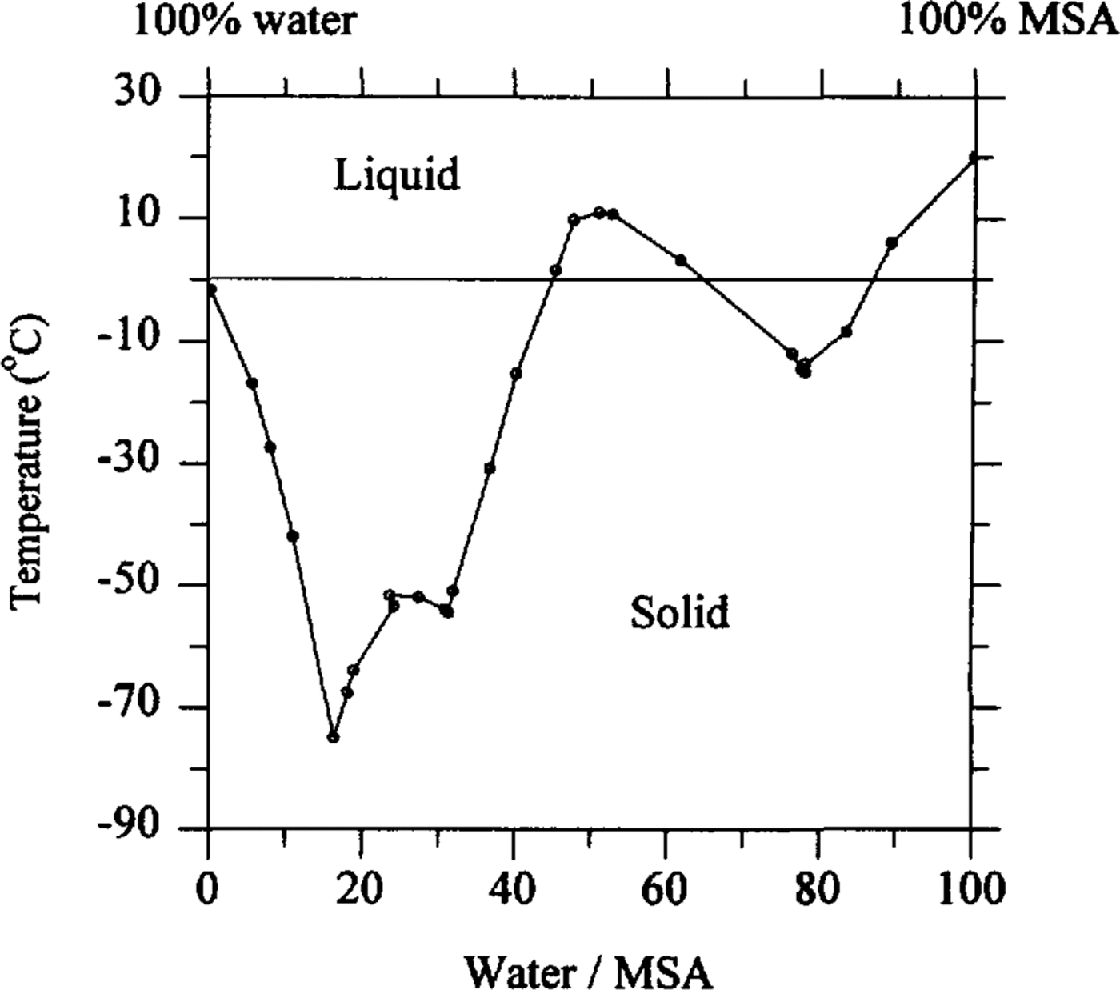
Fig. 5. Freezing curve for MSA/water mixtures. Data from Stephen and Reference Stephen and Stephen.Stephen (1963, p. 374).
Table 1. Blanks showing anion concentrations (μ g L−1 (std. dev., σ) ) attributable to sample handling and analysis
One possible migration mechanism may be by drainage of the liquid, depending on the temperature. As can be seen from the freezing-point curve, as the mixture cools, water is frozen out of the mixture, leaving a decreasing volume of increasingly concentrated MSA. The limit at which the MSA migrates at a given temperature must depend on the grain-size and firn porosity, with capillary action acting against drainage of the liquid. For the same grain structure, at warmer temperatures, ice melts into the acid liquid to follow the freezing curve until a point is reached when drainage overcomes the capillary support, and migration of the MSA takes place. (This is similar to the springtime acid-flush event observed in temperate snowpacks.) An alternative temperature-dependent mechanism that we cannot discount from our experiment would be transport of MSA through the vapour phase, with the rate dependent on the vapour pressure at the experimental (or, by implication, the ice-sheet) temperature. However, if vapour transport were involved, then we might have expected to lose some MSA completely from the porous firn. Table 2 shows that this did not occur, with all the introduced dopant conserved in the final cut samples after storage.
While drainage could explain the migration of MSA− within ice, it does not explain why MSA− preferentially migrates to the winter layer in natural ice, implying that the migration is not driven by a concentration gradient. This is likely to reflect an interaction of the MSA− ion with cations in the ice that are already located in the winter layer. However, we have not defined the candidate cation in our ice-core data from sites where migration to the winter layer is clear.
Some questions remain to be answered. In our experiment, we used a sodium salt of MSA — is this a good analogue for natural Antarctic ice? We plan similar experiments with the pure acid. Why does MSA migrate in ice cores, but apparently not sulphuric acid? Presumably this is due to the detailed physical chemistry of the two species and their interaction with ice. Finally, what limits the movement of MSA− to the winter layer as observed in natural ice cores?
Conclusions
In this simple experiment, it has been demonstrated that MSA moves within firn even after a period of only 8 months at temperatures of –10°C and above. This confirms that the winter MSA− peaks which have been recorded in some ice cores could be due to migration of MSA in firn. The mechanism for this process appears temperature-dependent, and we suggest a mechanism based on the drainage of liquid MSA through the firn, but cannot discount the possibility that vapour transport is involved.
This experiment is continuing. At the same time as the two sequences of doped samples and blanks described here were prepared, four further sequences were prepared in an identical manner. It is hoped that doped core samples will be measured each year for 4 years (so that the final core sections analyzed will have been in storage for 5 years after doping) to see if the MSA− migration continues in a linear way and to see if any migration occurs at –20°C over longer time periods. We also plan further experiments to differentiate between diffusion and drainage.
MS received 3 September 1997 and accepted in revised form 18 October 1998


