


 at a depth of ~25 m near the center of the glacier in July 1985. The shear took place in the zone in which cold ice near the surface gives way to temperate ice deeper in the glacier.
Introduction
Reference ForbesForbes (1846) and, independently and effectively simultaneously, Reference AgassizAgassiz (1847, p. 447–53) found that flow rates on the Mer de Glace and Aar (Unteraargletscher) glaciers, respectively, were greatest near the center line and decreased toward the margin. This supported the then controversial viscous model of glacier flow. A consequence of the viscous model is that, in the absence of significant changes in the stress field, the pattern of variation in velocity with depth, or the deformation profile, should not change. We have known since the early 1840s (Reference ForbesForbes, 1846; Reference AgassizAgassiz, 1847, chapter 12) that temperate glaciers move faster in the summer. This acceleration is normally attributed to a decrease in coupling at the bed, which would most probably result in a change in the stress field. The consequences of this for changes in deformation profiles have not been explored. Thus, in previous studies, with the exception of the measurements of Reference Hooke, Holmlund and IversonHooke and others (1987), deformation profiles have not been measured at frequent enough intervals or with sufficient accuracy to detect such changes.
In this paper we describe deformation measurements in three boreholes in Storglaciären, a small valley glacier in northern Sweden. Near the middle of its ablation area, Storglaciären flows over a riegel, or transverse bedrock ridge (Fig. 1). Deformation was measured in 1985 in borehole 85-2 located ~300 m up-glacier from this riegel and approximately on the glacier center line, and in 1987 and 1988 in boreholes 87-1 and 88-4, respectively, located up-glacier from the riegel and ~250m north or south of the center line (Fig. 1).

Fig. 1. Map of the ablation area of Storglaciären showing surface and bed topography, and locations of boreholes and movement stakes discussed here. Stippled pattern shows areas where ice is inferred to be frozen to the bed (Reference Holmlund and ErikssonHolmlund and Eriksson, 1989).
Previous Work on Storglaciӓren
Although a photographic record of Storglaciären extends back to ~1880, modern scientific studies on it began in 1946 when (Reference SchyttSchytt 1959, Reference Schytt1981) initiated the still continuing mass-balance measurements. Recent papers have discussed its bedrock topography (Reference BjörnssonBjörnsson, 1981), mass balance (Reference HolmlundHolmlund, 1987, Reference Holmlund1988), surface deformation and flow (Reference Hooke, Brzozowski and BrongeHooke and others, 1983b, Reference Hooke, Calla, Holmlund, Nilsson and Stroeven1989; Reference Jansson and HookeJansson and Hooke, 1989), temperature regime (Reference Hooke, Gould and BrzozowskiHooke and others, 1983a; Reference Holmlund and ErikssonHolmlund and Eriksson, 1989), internal drainage (Reference Hooke, Miller and KohlerHooke and others, 1988; Reference Seaberg, Seaberg, Hooke and WibergSeaberg and others, 1988), and the previously mentioned borehole deformation measurements made in 1984 (Reference Hooke, Holmlund and IversonHooke and others, 1987).
The 1984 borehole measurements suggested the presence of extrusion flow over the riegel. Shear stresses at the bed appeared to be negligible, and it was inferred that the balance of forces was, instead, achieved through a combination of drag on the valley sides and compression against the riegel. As the uppermost 30–40 m of the glacier in the ablation area are below the melting point (Reference Hooke, Gould and BrzozowskiHooke and others, 1983a, Fig. 4; Reference Holmlund and ErikssonHolmlund and Eriksson, 1989; and unpublished data), the glacier is believed to be frozen to the bed where it is less than this thickness. This should provide more than the normal amount of drag on the valley sides. The present study was undertaken, in part, in an attempt to find more “normal” deformation profiles, and in part to investigate the increase in the transverse component of flow with depth, first described by Reference RaymondRaymond (1971).
Experimental Procedure
Inclinometry
Our boreholes are drilled with a hot-water drill and cased with a 40 mm (1985 and 1987) or 50 mm (1988) square aluminum tubing. Joints between the 5 m long casing sections are sheathed in snuggly fitting sleeves that are cemented to one casing section and riveted to the other. Data on the dates the holes were drilled, cased and surveyed, and on ice thicknesses at the sites are given in Table 1.
Table 1. Data on boreholes

Deformation was measured with a Slope Indicator Company biaxial digitilt inclinometer. Wheels mounted on this instrument keep it oriented across a diagonal of the square casing. Sensors detect the inclination to 1 part in 10 000, and this information is displayed in digital form at the surface. There are two sensors in the instrument, mounted at 90° with respect to one another, so the inclination in two mutually perpendicular directions is obtained at each depth. Measurements are made at 1 m depth intervals.
In principle, only one run down a hole is necessary to determine the profile of the casing. To eliminate collimation errors due to drift in the zero setting, however, two runs are recommended, with the instrument rotated 180° between measurements. We normally make four runs, thus providing enough redundancy to eliminate bad measurements due to errors in recording the reading, determining the depth and so forth. Based on an analysis of the reproducibility of the measurements, Reference Hooke, Holmlund and IversonHooke and others (1987) estimated that they could determine the position of the bottom of a 130 m hole with respect to the top to within ±20 mm. The standard error for a comparable hole in the present experiment is slightly larger, say ~ ±30 mm, because we used a different casing. While significantly less than the deformation recorded between any two surveys, this uncertainty is comparable to the changes in the deformation profiles from one pair of surveys to another.
Not considered in the above error estimate is the possibility of twisting at joints between casing sections or of individual sections of the casing. An analysis of this problem (Appendix A) suggests that, with one exception (Appendix B), such twisting was probably not significant in the three holes discussed here.
Another source of error is movement of the casing independently of the ice. The diameter of the boreholes was about 0.2 m at the surface, and probably 0.1 m a few meters above the bed. At the bed, they may have been somewhat larger, as the drill was normally held there for several minutes. The casing diagonal was 0.05 m (1985 → 1987) to 0.07 m (1988), so movement of the casing independently of the ice is inevitable. However, this movement should decrease with time as the casing stabilizes in the hole. Initially, it could be responsible for as much as 0.2 m of relative movement of the top of a hole with respect to the bottom, which is an appreciable fraction of the total deformation.
As a result, presumably, of movement of the casing within the holes, deformation profiles were quite noisy. We have therefore fitted polynomials to the profiles in both the transverse and down-glacier directions, using least-squares techniques. Initial experiments with the curve-fitting routine suggested that adding terms above fifth order resulted in curves that began to reflect characteristics that we interpreted to be noise rather than ice deformation. Thus, only curves up to fifth order were tested.
Errors due to twisting or movement of the casing within the hole could be so large as to make our deformation profiles totally unrealistic. Thus, the fact that only one of our 13 profiles (Fig. 2a, survey interval II, discussed below) appears to violate basic physical principles is reassuring, and suggests that the standard error derived from the reproducibility of the inclinometer data alone is a realistic estimate of the uncertainty in the profiles.

Fig. 2. Perspective views of deformation profiles at the top, followed by plots of water discharge at the terminus, “staircase” plots of the mean horizontal and vertical velocity of nearest strain net (solid lines), the horizontal velocity of borehole top and bottom, and the vertical strain rate at the surface in the strain net. Dates of inclinometer surveys are shown at top and by vertical lines extending upwards from abscissa at bottom. In perspective plots, surface-velocity vectors are projected on to the bed ( short heavy arrows) to facilitate comparison with basal velocity vector. Error bars on the sliding velocity reflect only the uncertainty resulting from reproducibility of the inclinometry data. They do not reflect possible contributions from twisting or movement of the casing independently of the ice. a. Borehole 85–2. b. Borehole 87–1. c. Borehole 88–4.
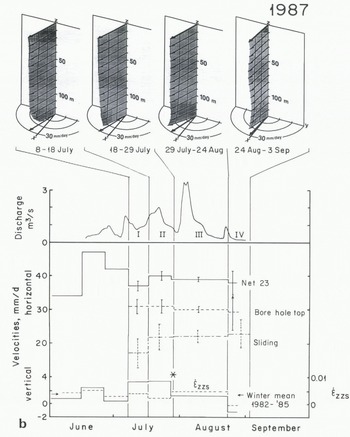
Fig. 2.
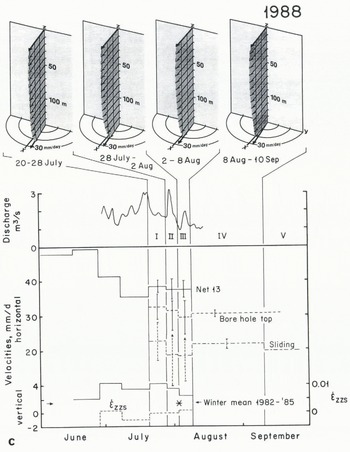
Fig. 2.
Other measurements
Velocities of nine or ten stakes, arranged in either two square (1985–87) or three triangular (1988) strain nets, were determined using standard electronic surveying equipment (Reference JanssonJansson, in press, thesis in preparation). The positions of the stakes were overdetermined, permitting use of a least-squares technique to calculate horizontal coordinates. Corrections for refraction were based on measurements of the vertical angle to a fixed point on the valley side during each survey. With these techniques, the uncertainty in the velocities is estimated to be < ± 2 mm d−1 over time periods of 2 weeks, the average length of time between inclinometer surveys. In 1987, similar though slightly less precise measurements were made on a strain net surrounding the borehole (Fig. 1) (Reference RydénRydén, unpublished).
These velocity measurements were interpolated or extrapolated to estimate displacements of the tops of the boreholes between surveys, a quantity that is needed to determine the movement at the bed. This procedure was adopted rather than surveying to the tops of the boreholes directly, in part because some holes were not readily visible from the survey points in use, and in part because ice plugs had to be melted from the top few metres of the holes at the beginning of each inclinometer survey. This melting left the top of the casing loose in the hole, although it was frozen in at greater depths.
To avoid errors in the deformation profiles as a result of the repeated thawing just mentioned, we assumed that there was no deformation in the top 8 m of the glacier. The inclinometer measurements made in this part of a borehole during the first survey were thus used in all subsequent surveys.
Water discharge from the glacier was measured with stage recorders located at weirs on the two main streams draining the glacier (Fig. 1) (Reference KohlerKohler, 1992). The weirs were calibrated using dye-dilution techniques.
Results
Deformation profiles are shown in Figure 2, together with the water discharge, the mean horizontal and vertical velocity of strain net 23 (Fig. 1), or of its 1988 replacement, net 13 (not shown in Figure 1), the horizontal velocity of the hole top for 1987 and 1988 when the borehole was some distance from net 23, the sliding velocity, and the vertical strain rate at the surface, ![]() , calculated from the strain-net data. In the perspective plots at the tops of these figures, the surface velocity vector is projected on to the bed (shorter heavy arrow) to facilitate comparison with the basal velocity.
, calculated from the strain-net data. In the perspective plots at the tops of these figures, the surface velocity vector is projected on to the bed (shorter heavy arrow) to facilitate comparison with the basal velocity.
We will first deal with the anomalous deformation of Borehole 85–2 in late July 1985 (Fig. 2a). Then we discuss first the longitudinal and then the transverse deformation revealed by the remaining profiles.
Borehole 85–2; 18–29 July
In late July a pronounced transverse flow seems to have occurred below ~25 m in Borehole 85–2. This is essentially the depth at which the frozen surface layer gives way to deeper temperate ice. The transverse flow lasts only a short time; it is not present during the third and fourth survey intervals. The total transverse displacement between 26 and 56 m was ~0.27 m.
Also peculiar during this survey interval is the 0.1 m apparent up-glacier movement of the bottom of the casing. In Appendix B, we argue that this cannot reflect errors in our measurements. Although it could reflect movement of the casing in an oversized hole, the casing, by this time, had had < 10 d to stabilize.
As discussed in greater detail in Appendix B, our preferred explanation for this anomalous apparent negative velocity is that a transverse shear of ~0.3 m occurred near the base of the frozen surface layer, and that, perhaps due to drag on the bed, the casing below this layer was twisted ~20° clockwise.
Such twisting would have a minimal effect on deformation profiles during subsequent survey intervals, so long as the twisting did not continue. However, the velocity at the bottom of the borehole during these later surveys would appear to be rotated clockwise from its true direction. Thus, the true sliding vector, rather than being essentially parallel to that at the surface as shown in Figure 2a, may actually have diverged somewhat to the north as it did during the first survey interval. This would be consistent with the local bed topography (Fig. 1).
Longitudinal Deformation
Of principal interest in the longitudinal flow is the partitioning between internal deformation and basal sliding. Thus, the percentage of the surface velocity that could be accounted for by deformation between a depth of 10 m and the deepest point reached by the inclinometer during most of the surveys was determined. The balance is the fraction of the surface velocity attributable to sliding and to deformation within the basal layer of ice (Table 2, next to last column).
Table 2. Rales of surface displacement and internal deformation.
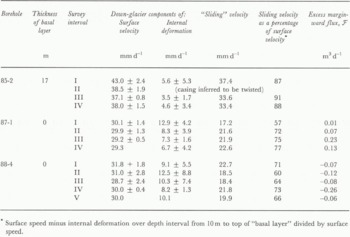
Deformation in and below the basal layer accounted for ~90% of the surface movement at the site of Borehole 85–2, whereas at the sites of the boreholes nearer the margins it accounted for only 60–80% of the surface movement. Unfortunately, the inclinometer would not go below 145 m during the third survey of Borehole 85–2, so in this case the “basal layer” is rather thick. However, during the first survey interval in this borehole, deformation between 145 m and the bed at 162 m accounted for only 6% of the surface movement. Thus, it still seems safe to conclude that sliding was greater at this location. This is consistent with the findings of Reference RaymondRaymond (1971) on Athabasca Glacier, where annually averaged sliding accounted for about 84% of the surface speed at the center of the glacier, and 77% half-way to the margin. On Storglaciären, the corresponding mean values for the summer periods, adjusted for deformation in the bottom 17 m in the case of Borehole 85–2, are ~85% and ~70%, respectively.
Borehole 88–4 is the only one which we have succeeded in measuring during the melt season following that in which it was drilled (Fig. 3). The sliding speed during the winter is essentially the same as that during the summer, a fact that is consistent with the small variation in speed during the summer at this location in 1988.

Fig. 3. Deformation profile of Borehole 88–4 between 10 September 1988 and 2 August 1989.
Transverse Deformation
In the ablation zone of a valley glacier, velocity vectors diverge towards the nearest margin. This divergence commonly increases with depth. Reference RaymondRaymond (1971) was the first to measure such deformation profiles and to demonstrate that such flow was necessary for continuity. The horizontal velocity, u, decreases toward the margins, but the ablation rate is normally more-or-less uniform along a transverse profile. Thus, unless the vertical velocity, w, increases toward the margins, the emergence velocity, ve = w + u tan β where β is the slope of the glacier surface, measured as positive in the down-glacier direction, will be less than the ablation rate there. This is why transverse profiles of glaciers are convex upward in the ablation area; the lateral slopes toward the margins drive the transverse flow that leads to the higher ws there. We have measured this difference in w previously on Storglaciären (Reference Hooke, Brzozowski and BrongeHooke and others, 1983b).
The transverse flow at the tops of Boreholes 87–1 and 88–4 is always towards the nearest margin. In Borehole 87–1, the magnitude of this transverse flow increases with depth. However, in Borehole 88–4, it initially decreases with depth. Then below about 120 m during survey intervals I and II, the vector rotates outward so that at the bed the transverse flow is greater than at the surface. However, in the last three survey intervals, the decrease with depth continues all of, or nearly all of, the way to the bed.
The transverse flow in Borehole 88–4 is weak in comparison with that in Borehole 87–1. This is surprising, considering the convexity of the transverse surface profile through Borehole 88–4. It may reflect the fact that Borehole 88–4 is closer to a steep valley side than is Borehole 87–1 (Fig. 1). Alternatively, or in addition, it is noteworthy that due to drifting the equilibrium line swings well down-glacier along the north margin above Borehole 88–4. Thus v e decreases from ≈+3.9 mmd−1 at stake 188 near the center line to ≈−1.5 mmd−1 at stake 1984 (Fig. 1).
Water Drainage Through the Over-Deepening
Relevant to our interpretation of the above observations is the fact that the main drainage system through the overdeepening on Storglaciären is known to be englacial (Reference Hooke, Miller and KohlerHooke and others, 1988; paper in preparation by R. LeB. Hooke and V. A. Pohjola). We believe that this is because the viscous energy dissipated by water flowing up the adverse bed slope from the overdeepening is either insufficient or only barely sufficient to warm the water as rapidly as the pressure-melting temperature increases. Theoretical analysis suggests that water pressures become very high under these conditions and freezing may occur in the subglacial conduits (Reference RöthlisbergerRöthlisberger, 1972, p. 186). Observed water pressures on Storglaciären approach the overburden pressure (Reference HookeHooke, 1991). They are particularly high in early July and, while remaining high, decrease gradually during late July and early August (Reference HookeHooke, 1991).
Presumably, as a consequence of the lack of significant subglacial drainage that would flush sediment from the glacier sole, a discontinuous layer of subglacial till appears to have accumulated in the overdeepening (Reference Brand, Pohjola and HookeBrand and others, 1987; Iverson, unpublished; Paetz, unpublished). Dye-trace data suggest that a subsidiary drainage exists between the ice and the till but water is released from this zone only sporadically and in small quantities.
Discussion
Longitudinal Deformation
If the stresses causing internal deformation did not vary, the amount of such deformation would be constant, independent of time, and the surface velocity would vary directly with the sliding velocity. Stresses causing internal deformation probably do vary significantly and are likely to be responsible for at least some of the variations in our measured deformation profiles through time. However, the uncertainties in our measurements are too high to make an unequivocal case.
It is widely recognized that increases in subglacial water pressure cause increases in sliding speed and hence in surface velocity. Early in the melt season, water pressures are likely to be high when water discharge from the glacier is high, whereas later, conduits become more open and high water fluxes may not lead to high pressures. The present data provide modest support for this process. In 1985, high speeds are associated with the high discharge during survey interval I but not with that during survey interval III (Fig. 2a). In 1987, increasing water fluxes during survey intervals II and III are associated with increases in speed of strain net 23 and higher sliding speeds at the site of Borehole 87–1. In 1988, high surface speeds occurred well before initiation of the discharge and borehole-deformation measurements, and the high discharges immediately preceding and extending into survey interval I and in survey interval II are not strongly reflected in the velocity records.
Transverse Deformation
To a first approximation, glacier ice can be considered to be incompressible. Thus, changes in either longitudinal or transverse strain rate, if not compensated by other changes, should be reflected in the vertical velocity, w, near the glacier center line.
We have observed a systematic increase in w in the vicinity of strain net 23 in every melt season during which we have made detailed measurements: namely 1981–88 (Fig. 2; Reference Hooke, Brzozowski and BrongeHooke and others, 1983b, Fig. 4, Reference Hooke, Calla, Holmlund, Nilsson and Stroeven1989, Fig. 3b). In the years through 1983, this increase began in mid-July and ended by late August. In 1984 and in the years covered by the present study (Fig. 2), it often appears to have occurred earlier, starting in mid- to late June and ending by early to mid-August, sometimes with interspersed periods of lower w, and to have become smaller in magnitude.
While greatest in the vicinity of strain net 23, these changes in w occur as far up-glacier as strain net 19 (Fig. 1). They thus occur over a horizontal distance equivalent to 5–10 times the ice thickness. Reference Balise and RaymondBalise and Raymond (1985) suggested that perturbations at the bed responsible for such anomalies at the surface are likely to occur over an area that is less than, but the same order as, the area of the perturbation at the surface. They further found that the amplitudes of the anomalies at the surface are less than those of the perturbation at the bed. To the extent that the vertical perturbations at the bed are caused by variations in longitudinal or transverse strain, this implies, in our case, an increase in the vertical strain rate,
Reference Hooke, Calla, Holmlund, Nilsson and StroevenHooke and others (1989) found that they could not account for the increases in w by changes in speed along the bed, which here slopes upward towards the riegel, or by changes in strain rate if strain rates at the surface are assumed to be representative of those at depth. They attributed the increase in w to a seasonal increase in ![]() >with depth, occasioned by a combination of an increase in longitudinal compression and a decrease in transverse extension in the deeper ice.
>with depth, occasioned by a combination of an increase in longitudinal compression and a decrease in transverse extension in the deeper ice.
The present data provide some support for this interpretation. To illustrate this, we have plotted (Fig. 2) the vertical strain rate at the surface,
There are two times when such changes are observed. They are identified by *s in Figure 2b and c. In the best example (Fig. 2b), the high vertical velocities in July 1987 were not accompanied by a high ![]() Then, in August (survey interval III) the excess marginward flux tripled and w decreased significantly, despite an increase in
Then, in August (survey interval III) the excess marginward flux tripled and w decreased significantly, despite an increase in ![]() In 1988, the case is not as clear. However, between survey intervals II and III,
In 1988, the case is not as clear. However, between survey intervals II and III, ![]() increases while w decreases, a pattern which is consistent with the slight decrease in transverse ice flux towards the center line. However, the changes in all of these quantities are small, so the evidence is not compelling.
increases while w decreases, a pattern which is consistent with the slight decrease in transverse ice flux towards the center line. However, the changes in all of these quantities are small, so the evidence is not compelling.
These changes in marginward flux are attributed to the influence of bed topography on the flow field. As the velocity increases, the converging bed contours above the riegel counter the normal tendency towards transverse extension. In combination with enhanced compression against the riegel, this would increase w, particularly in the vicinity of strain net 23.
Based on estimates made by Reference Hooke, Calla, Holmlund, Nilsson and StroevenHooke and others (1989, p. 242–43), temporal changes in F of ~0.25 m3d−1, averaged over the distance from strain net 19 to the riegel, would be sufficient to explain the observed pattern of change in w. The largest changes in F should occur close to the riegel where convergence of the bed contours is greatest. Thus, the smaller changes observed in Boreholes 87–1 and 88–4 (Table 2) are of a magnitude that is consistent with Reference Hooke, Calla, Holmlund, Nilsson and StroevenHooke and others’ (1989) estimate.
One might expect that the influence of the bed on the flow would be greatest when basal drag was least. For example, in 1985 sliding, as a percentage of the surface velocity (Table 2), varied in phase with w (Fig. 2). However, in 1987, reduced drag at the bed was accompanied by lower w during survey intervals III and IV. Possibly, deformation is, at times, strongly influenced by local conditions near the bed while responding to global conditions far from the bed. Also possibly relevant is the fact that maxima in vertical velocity systematically lag those in horizontal velocity by a month or so (Fig. 2; Reference Hooke, Calla, Holmlund, Nilsson and StroevenHooke and others, 1989, Fig. 2).
To reconcile these various observations, we hypothesize that, early in the melt season, high water inputs to the constricted winter glacial drainage system result in high water pressures and vigorous accelerations of the glacier (Reference Hooke, Calla, Holmlund, Nilsson and StroevenHooke and others, 1989). The principal area of water input to the overdeepening is the crevasse field up-glacier from its head. Force-balance calculations suggest that, initially, reduced coupling at the bed is probably restricted to locations just down-glacier from this area (Reference Hooke, Calla, Holmlund, Nilsson and StroevenHooke and others, 1989, p. 243) but, due to longitudinal coupling, the increase in surface speeds is more widespread. The area of reduced basal coupling gradually expands down-glacier and laterally. As it nears the reigel, the period of high vertical velocities is initiated because basal ice there becomes more responsive to the bed topography. Lateral expansion of the zone of reduced coupling to the sites of the laterally situated boreholes may lag the down-glacier expansion. Reduced coupling at the riegel permits improvement in the secondary subglacial drainage system, leading to the observed decrease in water pressure and also to a decrease in the sensitivity of the glacier to changes in water input. Later in the melt season, the zone of reduced basal drag may expand over the riegel. Finally, further reductions in water input and pressure lead to a gradual increase in basal drag. The transverse flow field could return to its normal pattern in response to either of the last two processes. Reference Hooke, Holmlund and IversonHooke and others (1987, p. 77) suggested that one or both of these processes could explain the termination of the period of extrusion flow over the riegel mentioned earlier.
Attributing such seasonal changes in w to decreases in coupling and consequent changes in response of the glacier to bed topography is consistent with observations below the reigel. Here, vertical velocities tend to be more negative during the melt season, and calculations have suggested that, at least in part, this might be attributable to a seasonal increase in transverse extension at depth (Reference Hooke, Calla, Holmlund, Nilsson and StroevenHooke and others, 1989, p. 242). Here, bed contours diverge so such an increase is reasonable.
Diurnal uplifts
Data obtained with the use of sensitive tiltmeters suggest that diurnal increases in surface elevation occur near the middle of the glacier, in the vicinity of strain net 23 (Fig. 1), during periods of fair weather (Reference Jansson and HookeJansson and Hooke, 1989). In contrast to the situation described above, these events apparently can occur at any time during the melt season. Reference Jansson and HookeJansson and Hooke (1989, p. 205–07) thought that they might be a result of waves of high subglacial water pressure that migrated down-glacier and became focused by the riegel. It was inferred that the glacier was actually uplifted slightly by the waves. Based on the discussion in the present paper, however, it may be more reasonable to suggest that the diurnal variations in water input result in increased basal sliding and that the diurnal uplifts also reflect transverse squeezing of the ice by the converging bed contours over the riegel.
Conclusions
Due to the changes in basal coupling that are commonly believed to result from fluctuations in subglacial water pressure and perhaps from dilation of subglacial till layers, the stress field in glaciers must change during the melt season. Such changes probably have a significant effect on internal deformation profiles, particularly in areas with large-scale irregularities in bed topography. In such areas, seasonal changes in vertical velocity at the surface could be the principal manifestation of this influence. Where bed contours converged, the center of the glacier would experience higher vertical velocities during the summer, and conversely. At major bends in a valley, one might expect seasonally higher vertical velocities on the outsides of the bends.
On Storglaciären, we believe, our studies demonstrate that such changes in bed coupling do influence deformation profiles measurably. The measurements do not, however, demonstrate a one-to-one correspondence between basal coupling and the response of the glacier at the surface. This may be because the precision or spatial density of our observations is inadequate, or because longitudinal and transverse coupling and time lags complicate the interpretations, or both.
Acknowledgements
We thank G. K. C. Clarke and N. R. Iverson for comments on an earlier draft of this paper.
Primary support for this study was provided by the U.S. National Science Foundation (grants DPP-8414190, DPP-8619086 and INT-8712749) and the Swedish Natural Sciences Research Council. V.A.P. also gratefully acknowledges support for field work from Andree-fonden, Axel Hambergs testamentsfond, Bjurzons resestipendium, Crafoordska stiftelsen, Gertrude och Ivar Philipsons stiftelse, J. F. Wahlbergs minnesfond, Stiftelsen Lars Hiertas minne and Th. Nordströms fond. The inclinometer was purchased with funds provided by the Wallenberg Foundation in Stockholm.
The accuracy of references in the text and in this list is the responsibility of the authors, to whom queries should be addressed.
MS received 13 June 1991 and in revised form 3 December 1991
Appendix A Analysis of Potential Error Due to Twisting of Casing
Twisting of the casing would lead to uncertainty in the orientation of the casing diagonals at depth and, if the twisting were progressive with time, to error in our determinations of the changes in inclination in a given direction between surveys. Progressive twisting might occur if corners of the casing were pressed into the ice under a torsional force, resulting in regelation. In 1987, cylindrical sleeves, about 0.3 m long, were placed around the end of each section of casing. These sleeves held the corners of the casing away from the borehole walls, at least locally, and therefore may have inhibited twisting in the experiment that year.
To evaluate the potential for twisting of the individual casing sections, we calculated the twist that could be expected based on elastic deformation of the casing in torsion and bending. The latter enters the calculation because it determines the force with which a corner of the casing is pressed against the side of a borehole as the casing is bent, and this force times the moment arm determines the torsional moment applied. The length of the moment arm can be determined from knowledge of the orientation of the casing and the direction in which it is being bent. The amount of twisting increases with the ratio Et /E 1 where Et and E 1 are the elastic constants describing deformation in torsion and bending, respectively. Calculations with Et /E 1 = 200 in a 111m hole drilled and inclinometered in 1986 suggested that it would have twisted 1.4°. This borehole was chosen to test for twist because it was far from vertical; its bottom was displaced horizontally more than 40 m from its top. Subsequent measurements on the actual casing gave Et /E 1 = 37, so the cumulative effect of twisting of the individual casing sections is inferred to have been small, unless, of course, some other torque was applied to the casing. For example, a corner of the bottom of the casing might have become caught on a bedrock protuberance. The additional twisting at joints between casing sections was not evaluated quantitatively but, considering the construction of the joints, described above, it is not likely to have been large.
The effect of twisting on the recorded deformation profiles is proportional to the horizontal offset of the bottom of a borehole with respect to the top. The three boreholes discussed here were quite straight; the offsets ranged from 0.25 to 1.23 m (Table 1). Thus, we conclude that the contribution of twisting to uncertainty in deformation profiles in these boreholes was normally negligible. In the case of the 1986 borehole mentioned briefly above, however, it was not negligible, so this borehole is not discussed further.
Appendix Β Analysis of Anomalous Deformation in Borehole 85–2 During Survey Interval II
The up-glacier movement of the bottom of the casing during this survey interval cannot reflect an error in our measurements of the surface velocity, 38.5 mm d−1, as there were five stakes surrounding the borehole, one of which was quite close to it, and none of these stakes had velocities greater than 40 mm d−1 during this time interval. An error of this magnitude in the inclinometry is also unlikely, as an error in one survey would be reflected in the deformation profiles of both the preceding and the following surveys. The down-glacier component of the velocity became negative 20 m above the bed, which suggests the possibility of local influence from the bed, including movement of the casing in an oversized hole.
To visualize the effect of twisting on such a deformation profile, note that the inclinometer measures the direction cosines, lx′, and ly′
, describing the deviation of the casing from the vertical in an (x′, y′) coordinate system, that is rotated through an angle α from the global coordinate system used for the glacier (x,y), in which x is directed down-glacier and y is transverse and directed northward (Fig. 1). α is known at the surface because the orientation of the diagonals of the casing can be measured directly. However, if twisting has occurred, a is not known at depth. On the other hand, the direction cosine, lz
, which describes the deviation of the casing from the vertical, is given by ![]() . It is thus independent of α. Thus, the magnitude of the displacement of the bottom of the casing relative to the top is not affected by twisting, although the direction is.
. It is thus independent of α. Thus, the magnitude of the displacement of the bottom of the casing relative to the top is not affected by twisting, although the direction is.
In Borehole 85–2, on 29 July, the bottom of the hole at 159 m was offset 1.65 m horizontally from its position at 26 m. This is illustrated in Figure 4, which shows the locus of the casing between these two depths projected on to a horizontal plane. If α is assumed to be constant, independent of depth, the bottom of the casing would then appear to have moved 0.09 m up-glacier and 0.24 m southward between 18 and 29 July, while the top moved 0.40 m down-glacier and 0.01 m southward. The perspective plot in Figure 2a shows this apparent deformation. Say we assume, instead, that some clockwise twisting occurred just below 26 m between these two dates. Assume further that the longitudinal component of movement of the bottom of the casing during this time interval was 77% of that at the surface, or 0.30 m, as it was during the time interval between the first two surveys. As the horizontal offset between 26 m and the bottom must still be 1.65 m, the bottom would then be at the point labeled “corrected position” in Figure 4. This would imply a clockwise twist of about 20°. The total southward displacement of the bottom of the casing would then be 0.67 m instead of only 0.24 m. If the twist were distributed along the hole, the offset of the bottom with respect to the section at 26 m would be somewhat less than 1.65 m, but the qualitative effect would be the same.

Fig. 4. Locus of Borehole 85–2 between 26 and 159 m depth projected on to horizontal plane. Apparent up-glacier movement of bottom is inferred to be a result of twisting of the casing.
The effect of such twisting on deformation profiles during subsequent survey intervals would be less notice able, so long as the twisting did not continue. This is because twisting between two inclinometer surveys affects the calculated magnitude of the deformation vector as well as its azimuth, whereas a constant amount of twist over a survey interval affects only the azimuth.


