


Introduction
The 21st century has witnessed a dramatic increase in the quality, diversity, and availability of real-world data (RWD) such as electronic health records, health insurance claims, and registry data [Reference Rudrapatna and Butte1]. In 2016, as part of a strategy to improve the efficiency of medical product development, the US Congress passed the 21st Century Cures Act [2] that mandated the development of US Food and Drug Administration (FDA) guidance on potential regulatory uses of real-world evidence (RWE) – defined as “clinical evidence about the usage and potential benefits or risks of a medical product derived from analysis of RWD” [3]. Internationally, stakeholders including other regulatory agencies, industry, payers, academia, and patient groups have also increasingly endorsed the use of RWE to support regulatory decisions [Reference Shore, Gee, Kahn and Forstag4,Reference Burns, Roux and Kalesnik-Orszulak5]. Study designs that use RWD to generate RWE (referred to below as RWE studies) include pragmatic clinical trials, externally controlled trials or hybrid randomized-external data studies, and fully observational studies [Reference Baumfeld Andre, Reynolds, Caubel, Azoulay and Dreyer6–8].
There are multiple motivations for using RWD in a study. First, RWD has long been used in postmarket safety surveillance to uncover the presence of rare adverse events not adequately evaluated by phase III randomized controlled trials for reasons including strict eligibility criteria, strict treatment protocols, limited patient numbers, and limited time on treatment and in follow-up [Reference Lavertu, Vora, Giacomini, Altman and Rensi9]. Second, recent drug development efforts have more commonly targeted rare diseases or conditions without effective treatments [Reference Ringel, Scannell, Baedeker and Schulze10]. RWD can be useful in such contexts when it is not practical to randomize enough participants to power a standard randomized trial or when there is an ethical imperative to minimize the number of patients assigned to the trial control arm [11,Reference Jahanshahi, Gregg and Davis12]. RWD was also highly valuable during the COVID-19 pandemic; observational studies reported timely evidence on vaccine booster effectiveness [Reference Barda, Dagan and Cohen13,Reference Monge, Rojas-Benedicto and Olmedo14], the comparative effectiveness of different vaccines [Reference Dickerman, Gerlovin and Madenci15], and vaccine effectiveness during pregnancy [Reference Dagan, Barda and Biron-Shental16].
Despite the many ways in which RWE may support policy or regulatory decision-making, the prospect of erroneous conclusions resulting from potentially biased effect estimates has led to appropriate caution when interpreting the results of RWE studies. One concern is data availability; data sources might not include all relevant information for causal estimation even in randomized studies that generate RWE. Another concern is lack of randomized treatment allocation in observational RWE. These issues create challenges for estimating a causal relationship outside of the “traditional” clinical trial space.
In an attempt to guide investigators toward better practices for RWE studies, there has been a proliferation of guidance documents and framework proposals from regulatory agencies, academia, and industry addressing different stages of the process of RWE generation [3,Reference Burns, Roux and Kalesnik-Orszulak5,Reference Hernán and Robins17–Reference von Elm, Altman and Egger23]. Yet incoming submissions to regulatory agencies lack standardization and consistent inclusion of all information that is relevant for evaluating the quality of evidence that may be produced by a given RWE study [Reference Wang, Pinheiro and Hua20]. To address this gap between guidance and implementation and to discuss perspectives from regulatory and federal medical research agencies, industry, academia, trialists, methodologists, and software developers, the Forum on the Integration of Observational and Randomized Data (FIORD) meeting was held in Washington, D.C. November 17–18, 2022. FIORD participants discussed their experiences with RWE guidance and best practices, as well as steps that could be taken to help investigators follow available guidance. Specifically, participants determined the need for a unifying structure to assist with specification of key elements of a design and analysis plan for an RWE study, including both the statistical analysis plan (SAP) and additional design elements relevant for optimizing and evaluating the quality of evidence produced.
The Causal Roadmap [Reference van der Laan and Rose24–Reference Saddiki and Balzer30] (hereafter, the Roadmap) addresses this need because it is a general, adaptable framework for causal and statistical inference that is applicable to all studies that generate RWE, including studies with randomized treatment allocation and prospective and retrospective observational designs. It is consistent with existing guidance and makes key steps necessary for prespecifying RWE study design and analysis plans explicit. The Roadmap includes steps of defining a study question and the target of estimation, defining the processes that generate data to answer that question, articulating the assumptions required to give results a causal interpretation, selecting appropriate statistical analyses, and prespecifying sensitivity analyses. Following the Roadmap may lead to either (1) specification of key elements of a study design and analysis plan that is expected to generate high-quality RWE or (2) an evidence-based decision that an RWE study to generate the required level of evidence is not currently feasible, with insights into what data would be needed to generate credible RWE in the future.
The goal of this paper is to disseminate the Causal Roadmap to an audience of clinical and translational researchers. We provide an overview of the Roadmap, including a list of steps to consider when proposing studies that incorporate RWD. Members of the FIORD Working Groups also provide three case studies as companion papers demonstrating application of the Roadmap, as described in Table 1.
Table 1. Companion papers demonstrating use of the Roadmap

†We use outcome-blind to mean without information on the observed treatment–outcome association.
Overview of the Causal Roadmap for Clinical and Translational Scientists
We walk through the steps of the Roadmap, depicted in Fig. 1, explaining their execution in general terms for simple scenarios, why they are important, and why multidisciplinary collaboration is valuable to accomplish each step. The Roadmap does not cover all the steps necessary to write a protocol for running a prospective study but instead specifies an explicit process for defining the study design itself, including information that is relevant for evaluating the quality of RWE that may be generated by that design. We suggest that following the Roadmap can help investigators generate high-quality RWE to answer questions that are important to patients, payers, regulators, and other stakeholders.
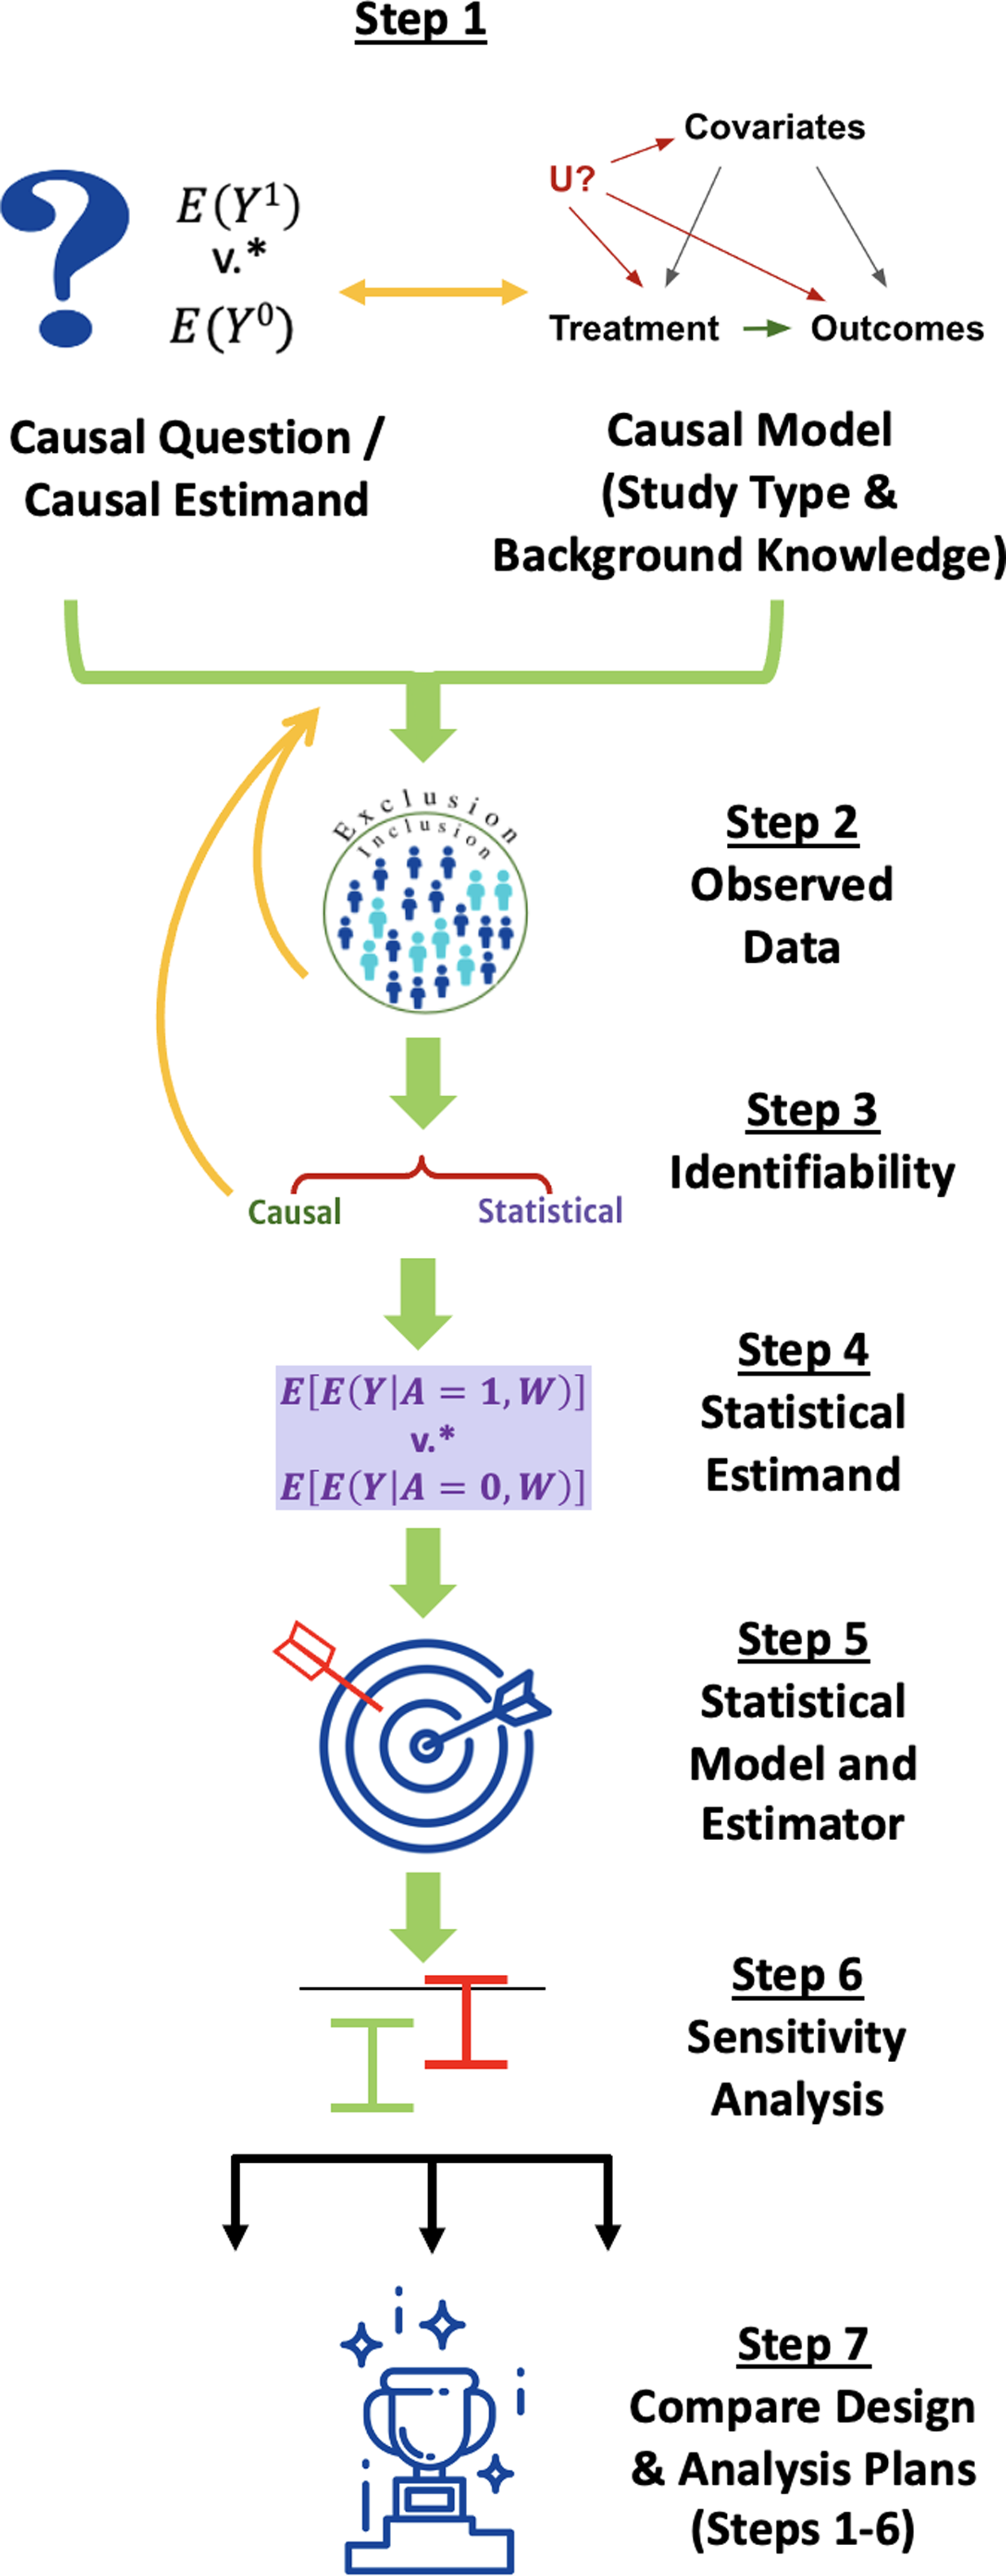
Figure 1. The Causal Roadmap. *The contrast of interest may be additive (e.g., risk difference) or multiplicative. (e.g., relative risk).
A century’s worth of literature has contributed to the concepts described in the Roadmap. Several books explain nuances of these concepts [Reference van der Laan and Rose24,Reference van der Laan and Rose31–Reference Rosenbaum36]. The current paper is not a comprehensive introduction but rather aims to describe a structured approach that can support the generation of high-quality evidence.
Step 1: Causal Question, Causal Model, and Causal Estimand
The first step involves defining the causal question, causal model, and the causal estimand that would answer the question. To facilitate explanation of these concepts, we start by using frameworks for specifying components of a causal question and estimand to also specify key elements of the causal model (Step 1a) before further elaborating the causal model in Step 1b.
Step 1a: Define the Causal Question and Causal Estimand
Many causal questions start with the objective of estimating the effect of an exposure (e.g., a medication or intervention) on an outcome. Building on decades of research in the careful conduct of randomized and observational studies [Reference Rosenbaum36–Reference Cochran and Chambers40], both the International Council for Harmonisation of Technical Requirements for Pharmaceuticals for Human Use (ICH) E9(R1) [41] and Target Trial Emulation [Reference Hernán and Robins17,Reference Hernan and Robins32,Reference Hernán, Sauer, Hernández-Díaz, Platt and Shrier42,Reference Hernán, Wang and Leaf43] frameworks prompt investigators to define components of a causal question and estimand. The causal estimand is a mathematical quantity that represents the answer to the causal question (Table 2).
Table 2. Components of a causal question and estimand per ICH E9(R1) [41] and target trial emulation [Reference Hernán and Robins17]

†Baseline participant characteristics can include additional variables not used to define eligibility criteria. Baseline variables do not completely characterize the population, but for simplicity, we only consider measured baseline characteristics in the notation below.
††In the current paper, we focus on interventions on baseline treatment and postbaseline censoring. However, the approach represented extends naturally to treatment strategies that incorporate additional postbaseline interventions (see e.g., Robins and Hernán (2009) [Reference Robins, Hernán, Fitzmaurice, Davidian, Verbeke and Molenberghs108], Petersen (2014) [Reference Petersen28]).
†††A mathematical quantity that is a function of potential outcomes (see above).
An example of a question guided by these components might be: How would the risk of disease progression by 2 years have differed if all individuals who met eligibility criteria had received the drug under investigation (treatment strategy A = 1) versus an active comparator (treatment strategy A = 0) and no one dropped out of the study (C = 0)? The best (albeit impossible!) way to answer this question would be to evaluate both the potential outcomes [Reference Neyman44,Reference Rubin45] individuals would have experienced had they received treatment strategy A = 1 and not been censored (Y a = 1, c = 0) and the potential outcomes the same individuals would have experienced had they received treatment strategy A = 0 and not been censored (Y a = 0, c = 0).
A more fully elaborated structural causal model would help us describe the causal pathways that generate these potential outcomes [Reference Pearl46]. For now, we simply consider that, if we were able to observe both potential outcomes for all members of our target population, then the answer to our question would be given by the causal risk difference (or “average treatment effect”):
 $${\it{\Psi ^*}} = P\left( {{Y^{a = 1,\,c = 0}} = 1} \right) - P\left( {{Y^{a = 0,\,c = 0}} = 1} \right).$$
This mathematical quantity – a function of the potential outcomes defined above – is the causal estimand of interest in our example. Table 2 lists other examples of causal estimands.
Importance: Even though we can only observe at most one potential outcome for each individual [Reference Holland47], and even though it is not possible to guarantee complete follow-up in a real trial, precise definition of the causal question and estimand based on the treatment strategies defined in Table 2 is crucial for specifying a study design and analysis plan to provide the best possible effect estimate. Ultimately, we need a procedure that can be applied to the data to generate an appropriate estimate (e.g., a 5% decrease in risk of disease progression). To assess whether that number provides an answer to our causal question, we must first define mathematically what we aim to estimate.
Build a Multidisciplinary Collaboration: Experts in causal inference may come from a variety of fields, including economics, biostatistics, epidemiology, computational science, the social sciences, medicine, pharmacology, and others. They can help to translate a research question into a causal estimand.
Step 1b: Specify a Causal Model Describing How Data Have Been or Will be Generated
Next, we consider what we know (and do not know) about the processes that will generate – or that have already generated – data to answer this question. First, we consider the type of study (e.g., pragmatic randomized trial, retrospective cohort study). Then, we consider what factors affect the variables that are part of our treatment strategies – found in Table 2 and referred to as intervention variables below – and the outcome in our proposed study. It is also important to consider factors that are affected by intervention and/or outcome variables, such as mediators, colliders, or any study eligibility criteria that are outcome-dependent.
This background knowledge helps to generate the causal model [Reference Pearl46]. We specified some key variables in our causal model in Step 1a (in Table 2 and our potential outcomes). Now, we further elaborate our causal model by describing potential causal relationships between these and other important variables. Multiple tools and frameworks can help elicit this information, such as conceptual models and causal graphs (e.g., directed acyclic graphs or single-world intervention graphs) [Reference Robins39,Reference Pearl48–Reference Richardson and Robins51].
Fig. 2 gives a simple example of causal graph construction for a prospective observational cohort study, starting with writing down all intervention and outcome variables. When some outcomes are missing, we do not observe the outcome, Y, for all participants. Instead, we observe Y ☆, which is equal to the actual outcome if it was observed and is missing otherwise (Fig. 2a). Arrows denote possible effects of one variable on another.

Figure 2. Basic process for generating a causal graph. Y ☆ is equal to the actual outcome value if it was observed and is missing otherwise.
Then, we attempt to write down factors that might influence (or be influenced by) these variables. Fig. 2b shows two examples (age and a biomarker), though real causal graphs generally include many more variables. In a classic randomized trial, only the randomization procedure affects baseline treatment assignment, whereas in an observational study, participant characteristics or other nonrandomized factors (such as policy or environmental factors) may affect both the treatment/exposure and the outcome. Next, we consider factors that are unmeasured or difficult to measure that might influence treatment, outcomes, or censoring. Fig. 2c shows access to healthcare as an example.
Causal graphs can become much more complicated, especially when working with longitudinal data [Reference Robins, Bickel, Diggle and Fienberg52], using proxies for unmeasured variables [Reference VanderWeele53], or combining different data sources [Reference Bareinboim and Pearl54] (as demonstrated in the case study of Semaglutide and Cardiovascular Outcomes). A carefully constructed causal graph should also include sample selection, competing risks, intercurrent events, and measurement error [Reference Hernan and Robins32,Reference Stensrud and Dukes55]. Examples of causal graph construction are available for a wide variety of study designs including retrospective cohort, cross-sectional, and case–control studies in which selection into the study sample may be affected by the outcome [Reference Shahar and Shahar56,Reference Mansournia, Hernán and Greenland57].
Importance: Considering which factors may affect or be affected by intervention variables and outcomes helps to determine whether we can answer our question based on existing data or data that we will collect. The final graph should be our best honest judgment based on available evidence and incorporating remaining uncertainty [Reference Hernan and Robins32].
Build a Multidisciplinary Collaboration: If questions remain about some aspect of this model, such as how physicians decide to prescribe a medication in different practice settings, input from clinicians or other relevant collaborators is obtained before moving on.
Consider Whether the Causal Question and Estimand (Step 1a) Need to be Modified Based on Step 1b
After writing down our causal model, we sometimes need to change our question [Reference Phillips, Abellan-Andres and Soren58]. For example, we may have realized that an intercurrent event (such as death) prevents us from observing the outcome for some individuals. As suggested by ICH E9(R1), we could modify the question to consider the effect on a composite outcome of the original outcome or death [41]. ICH E9(R1) discusses other intercurrent events and alternative estimands [41].
Step 2: Consider the Observed Data
The causal model from Step 1b lets us specify what we know about the real-world processes that generate our observed data. This model can inform what data we collect in a prospective study or help to determine whether existing data sources include relevant information. Next, we consider the actual data we will observe.
Specific questions to address regarding the observed data include the following: How are the relevant exposures, outcomes, and covariates, including those defining eligibility criteria, measured in the observed data? Are they measured differently (including different monitoring protocols) in different data sources or at different time points? Are we able to measure all variables that are important common causes of the intervention variables and the outcome? Is the definition of time zero in the data consistent with the causal question [Reference Hernán, Sauer, Hernández-Díaz, Platt and Shrier42]?
Importance: After considering these questions, we may need to modify Step 1. For example, if we realize that the data we are able to observe only include patients seen at tertiary care facilities, we may need to change the question (Step 1a) to ask about the difference in the risk of disease progression by two years if all individuals meeting our eligibility criteria and receiving care at tertiary facilities received one intervention or the other. Knowledge about factors that affect how variables are measured and whether they are missing should be incorporated in the causal model (Step 1b). Completing this step also helps investigators assess whether the data are fit-for-use [3] and whether we are able to estimate a causal effect from the observed data (discussed in Step 3).
Build a Multidisciplinary Collaboration: Clinicians and clinical informaticists can help to explain the way variables are measured in relation to underlying medical concepts or in relation to a particular care setting. Statisticians can help to determine how to match baseline time zero in the observed data with the follow-up period in the causal question.
Step 3: Assess Identifiability: Can the Proposed Study Provide an Answer to Our Causal Question?
In Step 3, we ask whether the data we observe (Step 2), together with our knowledge about how these data are generated (Step 1b), are sufficient to let us answer our causal question (Step 1a). As described in Step 1a, we cannot directly estimate our causal estimand (which is a function of counterfactual outcomes). Instead, we will express the causal estimand as a function of the observed data distribution (called a statistical estimand, described in Step 4).
The difference between the true values of the statistical and causal estimands is sometimes referred to as the causal gap [Reference Gruber, Phillips, Lee, Ho, Concato and van der Laan27]. If there is a causal gap, even the true value of the statistical estimand would not provide an answer to our causal question. While we can never be certain of the size of the causal gap for studies incorporating RWD and even for many questions using data from traditional randomized trials, we must use our background knowledge to provide an honest appraisal. Causal identification assumptions help us to explicitly state what must be true in order to conclude that the causal gap is zero and that we are thus able to estimate a causal effect using the proposed data. Table 3 lists two examples of identification assumptions with informal explanations of their meaning.
Table 3. Examples of identification assumptions

† Full exchangeability is generally not required if weaker conditions (e.g., mean exchangeability, sequential conditional exchangeability, or others) hold [Reference Hernan and Robins32].
Exchangeability, in particular, can also be framed in terms of causal graphs [Reference Pearl46]. Confounding by unmeasured variables is a widely discussed source of bias in observational studies. Conditioning on a variable that is independently affected by both treatment and the outcome – either by adjusting for that variable in the analysis or by selecting retrospective study participants based on certain values of that variable – may also result in a noncausal association between treatment and outcomes and a statistical estimand that is biased for the true causal effect (i.e., collider bias or selection bias) [Reference Hernan and Robins32].
Depending on the causal model and question (Step 1), additional assumptions or alternate sets of assumptions may be necessary. For example, if we aim to transport or generalize a causal effect to a new population, we must assume that all values of effect modifiers represented in the target population are also represented in the original study population and that all effect modifiers with different distributions in these two populations are measured [Reference Degtiar and Rose59–Reference Dahabreh, Robertson, Steingrimsson, Stuart and Hernán63]. Hernán and Robins (2020) [Reference Hernan and Robins32], among others, provide in-depth discussions of identification assumptions. The three companion papers demonstrate the evaluation of these assumptions.
Importance: Considering and documenting the plausibility of the causal identification assumptions helps to determine whether steps can be taken to decrease the potential magnitude of the causal gap. If we conclude that these assumptions are unlikely to be satisfied, then we should consider modifications to Steps 1–2. We may need to limit the target population to those who have a chance of receiving the intervention or evaluate the effect of a more realistic treatment rule to improve the plausibility of the positivity assumption [Reference Petersen, Porter, Gruber, Wang and van der Laan64,Reference Rudolph, Gimbrone and Matthay65]. We may need to measure more of the common causes depicted in our causal graph or modify the question to improve the plausibility of the exchangeability assumption [66]. If multiple study designs are feasible, Step 3 can help us to consider which study design is based on more reasonable assumptions [Reference Weber, van der Laan and Petersen67].
If we know that a key variable affecting treatment and outcomes or censoring and outcomes is not measured, then we generally cannot identify a causal effect from the observed data without measuring that variable or making additional assumptions [Reference Hernán and Robins17,Reference Hernan and Robins32,Reference Rubin37]. For this and other reasons, many studies analyzing RWD appropriately report statistical associations and not causal effects, though sensitivity analyses (Step 6) may still help to evaluate whether a causal effect exists [Reference Díaz and van der Laan68,Reference VanderWeele and Ding69]. Nonetheless, if a retrospective study was initially proposed but the causal identification assumptions are highly implausible and cannot be improved using existing data, then investigators should consider prospective data collection to better evaluate the effect of interest.
In general, it would be unreasonable to expect that all causal identification assumptions would be exactly true in RWE studies – or even in many traditional randomized trials that do not utilize RWD due to issues such as informative missingness [Reference Hernan and Robins32]. Nevertheless, careful documentation of Steps 1–3 in the prespecified analysis plan and in the study report helps not only the investigator but also regulators, clinicians, and other stakeholders to evaluate the quality of evidence generated by the study about the causal effect of interest. Step 3 helps us to specify a study with the smallest causal gap possible. Sensitivity analyses, discussed in Step 6, help to quantify a reasonable range for the causal gap, further aiding in the interpretation of RWE study results.
Build a Multidisciplinary Collaboration: Experts in causal inference can aid other investigators in evaluating different causal identification assumptions. For example, reasoning about the exchangeability assumption can become quite complicated if there are multiple intervention variables (e.g., when the treatment varies over time) [Reference Robins39,Reference Robins, Bickel, Diggle and Fienberg52]. In such cases, graphical criteria may be used to determine visually from a causal graph whether sufficient variables have been measured to satisfy the exchangeability assumption [Reference Robins39,Reference Pearl46,Reference Shpitser70]. Software programs can also facilitate this process [Reference Textor, van der Zander, Gilthorpe, Liśkiewicz and Ellison71,72].
Step 4: Define the Statistical Estimand
If, after assessing identifiability, we decide to proceed with our study, we aim to define a statistical estimand that is as close as possible to the causal estimand of interest. Recall our causal risk difference for a single time-point intervention and outcome:
 $${\it{\Psi ^*}} = P\left( {{Y^{a = 1,\,c = 0}} = 1} \right) - P\left( {{Y^{a = 0,\,c = 0}} = 1} \right).$$
In a simple case where participant characteristics other than our intervention variables and outcome – denoted W – are only measured at baseline, then the statistical estimand that is equivalent to the causal effect if all identification assumptions are true is given by:
 $${{{\it{\Psi }} = {E_W}\left( {P\left[ {{Y^ \star } = 1|W,A = 1,C = 0} \right] - P\left[ {{Y^ \star } = 1|W,A = 0,C = 0} \right]} \right).}}$$
In words, we have rewritten the answer to our causal question (which is defined based on potential outcomes that we cannot simultaneously observe) in terms of a quantity that we can estimate with our data: the average (for our target population) of the difference in risk of our observed outcome associated with the different treatment strategies, adjusted for measured confounders.
Importance: The traditional practice of defining the statistical estimand as a coefficient in a regression model has several downsides, even if the model is correctly specified (a questionable assumption, as discussed below) [Reference van der Laan and Rose24]. This approach starts with a tool (e.g., a regression model) and then asks what problem it can solve, rather than starting with a problem and choosing the best tool [Reference Breiman73]. For example, the hazard ratio may be estimated based on a coefficient in a Cox regression but does not correspond to a clearly defined causal effect [Reference Hernán74–Reference Martinussen, Vansteelandt and Andersen76]. Instead, the Roadmap involves choosing a statistical estimand that corresponds to the causal estimand under identification assumptions. We thus specify a well-defined quantity that can be estimated from the observed data and that is directly linked to the causal question.
Build a Multidisciplinary Collaboration: Defining a statistical estimand that would be equivalent to the causal effect of interest under identification assumptions is more challenging when there are postbaseline variables that are affected by the exposure and that, in turn, affect both the outcome and subsequent intervention variables [Reference Robins39]. This situation is common in studies where the exposure is measured at multiple time points. In such a situation, statistician collaborators can help to define the statistical estimand using approaches such as the longitudinal g-computation formula [Reference Robins39].
Step 5: Choose a Statistical Model and Estimator that Respects Available Knowledge and Uncertainty Based on Statistical Properties
The next step is to define a statistical model (formally, the set of possible data distributions) and to choose a statistical estimator. The statistical model should be compatible with the causal model (Step 1b). For example, knowledge that treatment will be randomized (design knowledge that we described in our causal model) implies balance in baseline characteristics across the two arms (with slight differences due to chance in a specific study sample). We could also incorporate knowledge that a continuous outcome falls within a known range or that a dose–response curve is monotonic (e.g., based on prior biological data) into our statistical model. A good statistical model summarizes such statistical knowledge about the form of the relationships between observed variables that is supported by available evidence without adding any unsubstantiated assumptions (such as linearity, or absence of interactions); models of this type are often referred to as semi- or nonparametric or simply realistic statistical models [Reference van der Laan and Rose24].
Given a statistical model, the choice of estimator should be based on prespecified statistical performance benchmarks that evaluate how well it is likely to perform in estimating the statistical estimand [Reference van der Laan and Rose24]. Examples include type I error control, 95% confidence interval (CI) coverage, statistical bias, and precision. Statistical bias refers to how far the average estimate across many samples would be from the true value of the statistical estimand. An estimator must perform well even when we do not know the form of the association between variables in our dataset, and it must be fully prespecified [Reference van der Laan and Rose24].
Many commonly used estimators rely on estimating an outcome regression (i.e., the expected value of the outcome given the treatment and values of confounders), a propensity score (i.e., the probability of receiving a treatment or intervention given the measured confounders), or both. Without knowing the form of these functions, we do not know a priori whether they are more likely to be accurately modeled with a parametric regression or a flexible machine learning algorithm allowing for nonlinearities and interactions between variables [Reference van der Laan and Rose24,Reference Breiman73,Reference van der Laan, Polley and Hubbard77]. The traditional practice of defaulting to a parametric regression as the statistical estimator imposes additional statistical assumptions, even though they are not necessary. Fortunately, estimators exist that allow for full prespecification of all machine learning and parametric approaches used, data-adaptive selection (e.g., based on cross-validation) of the algorithm(s) that perform best for a given dataset, and theoretically sound 95% confidence interval construction (leading to proper coverage under reasonable conditions) [Reference van der Laan and Rose24].
Importance: Effect estimates that are based on incorrectly specified models – such as a main terms linear regression when there is truly nonlinearity or interactions between variables – are biased, and that bias does not get smaller as sample size increases [Reference van der Laan and Rose24]. This bias may result in misleading conclusions. We aim to choose an estimator that not only has minimal bias but also is efficient – thereby producing 95% confidence intervals that are accurate but as narrow as possible – to make maximal use of the data [Reference van der Laan and Rose24].
If, after consideration of the statistical assumptions and properties of the estimators, multiple estimators are considered, then the bias, variance, and 95% CI coverage of all estimators should be compared using outcome-blind simulations that mimic the true proposed experiment as closely as possible [Reference Montoya, Kosorok, Geng, Schwab, Odeny and Petersen78]. We use the term “outcome-blind” to mean that the simulations are conducted without information on the observed treatment–outcome association in the current study; such simulations may utilize other information from previously collected data or from the current study data if available (e.g., data on baseline covariates, treatment, and censoring) to approximate the real experiment [Reference Montoya, Kosorok, Geng, Schwab, Odeny and Petersen78]. Simulations conducted before data collection may use a range of plausible values for these study characteristics [79]. As recommended by ICH E9(R1), simulations should also be conducted for cases involving plausible violations of the statistical assumptions underpinning the estimators [41]. Examples of such violations include nonlinearity for linear models or inaccurate prior distributions for Bayesian parameters. For an example of conducting such a simulation, please see the Drug Safety and Monitoring case study.
Build a Multidisciplinary Collaboration: Statistician collaborators can help to prespecify an estimator with the statistical properties described above. Resources are increasingly available to assist with prespecification of SAPs based on state-of-the-art estimation approaches. For example, Gruber et al. (2022) [Reference Gruber, Lee, Phillips, Ho and van der Laan80] provide a detailed description of how to prespecify a SAP using targeted minimum loss-based estimation (TMLE) [Reference van der Laan and Rubin81] and super learning [Reference van der Laan, Polley and Hubbard77], a combined approach that integrates machine learning to minimize the chance that statistical modeling assumptions are violated [Reference van der Laan and Rose24].
Step 6: Specify a Procedure for Sensitivity Analysis
Sensitivity analyses in Step 6 attempt to quantify how the estimated results (Step 5) would change if the untestable causal identification assumptions from Step 3 were violated [Reference Hernan and Robins32,Reference Díaz and van der Laan68,Reference Greenland82–Reference Robins, Rotnitzky, Scharfstein, Halloran and Berry84]. In contrast, the simulations in Step 5 consider bias due to violations of testable statistical assumptions, which ICH E9(R1) considers as a different form of sensitivity analysis [41]. One mechanism of conducting a causal sensitivity analysis in Step 6 is to consider the potential magnitude and direction of the causal gap; this process requires subject matter expertise and review of prior evidence [Reference Díaz and van der Laan68,Reference Lash, Fox, MacLehose, Maldonado, McCandless and Greenland83–Reference Rotnitzky, Robins and Scharfstein85]. Sensitivity analysis also allows for construction of confidence intervals that account for plausible values of the causal gap [Reference Gruber, Phillips, Lee, Ho, Concato and van der Laan27,Reference Díaz and van der Laan68,Reference Lash, Fox, MacLehose, Maldonado, McCandless and Greenland83–Reference Rotnitzky, Robins and Scharfstein85]. Alternatively, investigators may assess for causal bias using negative control variables [Reference Lipsitch, Tchetgen Tchetgen and Cohen86–Reference Shi, Miao and Tchetgen87].
The specifics of these methods – and alternative approaches – are beyond the scope of this paper, but the case study of Nifurtimox for Chagas Disease in the companion paper provides an overview of methods for sensitivity analysis, as well as a worked example of using available evidence to assess a plausible range for the causal gap. As discussed in this case study, the method of sensitivity analysis should be prespecified prior to estimating the effect of interest [88]. This process avoids the bias that might occur if experts know the value of the estimate before defining the procedure they will use to decide whether a given shift in that estimate due to bias is reasonable [Reference Lash, Fox, MacLehose, Maldonado, McCandless and Greenland83].
Importance: The process of using prior evidence to reason about likely values of the causal gap helps investigators to assess the plausibility that the bias due to a violation of identification assumptions could be large enough that the observed effect is negated [Reference Gruber, Phillips, Lee, Ho, Concato and van der Laan27,Reference Díaz and van der Laan68,Reference VanderWeele and Ding69,Reference Phillips and LaPole89]. While the exact magnitude of the causal effect may still not be identified due to known issues such as the potential for residual confounding, if an estimated effect is large enough, we may still obtain credible evidence that an effect exists [Reference VanderWeele and Ding69,Reference Rosenbaum and Rubin90]; this was the case in Cornfield et al. (1959)’s seminal sensitivity analysis of the effect of smoking on lung cancer [Reference Cornfield, Haenszel, Hammond, Lilienfeld, Shimkin and Wynder91]. Conversely, if the anticipated effect size is small and the plausible range of the causal gap is large, the proposed study may not be able to provide actionable information. Considering these trade-offs can help investigators to decide whether to pursue a given RWE study or to consider alternate designs that are more likely to provide high-quality evidence of whether a causal effect exists [Reference VanderWeele and Ding69,Reference Rudolph and Keyes92].
Build a Multidisciplinary Collaboration: If multiple correlated sources of bias are likely, more complex methods of evaluating a plausible range for the causal gap – and collaboration with investigators familiar with these methods – may be required [Reference Lash, Fox, MacLehose, Maldonado, McCandless and Greenland83].
Step 7: Compare Alternative Study Designs
Roadmap Steps 1–6 help us to specify a study design and analysis plan, including the causal question and estimand, type of study and additional knowledge about how the data are generated, specifics of the data sources that will be collected and/or analyzed, assumptions that the study relies on to evaluate a causal effect, statistical estimand, statistical estimator, and procedure for sensitivity analysis. The type of study described by this design could fall anywhere on the spectrum from a traditional randomized trial to a fully observational analysis. In cases when it is not possible to conduct a traditional randomized trial due to logistical or ethical reasons – or when trial results would not be available in time to provide actionable information – the value of RWE studies is clear despite the possibility of a causal gap [Reference Hernan and Robins32]. If conducting a randomized trial is feasible, baseline randomization of an intervention (as part of either a traditional or pragmatic trial [Reference Ford and Norrie93]) still generally affords a higher degree of certainty that the estimated effect has a causal interpretation compared to analysis of nonrandomized data. Yet sometimes, it is feasible to consider multiple different observational and/or randomized designs – each with different potential benefits and downsides.
Consider a situation in which there is some evidence for a favorable risk–benefit profile of a previously studied intervention based on prior data, but those data are by themselves insufficient for regulatory approval for a secondary indication or for clear modification of treatment guidelines. In this context, it is possible that conducting a well-designed RWE study as opposed to a traditional randomized trial alone will shorten the time to a definitive conclusion, decrease the time patients are exposed to an inferior product, or provide other quantifiable benefits to patients while still providing acceptable control of type I and II errors [Reference Kim, Harun, Liu, Khoury and Broderick94–Reference Ventz, Khozin and Louv96]. Yet other times, a proposed RWE design may be inferior to alternative options, or one design may not be clearly superior to another. When multiple study designs are considered, outcome-blind simulations consistent with our description of Steps 1–6 can help to compare not only type I error and power but also metrics quantifying how the proposed designs will modify the medical product development process [Reference Kim, Harun, Liu, Khoury and Broderick94]. The case study of Semaglutide and Cardiovascular Outcomes demonstrates how to compare study designs that are based on Roadmap Steps 1–6.
Importance: A simulated comparison is not always necessary; one study design may be clearly superior to another. Yet often there are trade-offs between studies with different specifications of Roadmap Steps 1–6. For example, in some contexts, we may consider augmenting a randomized trial with external data. When comparing the standard and augmented randomized trial designs, there may be a trade-off between (a) the probability of correctly stopping the study early when appropriate external controls are available and (b) the worst-case type I error that would be expected if inappropriate external controls are considered [Reference Ventz, Khozin and Louv96]. Another example would be the trade-off between the potential magnitudes of the causal gap when different assumptions are violated to varying degrees for studies relying on alternate sets of causal identification assumptions [Reference Weber, van der Laan and Petersen67]. Simulated quantification of these trade-offs using prespecified benchmarks can help investigators to make design choices transparent [Reference Chaudhuri, Ho, Irony, Sheldon and Lo97].
Build a Multidisciplinary Collaboration: Factors to consider when comparing different designs include the expected magnitude of benefit based on prior data and the quality of that data [11], the plausible bounds on the causal gap for a given RWE study, the treatments that are currently available [11], and preferences regarding trade-offs between design characteristics such as type I versus type II error control [Reference Chaudhuri, Ho, Irony, Sheldon and Lo97]. Because these trade-offs will be context-dependent [11,Reference Chaudhuri, Ho, Irony, Sheldon and Lo97], collaboration with patient groups and discussion with regulatory agencies is often valuable when choosing a study design from multiple potential options.
A List of Roadmap Steps for Specifying Key Elements of a Study Design and Analysis Plan
Table 4 provides a list of considerations to assist investigators in completing and documenting all steps of the Roadmap. Complete reporting of RWE study results should include all prespecified Roadmap steps, though information supporting decisions in the final design and analysis plan, such as causal graphs or simulations, may be included as supplementary material. Note that all steps should be prespecified before conducting the study.
Table 4. Steps for specifying key elements of a study design and analysis plan using the Roadmap

Discussion
The Roadmap can help investigators to prespecify design and analysis plans for studies that utilize RWD, choose between study designs, and propose high-quality RWE studies to the FDA and other agencies. We describe the steps of the Roadmap in order to disseminate this methodology to clinical and translational scientists. The companion papers presenting case studies on Drug Safety and Monitoring, Nifurtimox for Chagas Disease, and Semaglutide and Cardiovascular Outcomes demonstrate applications of the Roadmap and explain specific steps in greater detail.
Past descriptions of the Roadmap have largely been targeted to quantitative scientists [Reference van der Laan and Rose24–Reference Gruber, Phillips, Lee, Ho, Concato and van der Laan27,Reference Balzer, Petersen, van der Laan, Buhlmann, Drineas, Kane and van der Laan29,Reference Saddiki and Balzer30]. In this paper, we focus on intuitive explanations rather than formal mathematical results to make these causal inference concepts more accessible to a wide audience. We emphasize the importance of building a multidisciplinary collaboration, including both clinicians and statisticians, during the study planning phase.
We also introduce an extension of previous versions of the Roadmap to emphasize how outcome-blind simulations may be used not only to compare different statistical estimators but also to evaluate different study designs. This extension aligns with the FDA’s Complex Innovative Trial Designs Program guidance for designs that require simulation to estimate type I and II error rates [98] and emphasizes the quantitative comparison of the proposed study to a randomized trial or other feasible RWE designs. The aim of this additional step is to facilitate evaluation of the strengths and weaknesses of each potential approach.
The Roadmap aligns with other regulatory guidance documents, as well; these include the FDA’s Framework and Draft Guidance documents for RWE that emphasize the quality and appropriateness of the data [3,99–101] and the ICH E9(R1) guidance on estimands and sensitivity analysis [41]. The Roadmap is also consistent with other proposed frameworks for RWE generation. Within the field of causal inference, the Roadmap brings together concepts including potential outcomes [Reference Neyman44,Reference Rubin45], the careful design of nonexperimental studies [Reference Rosenbaum35,Reference Rosenbaum36,Reference Rubin38,Reference Cochran and Chambers40], causal graphs [Reference Robins39,Reference Pearl48–Reference Richardson and Robins51] and structural causal models [Reference Pearl46], causal identification [Reference Robins39,Reference Pearl46,Reference Robins102], translation of causal to statistical estimands using the g-formula [Reference Robins39], and methods for estimation and sensitivity analysis [Reference van der Laan and Rose24,Reference Lash, Fox and Fink34,Reference Díaz and van der Laan68,Reference van der Laan, Polley and Hubbard77,Reference Greenland82,Reference Robins, Rotnitzky, Scharfstein, Halloran and Berry84]. The Roadmap is also compatible with frameworks including the Target Trial Emulation framework [Reference Hernán and Robins17,Reference Hernán, Wang and Leaf43], the Patient-Centered Outcomes Research Institute (PCORI) Methodology Standards [19], white papers from the Duke-Margolis Center [Reference Berger, Overhage and Daniel18,Reference Mahendraratnam, Eckert and Mercon103], the REporting of studies Conducted using Observational Routinely-Collected health Data (RECORD) Statement [Reference Benchimol, Smeeth and Guttmann104], the Structured Preapproval and Postapproval Comparative study design framework [Reference Gatto, Reynolds and Campbell105], and the STaRT-RWE template [Reference Wang, Pinheiro and Hua20]. The purpose of the Roadmap is not to replace these – and many other – useful sources of guidance but rather to provide a unified framework that covers key steps necessary to follow a wide range of guidance in a centralized location. Furthermore, while many recommendations for RWE studies list what to think about (e.g., types of biases or considerations for making RWD and trial controls comparable), the Roadmap aims instead to make explicit a process for how to make and report design and analysis decisions that is flexible enough to be applied to any use case along the spectrum from a traditional randomized trial to a fully observational analysis.
With increasing emphasis by regulatory agencies around the world regarding the importance of RWE [Reference Burns, Roux and Kalesnik-Orszulak5], the number of studies using RWD that contribute to regulatory decisions is likely to grow over time. Yet a recent review of RWE studies reported that “nearly all [reviewed] studies (95%) had at least one avoidable methodological issue known to incur bias” [Reference Bykov, Patorno and D’Andrea106]. By following the Roadmap steps to prespecify a study design and analysis plan, investigators can set themselves up to convey relevant information to regulators and other stakeholders, to produce high-quality estimates of causal effects using RWD when possible, and to honestly evaluate whether the proposed methods are adequate for drawing causal inferences.
Acknowledgments
We would like to thank the sponsors of the FIORD workshop, including the Forum for Collaborative Research and the Center for Targeted Machine Learning and Causal Inference (both at the School of Public Health at the University of California, Berkeley), and the Joint Initiative for Causal Inference. We would also like to thank Dr John Concato (US Food and Drug Administration) for his comments on this manuscript.
Funding statement
This research was funded by a philanthropic gift from the Novo Nordisk corporation to the University of California, Berkeley, to support the Joint Initiative for Causal Inference.
Competing interests
The contents are those of the author(s) and do not necessarily represent the official views of, nor an endorsement by, FDA/HHS, the US Government, or the authors’ affiliations.
LED reports tuition and stipend support from a philanthropic gift from the Novo Nordisk corporation to the University of California, Berkeley, to support the Joint Initiative for Causal Inference. IJD is the principal investigator of a research agreement between Harvard University and Sanofi and reports consulting fees from Moderna. EK is employed by Microsoft. DA is employed by Pfizer Inc. and holds stocks in Pfizer Inc. CYV and RAH are employed by Syneos Health. CYV reports that her husband is employed by Galapagos. HR and KK are employed by Novo Nordisk A/S and own stocks in Novo Nordisk A/S. RP has received the following (directed to his institution): speaker fees from Merck and Novo Nordisk; consulting fees from Bayer AG, Corcept Therapeutics Incorporated, Dexcom, Endogenex, Inc., Gasherbrum Bio, Inc., Hanmi Pharmaceutical Co., Hengrui (USA) Ltd., Lilly, Merck, Novo Nordisk, Pfizer, Rivus Pharmaceuticals Inc., Sanofi, Scohia Pharma Inc., and Sun Pharmaceutical Industries; and grants from Hanmi Pharmaceuticals Co., Metavention, Novo Nordisk, and Poxel SA. DM is employed by Moderna. CEB is co-founder of Adaptic Health Inc., Managing Director of Pivotal Strategic Consulting, LLC, and receives consulting fees from Graticule Inc. and Sophic Alliance Inc. MA is employed by Novartis Pharma AG. JBB reports contracted fees and travel support for contracted activities for consulting work paid to the University of North Carolina by Novo Nordisk; grant support by Dexcom, NovaTarg, Novo Nordisk, Sanofi, Tolerion and vTv Therapeutics; personal compensation for consultation from Alkahest, Altimmune, Anji, AstraZeneca, Bayer, Biomea Fusion Inc., Boehringer-Ingelheim, CeQur, Cirius Therapeutics Inc., Corcept Therapeutics, Eli Lilly, Fortress Biotech, GentiBio, Glycadia, Glyscend, Janssen, MannKind, Mellitus Health, Moderna, Pendulum Therapeutics, Praetego, Sanofi, Stability Health, Terns Inc., Valo and Zealand Pharma; stock/options in Glyscend, Mellitus Health, Pendulum Therapeutics, PhaseBio, Praetego, and Stability Health; and board membership of the Association of Clinical and Translational Science. MvdL and SG report that they are co-founders of the statistical software start-up company TLrevolution, Inc. MvdL and MP report personal compensation for consultation from Novo Nordisk.


 Open access