


We investigated the validity of self-reported birth weight for a sample of Norwegian twins. This is relevant for research involving birth weight, most notably for research on the Fetal Origins of Adult Disease (FOAD) hypothesis, which posits that a number of chronic diseases that manifest later in life have their origin in fetal life. Low birth weight is considered a marker for the intrauterine environment and has been associated with cardiovascular disease and its biological risk factors (Barker et al., Reference Barker, Eriksson, Forsen and Osmond2002). FOAD has also been expanded to other disease outcomes, including mental health and cancer, although with mixed conclusions (Chen et al., Reference Chen, Cnattingius, Nyman Iliadou and Oberg2016; Skogen & Overland, Reference Skogen and Overland2012; Spracklen et al., Reference Spracklen, Wallace, Sealy-Jefferson, Robinson, Freudenheim, Wellons and Ryckman2014; Wojcik et al., Reference Wojcik, Lee, Colman, Hardy and Hotopf2013). Twin designs are particularly suited to study birth-weight variation on health because they control for important sources of genetic and environmental confounding that could affect birth weight and the disease outcome. Specifically, members of a twin pair are typically birth-weight discordant and the first-born twin normally weighs more than the second-born twin. This provides a natural, genetically controlled experiment to test how birth-weight variation within a pair is associated with later-life disease outcomes within the pair (Leon, Reference Leon2001). Couched within the FOAD framework, twin studies could then provide additional insights into the mechanisms and factors through which low birth weight is associated with adult disease.
It is then evident that research along this line of inquiry requires information on birth weight. However, for older birth cohorts, register-based birth records are often not readily obtainable, or are practically non-existent. It is therefore usual to rely on self-reported birth weights. This raises the question of the validity of self-reported birth weight. Several studies have addressed this issue and conclusions are mixed (see discussion). Most of these studies were restricted to samples that only included women (Allen et al., Reference Allen, Ellison, dos Santos Silva, De Stavola and Fentiman2002; Andersson et al., Reference Andersson, Niklasson, Lapidus, Hallberg, Bengtsson and Hulthen2000; Jaworowicz et al., Reference Jaworowicz2010; Tehranifar et al., Reference Tehranifar, Liao, Flom and Terry2009; Wodskou et al., Reference Wodskou, Hundrup, Obel and Jorgensen2010). Two studies were based on a sample including both sexes (Brix et al., Reference Brix, Kyvik and Hegedus2002; Kemp et al., Reference Kemp, Gunnell, Maynard, Smith and Frankel2000). Further, some of these studies used categorical measures of birth weight, which is less precise than a continuous variable (Jaworowicz et al., Reference Jaworowicz2010; Tehranifar et al., Reference Tehranifar, Liao, Flom and Terry2009). Notably, only one of these studies were of twins (Brix et al., Reference Brix, Kyvik and Hegedus2002).
The population-based Norwegian Twin Registry (NTR) provides the opportunity to assess the validity of self-reported birth weight in a sample of twins. It contains two sources of birth weight: self-reported birth weight from questionnaire studies conducted during adulthood and actual weight measured at birth and recorded in official birth records. Our general goal in this report is to explore the validity and reliability of self-reported birth weight through a series of analyses that provide complementary sets of information to assess the usefulness of these measures. This includes investigating the degree to which self-reported birth weight agrees with actual birth weight, examining the consistency of self-reported birth weight over time, and evaluating the agreement of analytical results using different birth-weight measures to investigate known associations between birth weight and adult body mass index (BMI; Rasmussen & Johansson, Reference Rasmussen and Johansson1998).
Materials and Methods
Materials
Self-reported birth weight was collected in the twin study Social Factors and Health (SFH; Kutschke et al., Reference Kutschke2016). The SFH study aims to investigate the genetic and environmental influences on social environments and explore how social environments mediate these influences on physical and mental health. Twins participating in the SFH study were recruited from the NTR (Nilsen et al., Reference Nilsen, Brandt, Czajkowski, Knudsen, Magnus, Reichborn-Kjennerud and Ørstavik2016). In 2014, we invited twins born 1935–1960 and 1967–1974 to complete a questionnaire containing items on physical and mental health, medication use, health behaviors, and lifestyle measures and social environments, including height and weight. We also asked the twins to report their birth weight in grams and their birth order (if they were the first- or second-born twin in the pair). In total, 10,655 twins, including 5,354 pairs, were invited to participate in the SFH study. Responses were received from 5,446 individuals (1,989 pairs and 1,468 single responders). Of these, 2,529 reported their birth weight and 5,421 reported their birth order. Measured birth weight and birth order from the Medical Birth Registry of Norway (MBRN) were also available for 778 participants in the SFH study who were born in 1967–1974. Among these, self-reported birth weight was available from 538 twins. Self-reported birth weights < 500 grams were removed from analysis as they were improbable (n = 1), reducing the sample to 537. The MBRN started mandatory and detailed registration of all births in Norway in 1967, consequently official registry data on twins in our sample born before 1967 is not available in electronic form. Figure 1 provides an overview of the study sample with sources of the available birth-weight information.

FIGURE 1 Flow chart of study sample.
Analyses were performed on the full sample and on a sample restricted to include pairs for which their self-reported birth order matched the birth order information in the MBRN. The reason for this is that inspection of the largest deviations between self-reported and MBRN birth weights revealed an evident mix-up where twins are mistaken about their birth order and their corresponding birth weight. For example, in one identical twin pair, one twin reported that ‘I was born first’ and had a birth weight of 1530 grams, which was, in fact, the exact reported birth weight in MBRN for the co-twin who was the actual first-born twin. Likewise, the actual first-born twin reported being the second-born with a birth weight of 2500 grams, which is close to the recorded MBRN weight of 2640 grams for the second-born twin. Of 537 twins in the full sample, 536 also had a full set of self-reported birth order and MBRN data. Selecting pairs who correctly reported their birth order in accordance with the MBRN information reduced the sample further to 363 twins.
Although we do not have official birth records for the older twins, we do have two occasions of self-reported birth weight for 1,579 twins in our sample, born before 1967 who completed the SFH questionnaire in 2014 and also reported their birth weight in an earlier questionnaire (Q1) conducted 1979–1982. (Nilsen et al., Reference Nilsen, Brandt, Magnus and Harris2012). Analysis of this longitudinal data provides insight into the validity of self-reported birth weight for the older subjects in our sample. The mean age of this subsample was 29 years at the completion of the Q1 questionnaire and 63 years for the SFH questionnaire, an interval of 34 years. Analysis of the association between birth weight and BMI are based on BMI data from earlier questionnaires (1992 and 1998 and part of the NTR core data set) as well as the recent SFH questionnaire.
Analysis
As described below, we utilized several methods to assess agreement between birth weight measured by self-report and actual values from the MBRN. These approaches differ, in part based on the ways in which birth weight is coded (continuous or categorical), but primarily they provide different types of information by which to assess agreement between two measures.
First, we measured the strength of agreement between the two variables at group level. Agreement between self-reported birth weight and MBRN registered birth weight, and between the two self-reported questionnaires (Q1 and SFH,) was evaluated by the intraclass correlation coefficient (ICC), which is a common method for evaluating agreement between continuous variables (Veierød et al., Reference Veierød, Lydersen and Laake2012). The ICC is sensitive to differences in variance between the two methods for assessing birth weight, which is not captured by Pearson correlation (McGraw & Wong, Reference McGraw and Wong1996).
Second, to map differences at an individual level we assessed the degree of agreement between self-reported birth weight and MBRN birth weight by the method proposed by Bland and Altman (Reference Bland and Altman1986). By plotting the differences of self-reported birth weight and MBRN birth weight against their mean difference, we can graphically explore the agreement between the two measures. Limits of agreement are calculated, defined such that 95% of the differences between self-reported birth weight and MBRN birth weight fall within these limits. Limits of agreement were calculated as mean difference plus two times the standard deviation (SD), and 95% confidence intervals were calculated to evaluate the precision of the estimated limits.
Third, birth weight is often categorized into two or more groups, representing risk categories that simplify the interpretation of results. We therefore categorized our restricted sample into five categories (≤ 2,000, 2,000–2,500, 2,500–3,000, 3,000–3,500, ≥ 3,500 grams). The accuracy of self-reported birth weight across birth weight categories was assessed through sensitivity and specificity analyses, including calculation of positive and negative predictive values (NPV; Veierød et al., Reference Veierød, Lydersen and Laake2012). For the categorized birth-weight variables, we also assessed correlations using Cohen's kappa. The weighted and unweighted kappa values are reported. Weighting takes the degree of disagreement into account. A disagreement of, for example, 1,000 grams between self-reported birth weight and MBRN recorded birth weight is weighted less than, for example, 500 grams disagreement.
Finally, two sets of linear regression analyses were conducted to test for differences between MBRN and self-reported birth weights on the prediction of BMI. We selected BMI for this analysis because its known association with birth weight has been widely studied. This association is more pronounced in childhood and early adulthood than late adulthood and we therefore regressed birth weight on BMI for all three time points, reflecting the age of the twins when they responded to the questionnaires (ages 18–25, 24–31, and 40–47). p values and confidence intervals were adjusted for within-pair correlations by using the ‘cluster’ option in Stata. The ‘test’ option in Stata was used to test the difference between the two linear models (self-reported and MBRN birth weight as independent variables), which performs a Wald test on the equality of coefficients. StataSE 14.0 was used for analysis (StataCorp, 2015).
Results
Table 1 shows number of observations, differences in mean birth weight and ICC for the full and restricted samples and for males and females. The mean difference between self-reported birth weight and MBRN birth weight was 32 grams in the full sample (n = 537 twins). The Bland–Altman plots of agreement between the MBRN and self-reported birth weight are provided in Figure 2. The limits of agreement, shown in the plots, were +649 grams (95% CI [+647, +652]) and −714 grams (95% CI [−712, −716]) above or below the mean difference (mean diff +/−2*SD). For the restricted sample (n = 363; self-reported birth order = MBRN birth order) the mean difference between the two measures was halved to 16 grams, and the standard deviation was reduced by one third. The limits of agreement were +446 grams (95% CI [+444, + 448]) and −478 grams (95% CI [−475, −480]) above or below the mean difference (mean diff +/−2*SD) respectively. The ICC for all twins was 0.81 in the full sample, ranging from 0.75 in monozygotic female twins to 0.88 in opposite-sexed twins. In the restricted sample, the overall ICC was 0.91, ranging from 0.88 in monozygotic female twins to 0.92 in monozygotic male and opposite-sexed twins.
TABLE 1 Descriptive Statistics for the Samples and Intraclass Correlations

MZM = monozygotic male twins; DZM = dizygotic male twins; MZF = monozygotic female twins; DZF = dizygotic female twins; OS = opposite-sexed twins; ICC = intraclass correlation coefficient; MBRN = Medical Birth Registry Norway; SFH = Social Factors and Health. Questionnaire 2014, Q1 = Q1 Questionnaire 1979–1982.
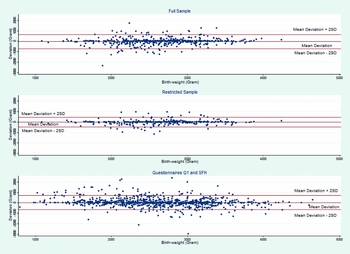
FIGURE 2 Bland–Altman plots of agreement. Differences of self-reported birth weight and MBRN birth weight plotted against their mean deviation. Lines denoted ‘Mean Deviation +/− 2SD’ are the limits of agreement.
Results comparing birth-weight values based on the two occasions of self-reported measurements (Q1 in 1979–1982 and SFH in 2014–2015) revealed a mean difference of 33 grams (self-reported birth order was consistent across both questionnaires). The limits of agreement were +725 grams (95% CI [+724, +727]) and −659 grams (95% CI [−657, −660]) above and below the mean difference (mean diff +/−2*SD). ICC for the two self-reported measures (Q1 and SHF) was 0.86.
For the categorized birth-weight measure (restricted sample) shown in Table 2, sensitivity ranged from 0.78 to 0.89 and the positive predictive values (PPV) ranged from 0.59 to 0.85. Specificity ranged from 0.92 to 0.97 and NPV from 0.88 to 0.99. The kappa and weighted kappa were 0.63 and 0.71 respectively, which indicates substantial agreement.
TABLE 2 Categorized Birth Weight, Sensitivity, Specificity, Positive Predictive Value (PPV), Negative Predictive Value (NPV), and Kappa Estimates
Sensitivity reflects the percentage who report that they are in birth-weight category x, given that they are in birth-weight category x. Specificity reflects the percentage who report that they are not in birth-weight category x, given that they are not in birth-weight category x. PPV is the percentage who are in birth-weight category x, given that they report that they are in birth-weight category x. NPV is the percentage who are not in birth-weight category x, given that they report that they are not in birth-weight category x. MBRN = Medical Birth Registry Norway; SFH = Social Factors and Health Questionnaire 2014.
Results from the linear regression analysis that also tested for effects of age at which birth weight reports were collected are reported in Table 3. There was a positive and significant (p < .05) association between self-reported birth weight and adult BMI, with β coefficients ranging from 0.68–1.04. In the regression, birth weight was in kilograms, so each additional kilogram in birth weight adds β BMI units (kg/m2). For MBRN birth weight and BMI, the β coefficients were slightly lower, ranging from 0.62–0.77 and only the value for the lowest age group (18–25 years) was significant at 95% level. Wald tests for differences in coefficients between the two models resulted in no significant differences between the two models in all three age groups (p values .12–.48).
TABLE 3 Results from Linear Regression Analyses of Self-Reported Birth Weight and MBRN Birth Weight Respectively on BMI at Three Age Intervals

MBRN = Medical Birth Registry Norway.
Discussion
Our results showed that self-reported birth weight correlated highly with MBRN birth weight, with an ICC of 0.81 for the full sample and an ICC of 0.91 for the restricted sample. When stratified by zygosity and sex, there was no clear pattern of differences in the ICCs. This was found for both the full and restricted samples. These results suggest that zygosity does not affect the level of agreement between self-reported and registry-based birth weight. For the restricted sample, sensitivity analysis (0.78–0.89) and PPV (0.59–0.85) also showed that self-reported birth weight is a good predictor of actual birth weight. Limits of agreement were +446 and −478 grams around the mean difference of 16 grams. Interpretation of these findings is not straightforward, as there are no established guidelines for what constitutes agreement or disagreement between these two measures. Two studies concluded that self-reported birth weight was not a valid measure of birth weight. In the first study, the limits of agreement around a mean difference of 4.7 grams were −1028 and +1038 and the correlation between actual and self-reported birth weight was 0.76 (Andersson et al., Reference Andersson, Niklasson, Lapidus, Hallberg, Bengtsson and Hulthen2000). The other study found much narrower limits of agreement, ranging from −660 to +672 grams around the mean deviation of 6.2 grams (Brix et al., Reference Brix, Kyvik and Hegedus2002). In contrast, self-reported birth weight was considered a valid measure of actual birth weight in another study that reported a mean deviation of 21 grams, with limits of agreement of −843 and +818 grams and a correlation of 0.83 between actual and self-reported birth weight (Wodskou et al., Reference Wodskou, Hundrup, Obel and Jorgensen2010).
Our results show a higher degree of agreement than the above-mentioned studies. Here, it should be noted that the limits of agreement in the Danish study of twins (Brix et al., Reference Brix, Kyvik and Hegedus2002) were similar to our full sample. However, it is not clear whether the Danish study was able to correct for eventual inconsistencies within the pair for their reported birth order versus self-reports and registry-based records. Twin births are special, and the higher degree of agreement in our study may reflect greater attention to the circumstances surrounding twin births, such as which twin weighed more. The age of our sample could be another factor that explains the study differences. Our sample was comparatively younger (mean age 44 years) when they completed the questionnaire than many of the other studies. Thus, age at reporting differences may explain variation between studies. This explanation is consistent with findings indicating that the accuracy of self-reported birth weight is more reliable in younger than older respondents. People may generally be more aware of their birth weight in more recent times. Furthermore, it is also more probable that younger subjects have living parents whom they can consult about their birth weight; having a living mother increases the probability of having self-report of birth weight (Allen et al., Reference Allen, Ellison, dos Santos Silva, De Stavola and Fentiman2002). But, age itself could also affect the results, as cognitive functions are age related (Nyberg et al., Reference Nyberg, Lovden, Riklund, Lindenberger and Backman2012), and it could be argued that self-reported birth weight from younger subjects is more valid than from older subjects. Cohort effects might also have an effect here, our sample being born in a later period than the studies quoted here.
Our analysis of agreement between self-reported and official birth record birth weight is limited to twins born 1967–1974 (age 40–47 when the questionnaire was filled out) and it is therefore questionable whether our findings are generalizable to all age categories, especially older individuals for whom birth records are not available. MBRN started registration in 1967, and for this reason we could not assess agreement between actual and reported birth weight for the twins in our sample born before 1967. However, we were able to test for consistency of self-reports over time, which is informative on self-reports from older respondents. Among these, 94% were consistent in their reporting of birth order in the two questionnaires, thus the full sample was used for the analysis of reliability of self-reported birth weight over time. The ICC between the values reported in the earlier (Q1, 1979–1982) and later (SFH, 2014–2015) questionnaire was 0.86, which indicates high consistency in recall, and the limits of agreement were +725 and −659 grams above and below the mean deviation. This indicates substantial agreement, on par with the other studies, but less accurate than the SHF sample compared to MBRN records. Although earlier and later self-reports are highly consistent, limits of agreement are about 50% larger than between self-reports and MBRN in the restricted sample. If we assume, as mentioned above, that accuracy is partly a function of age, then these limits are even wider when factoring in that the earlier self-reports also deviates from actual recorded birth weight.
We conducted a series of analyses to explore how well self-reported birth weight corresponds with actual measured birth weight. Although there are not exact criteria by which to answer this question conclusively, convergence of results from the different types of analyses we have done provide good insights about how well self-reports perform. Another complementary approach is to investigate bias. To what extent would the differences in self-reported and MBRN mean in terms of bias or accuracy? One way to estimate this would be to replicate previously reported associations with birth weight in our sample — for example, the association between birth weight and irritable bowel syndrome (Bengtson et al., Reference Bengtson, Ronning, Vatn and Harris2006). However, our restricted sample was too small to test this association using self-reported birth weight. We therefore analyzed the known association between birth weight and BMI. Our aim was not to test the hypothesis that birth weight is a predictor of adult BMI, but rather to determine whether differences in the parameter estimates were indicative of bias and informative on the agreement between the two measures. For this reason, a simple unadjusted model was sufficient. The positive association between birth weight and adult BMI was more pronounced in the model using self-reported birth weight than the model using MBRN birth weight. Although there was no significant difference between the β coefficients in the two models, the differences show that this degree of reporting errors in birth weight can affect conclusions regarding associations between birth weight and health outcomes later in life (Rasmussen & Johansson, Reference Rasmussen and Johansson1998; Sorensen et al., Reference Sorensen, Sabroe, Rothman, Gillman, Fischer and Sorensen1997; Tehranifar et al., Reference Tehranifar, Liao, Flom and Terry2009).
The within-pair correlations provide another way to evaluate agreement. Differences in within-pair correlations between self-reported and registry-based birth weight can also be used to estimate variance components of the recall bias. Our sample with both self-reported and registry-based birth weight included only 186 complete pairs, and when stratified by zygosity, the confidence intervals of the within pair correlations were overlapping and too wide to draw conclusions regarding the differences between self-reported and registry-based birth weight (data not shown). However, analyses conducted in our sample at large, comparing twin pairs born 1935–1960, for whom we have only self-reports, and twins born 1967–1974, for whom we have registry-based birth records, revealed no large or systematic differences in the within-pair correlations (data not shown).
Our findings indicate a high degree of correspondence between self-reported birth weight official birth records for cohorts born 1967–1974. We also found high consistency in self-reports of birth weight over time among the respondents in our sample born before 1967.
Limitations
The question whether two measures agree is dependent on the definition of agreement, which again is context dependent. What constitutes an acceptable limit of agreement has to be resolved on a case-by-case basis. Both the expected effect of exposure and the power of the study will be of importance here. Our analysis of birth weight and adult BMI showed that when the effect of the exposure is small, differences in significance level occurred, although the two models were not significantly different.
A more concrete limitation regards an eventual selection bias. Less than 50% of those responding to the SFH questionnaire reported their birth weight. Of those respondents for whom we have registry-based birth records in MBRN, 31% did not report their birth weight. Analysis of MBRN birth weight for those who have self-reported birth weight > 500 grams (n = 537) and those who do not (n = 240), revealed significant differences in means and variances at p < .05 level. Registry-based birth weight among twins with self-reported birth weight averaged 108 grams less than the registry-based birth weight for those who did not report their birth weight. We can only speculate about the reasons for this. Perhaps the lower mean MBRN birth weight among those who reported their birth weight compared to the group that did not reflects that lower birth weights are more ’dramatic’ and may be more memorable. This is suggested from anecdotal evidence from NTR, where twins often commented in questionnaires on how small they were as newborn twins — for example, that they could ‘fit in a drawer’. The consequences of these differences and analyses aimed at elucidating patterns of missing values are beyond the scope of this paper, but are important to follow up in further analysis. For the purpose of using self-reports as a valid measure of birth weight, this difference suggests that samples that rely on self-reports are not necessarily biased towards heavier birth weights.
Another limitation is that our analyses relying on actual birth weight were restricted to the cohorts born 1967–1974. If there were cohort effects in the degree to which self-reported and actual birth weight correspond then we were unable to investigate these and this could limit the generalizability of our results to other birth cohorts. Our analysis of the consistency between the Q1 (1979–1982) and SHF questionnaire (2014–2015) rather says something about the consistency of memory and not about the accuracy thereof. Indeed, it could be argued that since measures of agreement are sample specific — that is, descriptive — any generalization of the results presented here is questionable, or at least must be applied cautiously.
Conclusion
From a sample of Norwegian twins we assessed agreement between self-reported birth weight and officially registered birth weight from MBRN. Several measures of agreement were explored. The ICC showed substantial agreement and limits of agreement were less than 500 grams from the mean deviation. PPV and sensitivity was high, which shows that self-reported birth weight is mostly correct on a categorical scale. Together, these different assessments provide a comprehensive picture of the agreement between the two measures. Validity will be context determined, depending on expected effect size of the exposure and the power of the sample. Applied to the association between birth weight and adult BMI, only minor non-significant differences between the two models were evident. In our opinion, self-reported birth weight, depending on context, can be cautiously used. This study adds to the literature on accuracy of self-reported exposures or conditions. Few countries have nationwide health registries or official birth records that are easily accessible, and thus researchers must rely on self-reported birth weight. Therefore, individual studies that rely on self-reports of birth weight for critical analyses may consider ways in which they can assess potential bias in their birth-weight measures using other data that are available.
Acknowledgments
We thank the twins for participation in the SFH study and their long-time engagement in NTR. This research received no specific grant from any funding agency, commercial, or not-for-profit sectors. None of the authors have any conflicts of interest to report.


