


Introduction
The Dome C site (74°30'S, 123°10'E, surface elevation 3 240 m) on the East Antarctic ice sheet has recently been the focus of glaciological investigations. In preparation for projected deep drilling, and the interpretation of the ice core, we have conducted surface stratigraphic and ice-flow measurements. This paper reports the results of snow-pit studies and accumulation stake measurements.
Knowledge of current accumulation rate is necessary in developing time scales for deep ice cores and in ice-flow models. To obtain this information, one must interpret accurately the snow stratigraphy which in turn requires an understanding of the important processes in the formation and preservation of the stratigraphic record. Knowledge of the temporal and areal variability of accumulation is also required,firstly, so that one may know how representative of a certain region are the results from one ice core, and, secondly, in the stratigraphic interpretation itself. Because of the low mean annual accumulation at Dome C, averaging 34 kg m−2 a−1over the period 1955–79, special attention has been given to the reliability of conventional snow stratigraphic techniques.
stratigraphy at Dome C is presented in terms of depositional and post-depositional processes, and is based on snow-pit studies and snow accumulation measurements in stake arrays. Detailed measurements of snow-surface elevation changes have allowed us to study the development of an annual accumulation layer. A detailed comparison of two adjacent snow-pit profiles has enabled us to assess the horizontal continuity of deposited snow layers and the period for which those layers are preserved as they become buried (Palais unpublished).
Evidence from several sources (Reference Taylor Taylor 1968, Reference Jouzel, Merlivat, Pourchet and LoriusJouzel and others 1979, Hogan and Reference Hogan and BarnardBarnard 1978 Reference PalaisMosley- Thompson 1980) suggests a cyclicity in atmospheric processes in Antarctica which is recorded in the snow layers as annual cycles of impurity concentrations. Such a cyclicity has already been demonstrated at several sites in Antarctica (Reference Jouzel, Merlivat, Pourchet and LoriusJouzel and others 1979, Reference Merlivat, Jouzel, Robert and LoriusMerlivat and others 1977, Reference Mosley-ThompsonMosley-Thompson 1980).
Assuming that the cyclic deposition observed at these other stations also exists at Dome C, it is important to know the effect of the lower mean annual accumulation there on the preservation of this cyclicity. We normally assume that a direct relation exists between the atmospheric concentration of the measured impurity and its concentration in the snow. For example, several authors (Reference ThompsonThompson 1977, Reference PalaisMosley- Thompson 1980) assume a direct relation between the total atmospheric aerosol concentration and insoluble microparticles concentration in firn and ice, although this needs verification through direct measurements. Dilution of impurity concentration by increased precipitation and enhancement by dry fallout can occur. Finally, post-depositional surface redistribution and vapor transfer, on the surface and at depth, may affect the concentration of microparticles, gross e-radioactivity, and other impurities.
The Development Of The Snow Stratigraphy
We believe that the record preserved in the snow stratigraphy at Dome C is dominated by the combined effects of (1) the annual cycle in atmospheric processes, (2) irregular surface deposition and erosion, and (3) diagenetic processes occurring after burial, largely in the uppermost half meter of the profile. Diagenetic alteration of the snow stratigraphy and the disturbances produced by separate storm events are not clearly recorded in the firn stratigraphy. Here we consider only the effect on near-surface visible, microparticle, and gross B stratigraphies and we ignore the long-term diagenetic processes producing general densification and recrystallization with depth.
During the summer, irregular snow deposition and occasional snow erosion produce small undulations which are laterally discontinuous. These depositional forms are to a large extent preserved by thin crusts which usually are produced at the surface in late summer and subsequently burled. We are not certain how these crusts form. However, in all cases they occur just above peaks in the microparticle and gross B-radioactivity profiles. The crusts are thus very important in interpreting annual layers in deeper stratigraphy for, although the crusts may no longer be easily recognizable after firnifaction, the peaks in the microparticle and gross B profiles usually are
Accumulation stakes
Two networks of stakes were established at Dome C in order to measure the mean annual snow accumulation and its spatial variability. The mean annual accumulation for the year 30 December 1978 to 30 December 1979 in a network of 95 accumulation stakes arranged in a cross with 1 km spacing, is 35 kg m−2 a−1, with a standard deviation of the mean of 2.5 kg m−2 a−1 and on a single point of 24 kg m−2 a−1. These values compare well with similar measurements by Petit and others (in press) and with those obtained in snow-pit studies.
The standard deviation on a single measurement is large compared with the mean. At first, we believed that this was due to the presence of sastrugi and, in order to investigate this possibility, we established a 100-pole accumulation network with pole spacing of 3 m, which is about half the wavelength of the sastrugi. If sastrugi are mainly responsible for the variability, the statistics from the closelyspaced pole network should be similar to those with widely-spaced poles.
This small-area accumulation network yielded a mean accumulation rate (5 December 1978 to 30 November 1979) of 62 kg m−2 a−1, with a standard deviation of the mean of 2.8 kg m−2 a−1 and of a single measurement of 28 kg m−2 a−1. The mean for this network is different from that for the larger network, which suggests that there is an important variability in accumulation rate on a scale between 30 m (the linear dimension of the small network) and 60 km (the linear dimension of the large network) and that the variance is only partly explained by sastrugi.
Corroboration of this broader-scale variability comes from observations of surface roughness, both from surface and from aircraft. In the large-area network, the surface along the northern and eastern arms was smooth, and the standard deviation of accumulation was relatively small (36±18 and 29±17 kg m−2 a−1). Along the south and west arms, with much rougher surface conditions, the accumulations were 34± 29 and 32±23 kg m−2 a−1. The cause of these variations is not known, but they are of about the correct scale to explain the observed variability of accumulation rates.
From the relative elevations of the poles in the dense network, and the position of the snow surface on each pole, the surface roughness, measured by the standard deviation of the surface elevation, has beensix different measurement times in the two summers. If the roughness is preserved with burial, then the standard deviation of the thickness of a depositional layer should be /2 times this value. From the data of Petit and others (in press), the total accumulation layer between 1955 and 1965 averages 27.0 kg m−2 a−1, with a standard deviation for this thickness equivalent to 0.095 m snow. This is equivalent to an original surface roughness of 0.067 m of snow: the similarity of this with the direct surface roughness measurements strongly suggests that surface roughness is preserved during burial.
The probability of losing a year's accumulation, due to non-deposition or erosion, can be estimated from the number of stakes showing either no accumulation or net ablation. In the small-area accumulation network, no stakes had zero or negative balance, leading initially to the conclusion that there would be no chance of missing a year's accumulation in an ice core at Dome C. However, because this network had an abnormally high mean accumulation for that year, the conclusion may not be strictly valid. We therefore made a similar analysis in the large-area accumulation network, where six of 95 stakes showed a zero or negative balance for the year 1978–79. This value agrees with Petit and others (in press), who estimate that there is a 10% chance of missing a year's accumulation.
A study of the temporal development of an annual accumulation layer was made in the small-area accumulation network.Figure 1 summarizes several profiles of surface elevation in rows and diagonal traverses through this network. The dashed lines mark snow surface elevation at the beginning of the summer and the solid lines mark it at the end of the summer season. The hachured area in each figure represents the snow accumulation between the end of the 1978–79 season and the end of the 1979-80 season. Most of the accumulation is in the winter. The process of sublimation-deflation at the South Pole described by Gow (1965) is less intense at Dome C, producing only small changes in surface elevation (less than 0.005 m average at the 100 points) from the beginning to the end of each austral summer season. In general, low areas are filled in and high spots are lowered, but this process does not completely remove the largescale (˜10 m wavelength) surface roughness as it does at the South Pole. This is probably because there is less wind and therefore less deflation at Dome C.
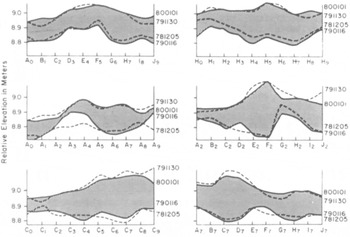
Fig.1. Profiles of the relative surface elevation in the small-area accumulation network, at Dome C East Antarctica, showing changes in surface topography from the beginning of the austral summer 1978-79 to the end of the austral summer 1979–80. Spacing between stakes is 3 m. Abscissa marks are individual pole designations; letters indicate columns; numbers indicate rows in the array.
Although we anticipated that identifiable patterns of accumulation would be discernible, a statistical analysis of the surface elevations of all points in this network shows that the accumulation is unrelated to surface form, which allows us to use the relationship between surface roughness and layer thickness, given previously.
Snow-pit studies
Snow stratigraphy, revealed in walls of several 3 m snow pits at Dome C, and one about 100 km grid east, was studied both to obtain an estimate of the long-term mean annual accumulation and to investigate the processes which are important to the formation and preservation of the stratigraphic record. Several techniques, including observation of the visible stratigraphy, measurement of gross B-radioactivity, and analysis of microparticle concentration, were used.
The non-uniformity and discontinuous nature of the snow strata make the recognition of annual layers and their correlation from site to site difficult. However, detailed observations of the physical properties and sampling of individual snow layers have allowed an accurate dating and interpretation of the snow layers. The physical characteristics used to identify annual layers are based to some extent on those identified by Gow (1965) at the South Pole and Koerner (1971) at Plateau station.
Several types of snow layers were identified inDome C snow pits (Fig.2). Thin hard crusts, which are believed to mark the surfaces of buried late summer sastrugi, are common. These crusts typically overlie soft to medium-hard thick layers, which are believed to represent the bulk of the annual accumulation, this being deposited between the early autumn and early spring. Occasionally, thin (<0.02 m), lowdensity, depth-hoar layers occur under the thin crusts which, however, cannot be used to define annual layers, as was done by Gow (1965) for the South Pole, because they are not always laterally continuous and they do not appear to be present every year.
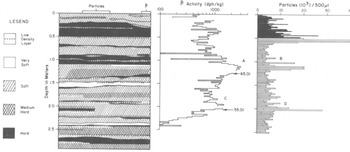
Fig.2. Visible stratigraphy, gross e-radioactivity, and microparticle profiles from a 3 m pi study near small-area accumulation network.
Following Gow (1965), the particularly thick crusty layers are interpreted as having formed over at least a two-year period, by exposure to wind, radiation, and vapor transfer, during a hiatus in snow accumulation. Occasionally, thick sections (up to 0.20 m) of very soft, low-density firn with a friable, “sandy” texture are observed. This firn is believed to form by continued vapor loss during several years of exposure to strong near-surface temperature gradients.
Profiles of gross e-radioactivity allow the identification of two reference levels in the snow pits at Dome C, those for January 1955 and January 1965, (Petit and others in press), and hence the determination of mean annual accumulation for the time intervals 1955–79, 1965–79, and 1955–65. For four pits, the means for these periods were 34.3±1.9, 37.5±1.7, and 29.5±3.1 kg m−2 a−1, respectively.
In addition, the gross e-radioactivity profiles in pits at Dome C show seasonal variations, as found previously elsewhere in Antarctica (Reference Lockhart, Patterson and SaundersLockhart and others 1966, Reference Lambert, Ardouin, Sanak, Lorius and PourchetLambert and others 1977, Reference Jouzel, Merlivat, Pourchet and LoriusJouzel and others 1979). Usually the peaks are not defined well enough to allow unambiguous identification of annual layers using the 6 profiles alone, but, in conjunction with the visible stratigraphy, all the annual 6 peaks can be located or the places where B peaks might be missing or smoothed (hiatus-type layers) can be identified.
Peaks in the profiles usually occur just below the thin hard crusts, in the thick soft to medium-hard, coarse-grained layers. The hard crusts themselves are normally low in s-radioactivity. This variation probably reflects the time of the annual maximum of atmospheric radioactivity. If the soft layers are the accumulation occurring between autumn and spring and the thin hard crusts formed 1n late summer, then the 3 concentration peak is consistent with the spring to early-summer atmospheric radioactivity maxima, predicted by Lockhart and others (1966).
The B-radioactivity profiles from the pits with the highest accumulation have the best-defined annual peaks. Perhaps in the future more detailed sampling will allow an even better resolution of s-radioactivity peaks for dating purposes.
Detailed microparticle analyses were made on samples from four of the 3 m snow pits. Peaks in the particle concentration profiles were identified, assuming that (1) a direct relation exists between the concentrations of total atmospheric aerosols and of Insoluble microparticles in the snow, and (2) seasonal fluctuations in total aerosols (summer maxima-winter minima), described by Hogan and Barnard (1978) for the South Pole, also occur at Dome C.
Interpretations of the microparticle profiles are made in conjunction with the profiles of gross 6-radioactivity and with the visible snow stratigraphy, thus allowing another estimate of the mean annual accumulation and the proportion of “annual” peaks missing in the profiles.
If the microparticle profiles are indeed recording depositional events, then the scarcity of welldefined particle peaks and the variation in the shape and concentration of the peaks indicate that snow accumulation at Dome C is not uniform throughout the year, especially at the time when atmospheric particle concentrations are highest. Several examples of well-defined microparticle peaks are observed in the Dome C profiles. These probably formed during a period of high concentration of particles in the atmosphere and fairly continuous snow deposition.
high microparticle concentrations, alternatively, may be due to sub-surface diagenesis. most microparticle peaks are in the medium hard to soft coarse firn which has been affected by vapor loss. this feature is especially well developed in figure 2 at 0.05 to 0.60 m and at 1.10 to 1.20 m depth; here, vapor loss has produced a particle concentration in one layer and the vapor has recondensed in the overlying layer, thickening the crust and lowering the microparticle content.
The concentration peaks of the microparticle and the gross B-radioactivity profiles do not coincide. In some cases (e.g. Fig.2, A and B), the B concentration maximum appears to have arrived prior to the microparticle maximum, and in other cases (e.g. Fig. 2, C and D), this pattern is reversed. Probably this lack of direct correspondence follows from complex variations in atmospheric concentrations of impunities combined with the effects of surface redistribution during burial.
Conclusion
An explanation is proposed which suggests that features in the annual accumulation layers are formed mainly by depositional and near-surface diagenetic processes. These layers are preserved by the formation of a thin hard crust on the surface in the late summer. The conclusion that annual units of accumulation are preserved with depth is supported by both the pit studies and surface stake measurements.
The chance of losing a year's accumulation in any site due to non-deposition or erosion ranges up to about 6%. This range may be attributed to a broadscale variability in snow accumulation rates. A detailed study of the development of an annual accumulation layer at Dome C shows that the processes controlling accumulation are not related to surface form and that the bulk of the accumulation occurs at times other than the austral summer. Only small changes in surface elevation occur during the summer: they are due to the process of sublimation-deflation described by Gow (1965).
Annual accumulation units can be recognized in the snow pits. They Involve thick soft layers topped by thin hard crusts, sometimes separated by a thin depth-hoar layer. The crusts and depth-hoar layers form during the late summer and early autumn, respectively, by processes of near-surface diagenesis, involving effects of wind and solar radiation and strong temperature gradients. Gross e-radioactlvlty and microparticle analyses can be used to identify annual layers of accumulation, provided that detailed information on the visible stratigraphy Is available for comparison.
Acknowledgements
This work was supported by National Science Foundation grant DPP76-23428 to Dr I M Whillans. Thanks are due to Drs Lonnie Thompson and Ellen Mosley-Thompson for microparticle analyses at the Institute of Polar Studies, Ohio State University, and to Robert Tope for drafting the diagrams. Gross B-radioactivity samples were processed by the Laboratoire de Glaciologle et Geophysique de 1' Environnement, Centre National de la Recherche Scientifique, Grenoble.


