


It is a strange paradox that at the very moment cultural resource management (CRM) in the United States is about to embark on its greatest expansion since the passage of landmark laws in the 1960s, many US graduate programs in anthropology, historic architecture, history, and historic preservation are in danger of scaling back. The disconnect between the potential job market and the supply of qualified CRM professionals might be of little more than academic interest if it were not for the fact that a failure of CRM to meet regulatory compliance needs—particularly of politically charged infrastructure projects—could undermine and dramatically alter the country's historic preservation framework.
In this article, we examine the current economic state of the CRM industry,Footnote 1 analyze the effect on the CRM labor market of forecasted growth in the US economy and increased CRM activity due to the Infrastructure Investment and Jobs Act, passed in November 2021 (herein referred to as the “infrastructure bill”),Footnote 2 and project both the number of jobs needed to meet CRM demand and the number of qualified people entering the job market over the next decade. We estimate that annual CRM spending will increase from about $1.4 to $1.85 billion from the beginning of US federal fiscal year (FY) 2021 to the end of FY 2031 (US federal fiscal years run from October 1 to September 30) and that about 11,000 new CRM jobs will need to be filled. Nearly 8,100 of the new jobs will be in archaeology, and of these, about 5,700 will require an advanced degree (MA or PhD). If all archaeologists graduating from current graduate programs in the next decade entered CRM (about 3,250), we would still have a job deficit for MA/PhD CRM archaeologists of about 2,400. Unquestionably, the job deficit is significantly larger.
But it is not only the projected job deficit that needs to be addressed. The training of those entering CRM needs to be readjusted to focus substantially more on CRM as opposed to a nearly exclusive emphasis on academic-oriented anthropology and archaeology, historic architecture, and history. To address issues revolving around training, in addition to the projected workforce needs in CRM, we offer a number of recommendations based on our experiences in training and working with CRM students and young professionals as well as the results of our discussions with state Departments of Transportation and State Historic Preservation Offices (SHPO). These recommendations are offered less as concrete steps than as an initial framework for future discussions, given that we realize there are a number of other issues and concerns that will need to be addressed by all involved in CRM and in the training of CRM professionals.
Finally, we argue that the quantity of CRM archaeology conducted in the upcoming decade has great potential to address many issues but will only reach that potential if academic and applied archaeologists (a) collaborate on the establishment of data standards and the creation of synthetic research tools, (b) join together in pursuit of research goals that benefit the public, and (c) shift from project-based to landscape-scale management.
THE STATE OF THE CRM INDUSTRY IN FY 2020
In 2020, the SRI Foundation (SRIF), a not-for-profit organization dedicated to the advancement of historic preservation, published its estimate of the amount of money spent on CRM in the United States for FY 2020 (i.e., October 1, 2019–September 30, 2020).Footnote 3 CRM spending is defined by SRIF to include all expenditures for public and private sector goods and services (including salaries, facilities, equipment, etc.) necessary to meet regulatory requirements for cultural resources at federal, state, tribal, and municipal levels. The SRIF estimate of about $1.4 billion, provided in Table 1, is divided into five categories that range from secure estimates to educated guesses (SRIF 2020). The most secure estimates are those that are line items in the budgets of federal agencies approved by Congress and the president of the United States. Many of these line items are part of the Historic Preservation Fund (HPF), which finances matching grants to SHPOs and Tribal Historic Preservation Offices (THPOs) to fund consultation on federal projects, maintenance of historic property inventories/files, nomination of properties to the National Register of Historic Places (National Register), and grants and assistance to local jurisdictions. The HPF, which was established through the National Historic Preservation Act (NHPA) in 1977, is appropriated by Congress annually, with the federal government providing 60% of the funding, matched by a 40% contribution by the states. Tribes receiving HPF funds do not have to contribute a match. The amount reported in Table 1 represents the federal share of the HPF for FY 2020. The HPF has increased in the last two years, and in FY 2022, it reached $173 million.
TABLE 1. FY 2020 Estimate of CRM Spending in the United States.

a Historic Preservation Fund programs and grants, for a total of $127.22 million.
As noted, SHPOs and THPOs use HPF monies to fund their participation in consultation on federal projects. This consultation process is required under Section 106 of the NHPA. Section 106 of the Act requires federal agencies to take into account the effects of their actions (be it funding, approvals, or permitting) on properties that are listed in or eligible for listing in the National Register, and federal agencies do so in consultation with SHPOs, tribes, and other parties involved in the Section 106 review process. Appropriations to federal agencies, which is discussed next, include funding for these agencies to fulfill their responsibilities under Section 106 of the NHPA.
The second category of CRM funding includes federal agencies whose CRM budgets are packaged with other activities in their allocations from Congress. For example, the US Forest Service (USFS) combines recreation, heritage, and wildlife as a budget line, and it uses an allocation formula of 10.5% to determine CRM spending for the agency. The biggest CRM spender in this category is the Department of Defense (DOD), which budgets natural and cultural resource management as a single activity. SRIF assumed that CRM is a third of this line item, which is probably conservative, although no one actually knows. DOD also funds CRM services through the Joint Prisoner of War / Missing in Action Accounting Command (JPAC). To calculate total CRM DOD funding, SRIF summed program estimates from different accounting reports. Although each DOD estimate is subject to error, SRIF's estimate of total CRM spending is reasonable, albeit conservative.
In a third category, SRIF placed federal agencies that have no budget lines for CRM programs but that fund CRM out of project budgets instead. Of these, the most important—and the most difficult to estimate—is the Federal Highway Administration's (FHWA) various surface transportation programs. FHWA allocates money to state Departments of Transportation (DOTs) for specific transportation projects on a formula that cost shares these projects with the states. Complicating matters, states can fund CRM activities with federal funds or use their own state funding. In addition, many DOTs do not separate out CRM expenditures from other project costs, such as National Environmental Policy Act (NEPA) analyses and project engineering design. As a result, calculating DOT CRM funding is extremely difficult. In 2008, Altschul (in Altschul and Patterson Reference Altschul, Patterson, Ashmore, Lippert and Mills2010:294), with Klein's assistance and the help of then FWHA archaeologist Owen Lindauer, estimated DOT spending—including federal funding and the states’ matching funds—at between $4 and 5 million per state.
As part of this article, the authors surveyed a sample of 28 state DOT cultural resource managers on spending information as well as projections for the next several years. The survey was conducted between September and mid-November 2021, prior to the passage of the infrastructure bill. Although the survey was completed in FY 2022, the prevailing economic conditions are similar to those in FY 2020. Twenty DOTs responded to the survey. The responses show wide variations in the amount spent on CRM by different states. As expected, several of the state DOTs responded that CRM spending was difficult to track or completely unknown because the DOTs do not have a separate line item for CRM. Instead, they roll CRM expenditures into overall environmental compliance and project development costs. As a result, several of the DOTs were not in a position to forward an estimate. For the 11 states that responded with dollar figures (Supplemental Text 1), the average amount spent on CRM was just under $6.5 million. The standard deviation, however, exceeds $8 million, with a median of a little more than $3.1 million. Although we do not believe that the average of 11 reporting states can be generalized for the country (leading to an estimate of more than $300 million total for all state DOTs), we also are uncomfortable with using the median as a proxy (resulting in an estimate of about $150 million). It is important to point out that FHWA funding also goes to transportation agencies and offices within US territories, such as Puerto Rico, as well as tribal and municipal transportation programs, and some of these funds are used for CRM compliance projects. Including federal funding and the state's matching funds, the SRIF estimate of $250 million per year in CRM spending for transportation programs is a reasonable guesstimate for FY 2020 and the period immediately prior to the release of funds from the infrastructure bill.
CRM spending of other agencies in this category is equally difficult to estimate, although because of their relatively small size, not critical in terms of the overall CRM spending estimate. The one exception is CRM spending in response to federally declared disasters. SRIF placed all disaster-related spending under the Federal Emergency Management Agency (FEMA). Although FEMA is responsible for overseeing many of these activities, it is important to note that other federal agencies are involved in responding to disasters, such as forest fires (Department of Agriculture) and flood control (US Army Corps of Engineers [USACE] and the Bureau of Reclamation). Additionally, federal disaster declarations can result in emergency supplemental appropriations. After Hurricane Sandy, for example, New Jersey's HPF allocation (which generally is around $950,000) was increased by $12.1 million for six years (Katherine Marcopul [NJ SHPO], personal communication 2022). An additional $950,000 was allocated by the Department of Housing and Urban Development (HUD) for Section 106 mitigation activities related to housing recovery. CRM spending related to disaster relief is entirely dependent on the number of federal disasters declared in a year. Unfortunately, this number is on the rise and the SRIF estimate is in all likelihood conservative.
The fourth and fifth categories—state, tribal, and local CRM spending (nonfederal government in Table 1) and private sector CRM spending—are educated guesses. Nonfederal government agencies spend some of their own money on CRM. States, for example, must provide a 40% match of federal HPF funding for their SHPOs. The SRIF estimate for nonfederal spending is probably low, but not so low as to greatly affect the overall estimate.
The final category, private sector spending, is significant but almost impossible to estimate in a verifiable manner. Each project is independent of another, and there is no centralized office at the federal, state, or local level that collects information on spending. For his 2008 estimate, Altschul (in Altschul and Patterson Reference Altschul, Patterson, Ashmore, Lippert and Mills2010) informally polled CRM business owners to forward the guesstimate that private sector CRM spending was 50%–100% of government spending. A decade later, SRIF (2020) argued that the 2008 estimate likely “double counted” some portion of private sector funding because so much of the work is subcontracted from large firms to small ones. For example, many private development projects—such as pipelines or solar energy fields—are contracted to large professional service firms as design-build projects, which means these firms count the entire contract price as part of their revenues. These firms, in turn, often subcontract the CRM portion of the project to a CRM firm, which counts the contract price for CRM services as part of its total revenues. When queried about their revenues, both firms will include the same CRM dollars for this project. To remedy the situation, SRIF downgraded private sector CRM spending to 50% of government spending.
Figure 1 graphically summarizes the SRIF estimate. Federal spending for defense- and transportation-related services account for about one-third of CRM spending. All other federal agencies—such as the National Park Service (NPS), USFS, Bureau of Land Management (BLM), and so forth—are responsible for about 12% of CRM spending, whereas all other government spending (e.g., federal grants, state and tribal programs, municipal activities) account for about 14% of the total. Another third of CRM activities is financed by the private sector. The HPF accounts for 9% of the total.

FIGURE 1. Percentage breakdown of CRM spending for FY 2020.
It is worth pointing out that the second half of FY 2020 coincided with the beginning of the COVID-19 pandemic. The effects of the pandemic on the CRM industry are not well understood. Although there is no indication that government spending was affected, CRM business leaders expected the private sector to suffer (Dore Reference Dore2020). CRM, however, was considered an “essential” industry (Douglass and Herr Reference Douglass and Herr2020), and because of this, the worst was not realized, and the downturn was less than anticipated. There is anecdotal evidence that firms laid off or slowed hiring of some personnel, but this pause in the labor market was short lived and replaced by early FY 2021 with a significant labor shortage. With this in mind, we believe that the SRIF estimate is, for the most part, an accurate picture of CRM spending in FY 2020, and we will use the figure of $1.4 billion as our baseline estimate of CRM spending for the period immediately prior to the passage of the infrastructure bill. We remind the reader that given the uncertainties in the estimate, it is best to look at trends in the subsequent analysis as opposed to absolute numbers.
EXPECTED GROWTH IN US CRM SPENDING FROM FY 2021 THROUGH FY 2031
In Table 2 we present our estimates of CRM spending and projections of the CRM labor market from the beginning of FY 2021 to the end of FY 2031. The first six columns of the table are devoted to the economic forecast. We begin with the SRIF estimate of $1.4 billion for FY 2020 and multiply it by the percentage change in real gross domestic product (GDP; as opposed to nominal GDP to account for inflation) from the previous year to the current year estimated by the Congressional Budget Office (CBO 2021). We then sum this result with the projected CRM allocation from the 2021 infrastructure bill to reach an estimate of total CRM spending for that fiscal year.
TABLE 2. Economic Forecast of the CRM Industry and Job Market, FY 2021–2031.

The growth in CRM due to growth in the US economy is complicated. CRM activities are driven by activities such as highway improvements, expansion, and new construction; real estate development; energy development; and so forth. Given that these activities are part of GDP, changes in GDP—up or down—should be reflected in CRM spending. But GDP, which measures the value of goods and services produced in the United States, is a gauge of the overall economy, and its relation to a service industry such as CRM is at best indirect. With the exception of FY 2021 and 2022, CBO estimates of changes in GDP are relatively small and trending lower for the rest of the decade. The result is to project strong growth in CRM for the near term, with little growth thereafter (Figure 2). This projection seems reasonable, though the reader should be aware that the projections become more tenuous as the decade unfolds.

FIGURE 2. Expected CRM spending in the United States, FY 2021–2031.
The Effect of the Infrastructure Bill
The main driver of new spending in CRM during the upcoming decade is the infrastructure bill (White House Reference House2021). The bill authorizes $550 billion of new spending. The bill also includes the reauthorization of the federal surface transportation program, resulting in a total of $351 billion for highways. This includes $110 billion in new funds for roads, bridges, and major projects. In its analysis of the bill, the American Association of State Highway and Transportation Officials (AASHTO 2021)—a nonprofit, nonpartisan association representing state DOTs—concludes that FHWA spending for highways will increase from $49 billion in 2021 to an average of $70 billion between 2022 and 2026, or more than 40%.
Although the bill is quite complex, McKinsey and Company (2021) simplifies the spending allocations by dividing it into two categories (Table 3). The bill authorizes $284 billion in new transportation funding, which—in addition to roads, bridges, and major projects—includes public transit, railroads, airports, and ports and waterways. The remaining $266 billion will be expended on enhancing core infrastructure, including water, electrical grids, broadband, and environmental remediation.
TABLE 3. Infrastructure Investment and Jobs Act, Allocation of New Spending (Mckinsey and Company 2021).

Estimating how much of this money will be spent on CRM is fraught with uncertainty. The FHWA and state DOTs will receive the bulk of the new $110 billion allocated to roads, bridges, and major projects. Although our survey of state DOTs was sent out prior to the passage of the infrastructure bill, which included reauthorization of the surface transportation bill, the major elements of the bill were well known. State DOTs were already making plans based on the passage of the bill and therefore were in a position to answer, or at least comment on, the following questions about the DOT's FY 2022 and FY 2023 budgets:
• What is your current CRM-related budget for FY 2022? How much do you think will go to your CRM contractors (dollar amount and/or percentage)? How much of contracted work will go to archaeological, as opposed to historic architectural, work (dollar amount and/or percentage)?
• With the possible passage of the reauthorization of the surface transportation bill, how much do you think your CRM-related budget will increase next year (FY 2023) in dollars or in percentage?
• With the possible passage of the infrastructure bill currently being considered by Congress, how much do you think your CRM-related budget would increase next year (FY 2023) in dollars or in percentage?
The survey also asked DOTs about the ability of their current staff and those of their CRM contractors to handle current workloads, in addition to future workloads resulting from the passage of the infrastructure bill.
A summary of our survey of state DOTs is presented in Supplemental Texts 1 and 2. Several state DOT managers replied that the focus of new spending will be on “shovel ready” projects. The definition of “shovel ready” projects varies among the state DOTs. In some cases, these are projects that have been in the pipeline for some time, with all CRM compliance completed. In other cases, work has been completed on identifying historic properties and evaluating project effects on these properties, but carrying out measures to resolve adverse effects to historic properties remains to be done. As stated in the Section 106 regulations, resolution of adverse effects involves avoiding, minimizing, or mitigating these adverse effects. And in some situations, especially in highly urbanized areas, DOT projects have limited options for minimizing or avoiding adverse effects to historic properties, potentially resulting in some rather large mitigation efforts.
Several state DOTs have statewide Section 106 programmatic agreements with FHWA and their respective SHPO that allow the state DOTs to conduct reviews of certain classes of projects without FHWA participation or SHPO consultation. The internal review process set up through these programmatic agreements results in streamlined Section 106 compliance and expedites the delivery of these classes of infrastructure projects. Some state DOTs note that they will have to increase their use of these streamlined Section 106 reviews to deal with the increased number of projects funded through the infrastructure bill. They anticipate that states that do not have such agreements will develop them to alleviate some of the increased workload.
The types of projects that can be reviewed under this streamlined process are agreed upon by the transportation agencies, SHPOs, and other consulting parties. The vast majority of these projects, which include actions such as resurfacing and repaving roads or repairing and improving road shoulders and culverts in already disturbed soils, have minimal potential to affect historic properties. Importantly, the individuals conducting these reviews must meet qualifications specified in the programmatic agreements.
Many transportation-related infrastructure projects—particularly those in the eastern and, in some cases, upper midwestern states, and in California—fall under the category of system preservation and maintenance. Such projects, which generally fall within existing roadway footprints, will require some, but not a lot, of additional CRM compliance. The situation in other areas of the United States, however, is different. Some western and southeastern projects are quite large, involving expansion of existing infrastructure or new construction, and they cover areas with relatively large numbers of archaeological sites, historic buildings and structures, and traditional cultural properties.
In terms of future CRM expenditures, the majority of responding DOTs stated they were not able to project future CRM budgets (i.e., FY 2023) that would result from the infrastructure bill. Those that could were not able to provide dollar amounts, but they noted anticipated percentage increases ranging from 5% to 35%, with one DOT stating that it expected no changes in its workload.
Several of the responding DOTs said their CRM contactors are experiencing challenges maintaining and increasing their workforce, mimicking the challenges the DOTs are experiencing with hiring internal staff. Those states that anticipate contracting out more CRM work this fiscal year, and as a result of the infrastructure bill, are concerned that if all states are sending more work to contractors, the private sector might not have enough capacity to handle the work (see Supplemental Text 2).
Importantly, no DOT (or SHPO, see below) that responded to our survey mentioned concerns about changes to NHPA or NEPA compliance, such as exemptions for certain types of projects or the relaxation of compliance requirements. Without significant changes in compliance requirements, additional infrastructure projects will require the same level of CRM activities as those performed under the current surface highway transportation program reauthorization. It is possible that infrastructure spending by state DOTs will be slightly less than the proportion currently expended on CRM from the last surface transportation reauthorization bill due to (a) the focus in the East, the upper Midwest, and California on system preservation and maintenance as opposed to major expansions and new construction; and (b) the fact that the recurring costs of DOT personnel (salaries and benefits) have already been accounted for in annual DOT budgets. State DOTs anticipate hiring some new staff due to an increase in workload with the passage of the infrastructure bill, but large increases in staff costs are not anticipated given projected workloads or state restrictions in hiring more staff (See Supplemental Text 1 and 2 on results of SRIF's state DOT survey). However, it is also important to consider that infrastructure projects will almost certainly include several large mitigation projects, such as archaeological data recoveries or recordation of historic buildings and structures (e.g., Historic American Buildings Survey or Historic American Engineering Record documentation), prior to project construction. One state DOT responding to the survey projected a $10 million cost for an archaeological data recovery program of 15 National Register–eligible sites associated with a major bridge project, and another DOT has two upcoming data recovery projects costing around $4 million to be expended over the next few years. Costs for mitigation projects are not included in the figures cited in Supplemental Text 1 because these are almost always project-specific expenditures. Just a few such mitigation projects would impact our estimate for DOT spending, and in all likelihood, there will be more than a few such projects in response to the infrastructure bill, especially in the context of new funding for major projects.
We see no reason, therefore, to project a change in the proportion spent on CRM services for roads, bridges, and major transportation projects. Accordingly, we adopt a spending proportion equal to the last surface transportation reauthorization prior to the passage of the infrastructure bill. Using our estimate of $250 million annually expended on CRM out of the FHWA's 2021 $49 billion highway transportation budget (AASHTO 2021) yields a CRM proportion of the FHWA budget of 0.0051. Consequently, our estimate for CRM spending on the $110 billion of new funding allocated to roads, bridges, and major projects under the infrastructure bill is $561 million (0.0051 × $110 billion).
Beyond roads, bridges, and major projects, there is another $174 billion in new funding for transportation infrastructure. These are a mixed bag of activities, some of which—such as ports and waterways—may involve archaeological and historic architectural investigations linked to USACE permitting and other federal agency actions; others (e.g., public transit, passenger and freight rail, airports, safety, electric vehicle infrastructure, electric buses and transit, reconnecting communities, and infrastructure financing) will at best have only minimal impact, or in the context of rail projects, may be exempt from Section 106 compliance under an Advisory Council on Historic Preservation's program comment on properties within rail rights-of-way (Advisory Council on Historic Preservation [ACHP] 2018). We estimate that the proportion of this new funding spent on CRM will be significantly less than that allotted to roads, bridges, and major projects (0.1%), resulting in a total of $174 million.
The last category of spending is “other infrastructure,” a catchall category that includes water, broadband, environmental remediation, power/grid infrastructure, water storage, and resilience. Many of these activities will be spread over several federal agencies and will include projects such as new electrical transmission lines, clean energy development (e.g., solar fields and offshore wind farms), and broadband deployment in rural areas. Such projects have the potential to affect historic properties. For example, placing broadband, undergrounding electrical/power lines, water conveyance/storm water, and so forth within state DOT rights-of-way (which in Western states run for hundreds of miles, extend well beyond the current road prism, and contain undisturbed soils) will require the full suite of CRM archaeological services. Environmental remediation, which includes vegetative management, is a key activity for the USFS, which expects a four-fold increase to its NEPA and NHPA workload. Not all activities will focus on terrestrial resources. Virginia anticipates a significant amount of work in underwater resource survey, assessment, and mitigation as part of the development of offshore wind farms (Northam Reference Northam2021). In addition, offshore wind-farm projects will have terrestrial components, such as electrical substations, that could impact historic properties. Although “other infrastructure” covers a wider range of projects that could be subject to CRM compliance, we suspect that dollar amounts spent on CRM will be significantly less than those spent on roads, bridges, and major transportation projects and more in line with “other transportation.” Consequently, we have estimated the proportion of this category spent on CRM to be 0.1%. The total allocated to other infrastructure is $266 billion, leading to an estimate of $266 million in CRM spending.
In total, we estimate that CRM will receive $1.001 billion from the $550 billion of new spending in the infrastructure bill. For modeling the impact of CRM spending on the job market in Table 2, we have rounded this estimate to $1 billion. Dispersing this money will take time. Although the administration is publicly committed to spending the money in five years, we suspect that spending will actually take much longer. The Wall Street Journal (WSJ) reports that the administration only expects to spend about $20 billion by the end of FY 2022, with a total of $125 billion expended by the end of FY 2024 (Stein and Laris Reference Stein and Laris2021). The bulk of the money will be spent during FYs 2025–2027, with spending ramping down thereafter. We have modeled spending of CRM dollars to generally follow the overall infrastructure spending projected by WSJ (Table 2 and Figure 2). However, in recognition that many CRM activities—particularly those associated with archaeological mitigation projects such as analysis, curation, and report writing—can occur years after field studies are complete, we anticipate a slower decrease in CRM spending than for overall infrastructure spending.
Anticipated Growth in CRM Spending from FY 2022 to FY 2031
We estimate that annual CRM spending will grow from about $1.46 to a little more than $1.85 billion in the 10 years from the beginning of FY 2022 to the end of FY 2031 (Table 2). In all likelihood, this estimate is conservative. It does not, for example, include any money from the Great American Outdoors Act (GAOA)Footnote 4 of 2020, which provides up to $1.9 billion per year between FY 2021 and FY 2025 to the NPS, US Fish and Wildlife Service, BLM, Bureau of Indian Education, and the USFS to perform deferred maintenance on Native American schools and on facilities located on public lands. Most of these projects are for repair or updates of existing infrastructure, including many buildings and transportation facilities (e.g., bridges and roads) that are historic in nature. As part of this article, the authors discussed the impact of the GAOA with the senior heritage managers at NPS and USFS. Although not in a position to provide dollar estimates, both agencies acknowledge that adverse impacts to considerable numbers of historic properties under their management will occur and will require CRM services. Joshua Torres (Acting Bureau Archaeologist, NPS; and Acting Department Consulting Archaeologist for the Secretary of the Interior) noted that FY 2021 and FY 2022 projects were already well into the planning stage, with environmental compliance (NEPA and NHPA) requirements largely fulfilled, when they were selected for funding (Joshua Torres, personal communication 2022). FY 2023–2025 projects, however, will need the full suite of environmental compliance activities, which he estimated at 5% of project cost. Assuming that GAOA is fully funded for those three years ($5.7 billion) and that CRM services account for half of environmental compliance expenditures, GAOA alone will add more than $140 million to CRM spending in the upcoming decade. All of this is to say that our estimate of CRM spending for FY 2022 through FY 2031 is conservative and that the projected job deficit discussed below is understated.
An increase of nearly $400 million in annual CRM spending from FY 2022 through FY 2031 represents a compound annual growth rate of 2.39%. It is worth pointing out that for the first seven years of this period, the compound annual growth rate is much higher: 3.82. This growth needs to be contrasted with the negative—or, at best, stagnant—CRM compound annual growth rate witnessed during the previous decade due, in part, to the lingering effects of the Great Recession and the COVID-19 pandemic. The poor economic CRM conditions of the 2010s led to fewer jobs and people leaving the field. They also are likely a factor in reduced enrollment in CRM-related programs, which may be the impetus for eliminating or scaling back these programs. Given that economic conditions have improved in FY 2021, it is not surprising that finding qualified personnel has proven difficult. But will this trend last? And, if so, how many jobs are needed?
BASELINE CRM LABOR MARKET: FY 2021
To estimate changes in the job market, we first need to establish a baseline of CRM jobs at the start of FY 2021. Over the last 15 years, a number of estimates of the CRM labor market have been proposed. In 2008, Altschul and Patterson (Reference Altschul, Patterson, Ashmore, Lippert and Mills2010:301) provided a range of between 11,000 and 17,000 full-time equivalents (FTEs) employed in some aspect of CRM, with a best guess of about 14,000. Due to the temporary nature of some CRM jobs, particular those in archaeology, they note that the actual number of individuals receiving compensation for CRM employment during any given year is substantially higher (about 30%) than the FTE count. In 2014, the American Cultural Resources AssociationFootnote 5 (ACRA) conducted a survey of CRM companies. From this survey, the organization estimated that the number of FTEs in private sector CRM was between 8,000 and 11,000 and that the number of FTEs had remained largely stable between 2008 and 2014 (American Cultural Resources Association [ACRA] 2014). Also in 2014, Rocks-Macqueen (Reference Rocks-Macqueen2014) estimated that, including both the public and private sectors, about 11,000 archaeologists in the United States worked in CRM. His estimate does not include specialists from other CRM disciplines (e.g., architectural history, historic architecture, history). Christopher Dore (Reference Dore2022) recently stated that there are about 15,000 people working in CRM for consulting firms. The number includes heritage professionals and support personnel but does not include those working in the public sector. These estimates are not directly comparable given that they cover different periods and differ in their methods and objectives. Yet they are not widely disparate, and taken together, they suggest a range of CRM FTEs in the neighborhood of 15,000–20,000.
In hopes of simplifying and creating a measure of industry size that is comparable and replicable for future studies, we use “revenue per employee” (RPE) to estimate the size of the CRM labor market. RPE is defined as the ratio of gross revenue to the number of FTE employees. RPE is commonly used to measure a company's productivity and to compare it to other companies and the industry as a whole. In contrast, we use the ratio of total CRM spending to RPE to estimate the number of CRM FTEs. Altschul (in Altschul and Patterson Reference Altschul, Patterson, Ashmore, Lippert and Mills2010:300) was among the first to argue that a strong positive linear relationship exists in CRM between the number of FTE positions in a consulting firm and that firm's gross revenue. Based on his experience as a CRM business owner and the experiences of a few of his colleagues, Altschul noted that CRM firms added a new employee with every additional $100,000 in revenue. Admittedly, this figure was more of a hunch than a demonstrated fact. Supporting data, however, emerged from the 2014 ACRA survey, which yielded an RPE estimate for 2012 of about $105,000 (ACRA 2014). Further support has emerged for heritage consulting firms in the United Kingdom, where Aitchison and Rocks-Macqueen (Reference Aitchison and Rocks-Macqueen2020) have shown that the average turnover (in this case, turnover is equivalent to gross revenue) per employee has remained relatively stable for the period from 2014 to 2019, even as the heritage sector has grown.
RPE can be expressed as follows:
 $$\hbox{RPE} = {\box{X} \over \hbox{Y}}$$
Where RPE is revenue per employee, X is the gross revenue of the industry, and Y is the total number of FTEs in the industry. To estimate FTEs, we can rewrite the equation as:
 $${\hbox{X} \over \hbox{RPE}} = \hbox{Y}$$
We use the SRI Foundation's estimate of $1.4 billion as the gross revenues of US CRM in FY Reference Foundation2020. We define RPE as salary plus benefits per employee. The Bureau of Labor Statistics (BLS) reports that the two labor categories composing the bulk of CRM professionals in the United States—anthropologists/archaeologists and historians—had median salaries in 2020 of $66,130 (Bureau of Labor Statistics [BLS] 2021a) and $66,100 (BLS 2021b), respectively. According to the most recent ACRA salary survey, the median benefit rate for CRM firms in the United States (in 2019) is 30% (Vernon Research Group 2019). This accords well with the BLS report that benefit costs in the United States (June 2021) are 31% of total compensation (BLS 2021c). Applying the ACRA benefit rate of 30% to the median salary reported for archaeologists and anthropologists yields an RPE for CRM of $85,969. Although lower than the other estimates presented above, this estimate has the advantage of being easily replicable, allowing future studies to be directly comparable.
The total number of CRM FTEs, then, is
 $${{1, 400, 000, 000\over 85, 969}} = 16, 285\ \hbox{CRM FTEs}$$
Acknowledging the inexact nature of our estimate, we have rounded the total number of CRM FTEs in FY 2020 in the United States to 16,000.
The Composition of CRM Workforce
CRM is a diverse field. Archaeologists make up the bulk of the labor force, but there are significant numbers of specialists, such as architectural historians, historic preservation architects, historians, and other historic preservation professionals, as well as those supporting the business and administrative infrastructure. To provide a better idea of the numbers of positions that may become available in the various sectors of CRM, we examined the responses from the state DOTs along with the ACRA 2019 salary survey (Vernon Research Group 2019). Archaeologists compose 63% of state DOT cultural resource positions. This percentage is typical of government agencies that primarily focus on regulatory oversight and planning. Those agencies that, in addition to regulatory compliance activities, conduct in-house CRM investigations have a very different composition. Heritage Program personnel at the USFS, for example, are dominated by archaeologists (senior Heritage Program management estimates this percentage at greater than 90%). Similarly, CRM consultants are composed primarily of archaeologists, with the typical consulting firm employing about 15 FTEs, of which 85% to 90% are archaeologists (Vernon Research Group 2019:39, 62). Conservatively, we assume that 75% of CRM FTEs are archaeologists. Of the 16,000 CRM FTEs, we estimate that about 12,000 are archaeologists.
Of this number, a significant percentage are field and laboratory technicians. These individuals commonly hold bachelor's degrees in anthropology or a related field, but often they are either students working toward a BA who have attended a field school or individuals without degrees who have sufficient experience. According to the ACRA 2019 salary survey, 70% (58% MA, 12% PhD) of the employees in responding CRM firms hold advanced degrees (Vernon Research Group 2019), a result that is similar to that obtained in the United Kingdom (68%; Aitchison et al. Reference Aitchison, German and Rocks-Macqueen2021). It follows that about 30% of the total number of archaeologists in CRM have a BA degree or less. The composition of the archaeological component of CRM therefore is made up of 8,400 FTEs with advanced degrees (MA or PhD) and 3,600 FTEs with BA degrees or less.
CRM LABOR MARKET FORECAST: FY 2022–2031
The number of positions that will open in CRM in the next decade is a combination of jobs that will need to be replaced and jobs that are a result of economic growth in the industry. To estimate the former, we assume that the working life of a CRM professional is 40 years. This is somewhat less than the average numbers of years worked in the United States (42), but we believe it is more realistic given the number of years of training required to join the CRM labor force and the fact that many archaeological field and laboratory technicians do not spend their entire careers in CRM. Using 40 years as a benchmark means that 2.5% of the labor force will leave the industry every year. To estimate the number leaving the field (Table 2), we multiply number of CRM FTEs by 0.025.
The second component of the labor market estimate is the number of new jobs created. For all years except FY 2021, this is calculated by subtracting the total number of CRM FTEs in that year by the total in the previous year. For FY 2021, we calculated the number of CRM FTEs by dividing the SRI Foundation estimate (rounded to $1.4 billion) by the RPE for CRM ($85,969), which yields 16,285, and then by subtracting this from the FY 2021 estimate of CRM FTEs (17,034).
The total number of replacement jobs (5,511) and the number of new jobs (5,278) are roughly equivalent, yielding a total of 10,789 job openings to fill in CRM in the coming decade. Most of these will need to be filled by the end of FY 2027, with the peak years falling between the ends of FY 2022 and FY 2023 (Figure 3). In Table 2, we assume that the number of jobs required to complete all CRM services in a given year will be filled so that the number of new jobs does not include any unfilled positions from previous years. Given the projected deficit in trained personnel entering the CRM labor market (see below), this assumption is highly tenuous.
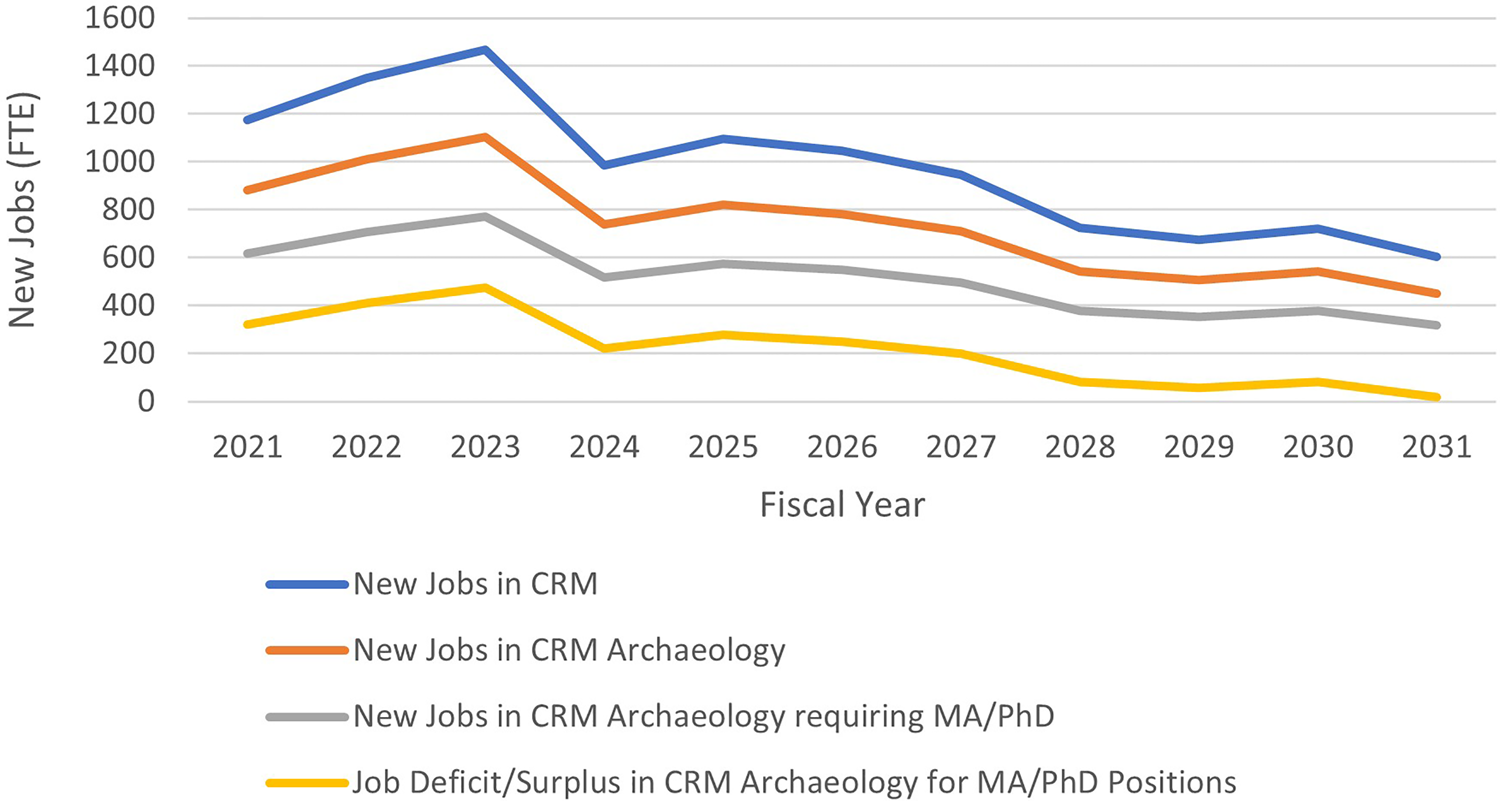
FIGURE 3. New positions in CRM and the expected job deficit in CRM archaeology, FY 2021−2031.
Job Prospects for MAs and PhDs in CRM Archaeology
As stated above, we estimate that about 75% of all CRM jobs are in archaeology and, of these, 70% are positions requiring advanced degrees. Assuming these percentages hold for the coming decade, then the number of new jobs in CRM archaeology can be estimated by multiplying the number of new and replacement CRM FTEs by 0.75. The number of new jobs for CRM archaeologists with advanced degrees can be estimated by multiplying the resulting figure by 0.7. By this method, we estimate that the number of new jobs in CRM archaeology for the period FY 2020–2031 will be around 8,100 (8,091 in Table 2), and of those, about 5,650 (5,664 in Table 2) will require an advanced degree (MA or PhD).
Most, but not all, of these degrees will be in anthropology. To calculate how many advanced degrees we might expect in this time frame, we turned first to the National Science Foundation (NSF), which maintains statistics on the number of PhDs awarded in the United States (National Science Foundation [NSF] 2021a:Table 13). NSF, which compiles this information by discipline (and, in some cases, by subdiscipline), divides anthropology into three categories: cultural, general, and physical and biological. Under “other social science,” NSF lists “archaeology.” Whereas NSF has been compiling information on anthropology for some time, it only started reporting information for archaeology in 2018. In 2018, there were 119 PhDs awarded in archaeology and 424 in anthropology; in 2019, there were 117 and 445 awarded, respectively; and in 2020, there were 116 and 448 awarded, respectively. For these three years, archaeology represents about 21% of all PhDs awarded in anthropology (sum of archaeology and anthropology). Some unknown percentage of anthropologists beyond archaeologists (primarily cultural and biological/physical) would be eligible for the CRM labor market. To account for these possible entrants, we have increased our estimate of anthropologists awarded PhDs in the upcoming decade who could enter the CRM labor market to 25%.
For information on MAs in anthropology, we turned to the National Center for Education Statistics (NCES). Using the NCES dataset from 1987 to 2020, Daniel Ginsberg of the American Anthropological Association (AAA) created the graph of MA and PhDs awarded in anthropology, which is presented in Figure 4. Data presented on PhDs are similar to those reported by NSF. The number of MAs awarded appears to be declining from a peak in 2014 of more than 1,200 degrees to just over 1,000 in 2019. There is no information on how these MAs are distributed among the subfields of anthropology. For purposes of our estimate of the CRM labor market, we will use the same percentage (25%) as used for PhDs.

FIGURE 4. MAs and PhDs awarded in anthropology 1987–2019 (National Center for Education Statistics [NCES], Integrated Postsecondary Education Data System [IPEDS] collection, completion survey component, 1987–2019 [final] and 2020 [provisional]; analysis by the American Anthropological Association AAA). (Figure reproduced with permission from Daniel Ginsberg of the American Anthropological Association.)
We reached out to the presidents of the Society for American Archaeology (SAA) and the Society for Historical Archaeology (SHA), and the executive director and president of the AAA to help interpret the trends in Figure 4. No one expects the closures of departments, such as we witnessed for the Universities of Sheffield and Leicester in the United Kingdom. There was concern, however, that departments might shrink and that retiring faculty might not be replaced. On the whole, the general consensus was that the current pattern of graduating about 550 PhDs and 1,000 MAs would be maintained over the next decade.
Twenty-five percent of the total number of graduates yields 250 MAs and 138 PhDs per year who would be eligible to enter the CRM labor market. According to NSF, 65.7% of PhDs in a social science have a related MA (i.e., same field), whereas 82.9% have an MA or equivalent in any field (NSF 2021b). Individuals with an MA in anthropology would already be counted in the CRM labor market forecast. For purposes of this estimate, we will use the lower percentage of 65.9 to calculate the PhDs already counted in the CRM labor market with the award of their anthropology MA. This process yields 47 (0.341 × 138) new PhDs in anthropology joining the 250 MAs in the CRM labor market each year.
At existing rates of about 300 per year, graduate programs in anthropology will be able to provide about 60% of the CRM archaeology FTEs needed from FY 2020 to FY 2031. Of the estimated 5,664 positions to be filled, 3,267 will be filled by graduates of current programs. The job deficit will be felt most acutely between FY 2022 and FY 2027, but it will at no time in the next 10 years reach zero (see Figure 3). But even our estimate of the job deficit understates the problem. Not every graduate will go into CRM; some will join the academy or pursue other non-CRM careers. If we assume that 85% of those with an advanced degree enter the CRM labor market, then just over 250 MA/PhDs are available each year (297 × 0.85 = 252). In this scenario, less than half (2,777) the needed number of CRM FTEs with advanced degrees will enter the CRM labor market between FY 2021 and FY 2031. Clearly, if the percentage of those entering CRM with advanced degrees is lower (e.g., 75% would yield just over 220 per year), the job deficit will be significantly larger.
Given the projected demand for archaeologists, there may well be a market response of increased enrollment and degree production, particularly if the labor shortage leads to increased wages. Such a response, however, will not be immediate. It will lag by both the time needed for students to recognize the demand and for university programs to take actions to meet that demand. Yet such a response is not guaranteed. The Germany experience may be instructive, as Siegmund (Reference Siegmund2021:1) concludes from a survey and analysis of archaeological programs in that country: “The sharp decline in the number of MA graduates is remarkable in view of a growing labor market, especially in private-sector archaeology, with a clear shortage of skilled workers (Siegmund and Scherzler Reference Siegmund and Scherzler2019, Reference Siegmund and Scherzler2020) and should be taken into account for planned action by graduates, trainers and employers” (translated from German by us).
What applies to archaeology appears to be replicated in other CRM disciplines. For the purpose of this article, the authors sent a survey questionnaire to SHPOs through the National Conference of State Historic Preservation Officers. The purpose of this survey was to obtain the perspectives of SHPOs on what is happening within universities that offer degrees in architectural history, history, historic preservation, and related fields, and how what is happening within these universities might be impacting SHPOs. Eleven SHPOs responded to the survey (Supplemental Text 3). Some of the SHPOs stated that they were observing fewer qualified architectural historians, historians, and individuals in related fields coming out of university programs. One SHPO noted that with respect to historic preservation programs, their state's universities have either lost or experienced significant reductions in scope, staff, and students. Another SHPO has seen a decline in the number of universities offering graduate programs in archaeology in the state and region. It should be noted that most of the responding SHPOs were concerned about having the internal staffing capacity to address increased Section 106 consultations and reviews resulting from the passage of the infrastructure bill.
THE IMPORTANCE OF ADEQUATE TRAINING
Unless the CRM disciplines increase the number of graduates with advanced degrees dramatically, CRM will face a major labor shortage. Our fear is that without adequate foresight, planning, and execution to alleviate the situation, three outcomes are likely. First, without a sufficient labor force, CRM may not be able to complete required projects in a timely manner and will be seen as an impediment to federal infrastructure projects. To address this concern, as discussed earlier, several state DOTs have established a streamlined internal review process for certain classes of infrastructure projects that improves the timeliness of Section 106 compliance and infrastructure project delivery. The junior author understands that some state DOTs that do not have an expedited review process are currently engaged in creating these types of agreements. Expedited reviews, however, must be conducted by qualified and experienced professional staff, and our survey of state DOTs shows that it has been increasingly difficult for the states to hire such staff. Unless this situation can be remedied, the timeliness of these internal reviews will likely decrease over the next several years. As we witnessed with the American Recovery and Reinvestment Act of 2009, the perception of CRM compliance as an impediment to infrastructure project delivery may lead to moves to restrict the reach of environmental and cultural resource compliance or to waive NEPA and NHPA requirements entirely for classes of projects. The effort to limit CRM compliance in 2009 was stymied in part by cooperation between historic preservation advocates and local stakeholders, particularly Native American tribes and communities. Vigilance on the part of professional societies working with historic preservation advocates, Native American and other descendant communities, and—when possible—industry will be required to respond effectively to any threats to lessen CRM compliance requirements.
Second, to speed up project compliance, there will be attempts to lower professional standards. Since 1983, the Secretary of Interior's (SOI) Standards and Guidelines on Historic Preservation (NPS 1983) have served as the baseline qualifications required for most federal CRM projects and contracts. However, as NPS (1983:44716) notes, “These standards and guidelines are not regulatory and do not set or interpret agency policy. They are intended to provide technical advice about archeological and historic preservation activities and methods.” It is possible that federal agencies could be put under pressure to relax SOI standards, particularly if the labor shortage in CRM professionals becomes acute. Even now, some state and federal agencies alleviate CRM staff shortages by using “generalists”—staff trained in other environmental disciplines, such as environmental studies, engineering, biology—to conduct Section 106 compliance reviews. Some states may take this one step farther. In 2018, the Arizona legislature considered House Bill 2498, which would have allowed archaeological surveys to be conducted by nonprofessionals who had passed a minimal training course (mostly designed for ranchers conducting rangeland improvement projects). The move was defeated, but there will certainly be renewed interest in this and similar bills if ranchers and landowners cannot find individuals to conduct surveys in a timely fashion or if the labor shortage leads to large increases in archaeological survey costs.
Third, in an effort to increase the number of qualified professionals, MA programs will become less rigorous and accelerated. The growing appeal of online MA degrees in all fields will certainly find traction in CRM. For those already working in CRM, the ability to maintain their job while obtaining an advanced degree is appealing. As long as the online or hybrid programs are equivalent to in-class ones, they should be encouraged. However, programs—whether online or in class—that are stripped down and fast tracked should be discouraged.
The best means of maintaining standards is through some form of certification, registration, or licensing. The only CRM professionals requiring a license to practice are historic preservation architects. Archaeologists can voluntarily register with the Register of Professional Archaeologists either at the BA level (“Registered Archaeologist,” or RA) or at the MA/PhD level (“Registered Professional Archaeologist,” or RPA) if they meet specific experience and proficiency criteria. RAs and RPAs agree to abide by a set of discipline-wide research standards and codes of conduct that are enforced through a grievance process by which anyone—peers, government agencies, clients, Native American tribes, descendant and local communities, and the general public—can hold them accountable for their actions. As of September 2021, there were 3,916 RPAs, of whom 3,809 worked in CRM (Deb Rotman, former executive director of the Register of Professional Archaeologists, personal communication 2021). Above, we estimated that there are about 8,400 CRM FTE archaeologists with advanced degrees currently working in CRM. It follows that about 45% of CRM MA/PhD archaeologists are RPAs. The best way of ensuring that RPAs oversee CRM archaeology projects is to make registration a requirement of federal and state-funded projects, or a condition of obtaining a federal or state permit to conduct a project.
Although it is important that training be rigorous, it is equally important that it prepare graduates for the types of jobs they will fill. As McManamon (Reference McManamon and McManamon2018:1) notes, “CRM activities have become important parts of the disciplines of archaeology, architecture, architectural history, cultural anthropology, curation, history, historical architecture, and museum management.” It is not possible to be an expert in all these fields, but students need to be exposed to portions of all of them. Additionally, it is important to remember that CRM is embedded in a legal framework and that knowledge of the laws and regulations surrounding CRM is essential. Beyond laws and regulations, students need to be exposed to the ethical dilemmas posed by CRM as a market-based enterprise in which they must balance historic and cultural preservation with the rights of property owners and economic development. Understanding the rights of other parties, particularly Native American and other descendant communities, is vital. As one SHPO noted, the ability to work with tribal and other descendant communities has become more and more critical to CRM compliance, and these activities require the skills of relationship building and conflict resolution.
But this is not the training that most students receive. Traditional anthropology graduate programs, for example, focus on providing students with a strong base in method and theory. There may be an appreciation of the difference between archaeology as a science and heritage as a means of contextualizing and using the past in the present, but most anthropology programs do not see it as their role to bridge this divide or to provide their students with vocational tools specific to CRM. The forecasted labor shortage in CRM presents two challenges to university programs. As Barbara Heath, president of SHA at the passage of the infrastructure bill, aptly put it, “Part of the challenge is to convince university administrators that archaeology is a focus worth investing resources in, but part of the challenge is also convincing anthropology faculty that we should reform our curricula to better prepare students for these opportunities” (personal communication 2021).
Integrating CRM into graduate training has been a subject of long-standing debate among the CRM disciplines (e.g., Schuldenrein and Altschul Reference Schuldenrein, Altschul, Bender and Smith2000). Although some programs have developed a specific focus on CRM, many give the industry short shrift, assuming that if their students enter CRM they will be trained by their employer. This attitude is not lost on students. A key point about MA training stressed in a survey of practicing anthropologists (some, but not all, working in CRM) was that programs should “tailor the program to what students want to do when they leave academia” and to “emphasize the practical applications of an anthropological education over theory and academia” (Hawvermale et al. Reference Hawvermale, Cronin, Davis, Byth, Torres, Giamarqo, Stutts, Koyuncuoglu and Burke2021:23).
Not all students enter anthropology with a clear notion of their ultimate career path. For those who have worked in CRM and are returning to graduate school to obtain an MA to advance their career, there are some CRM-oriented programs that work well. Other individuals, particularly those pursuing doctorates, often enter graduate school set on becoming an academic. Upon obtaining their degree, however, they may find that the only positions open to them are in CRM and that, although a grounding in anthropological method and theory is useful, they lack other skills needed for a career in CRM.
In responding to our survey, SHPOs had many comments on the lack of training, skills, and experience of applicants for positions within their agencies (Supplemental Text 3). One SHPO stated that their most recent hires had less work experience than previous hires, so their agency had to provide more training, which was an added burden to their existing experienced staff and managers. Another SHPO noted that because of the decline in the number of universities offering graduate programs in archaeology in the state and region, there is a deficit in the number of graduates with essential training and experience available for employment. And a third stated that their biggest worry about their plan to increase hiring was not having the selection of candidates that they need: individuals with a combination of education and work experience. Their office's work relies on competent staff to guide the historic preservation compliance review process efficiently.
A few of the state DOTs responding to our survey also had comments on the lack of experience of new hires and applicants to open positions within their agencies and among their contractors (Supplemental Text 2). One DOT noted that recent graduates applying for positions within its agency had little understanding of how to evaluate the significance of cultural resources and justify resource management decisions in the context of CRM's legal framework. Another DOT noted that the coming increased workload will pose a challenge to CRM practitioners, because the workload will increase more rapidly than the pool of available staff, especially in terms of individuals with the necessary training and experience.
Finally, to increase the number of people entering graduate training for CRM, we need to address the issue of cost. According to a recent SAA survey on student debt, of 458 respondents, nearly half (46.5%) carry some debt. Of those taking out loans, 59% carry debt of more than $25,000, 37% maintain debt in excess of $50,000, and nearly 15% (mostly PhD students) hold debt of more than $100,000 (Society for American Archaeology 2022). Most debt-laden respondees expect to take more than a decade to pay off their loans. Given the relatively low entry-level salaries in CRM, student debt is a serious obstacle to attracting people to the field, particularly those from historically disadvantaged communities. Lowering the cost of graduate education is a national issue involving all areas of employment that require advanced degrees. Despite the scale and complexities of the issue, universities, government agencies, and private-sector consulting firms can take action to address the cost of graduate training for CRM. A number of CRM MA programs exist that allow—and even encourage—students to maintain their jobs while obtaining their degrees. Some private firms have internal programs that pay for some or all of the costs of an advanced degree (most often an MA) on the condition that the employee commit to remaining at the company for a specified period of time. Extending these programs and encouraging others is critical if CRM is to meet the demand for well-trained practitioners.
Avoiding the potential negative outcomes discussed above and addressing the workforce challenges facing CRM is one of the major challenges of our times. As a starting point to discussions vital to the future of CRM and its related disciplines, we offer a series of recommendations based on our experiences in training and working with CRM students and young professionals, and the results of our survey of state DOT CRM managers and SHPOs (Supplemental Texts 2 and 3):
• Students, both undergraduate and graduate, need to be exposed to careers in CRM. One effective method of exposing students to CRM is by partnering with CRM firms, government agencies, museums and curatorial facilities, SHPOs and THPOs, and other CRM practitioners to provide internships. Students gain not only exposure but also networks that can help them gain entry to the field. In addition to internships, establishing structured mentoring programs is another tool for preparing young professionals for careers in CRM.
• Academic institutions need to change their curricula to provide students with an understanding of the full spectrum of CRM and to offer some initial training on the skills needed in CRM careers. Coursework should cover laws, regulations, and preservation mandates, and it should incorporate heritage management and CRM practices, particularly as those relate to breadth of CRM services, stakeholder engagement, collaboration with descendant communities, and the relationship between tangible and intangible cultural heritage. Discussions of ethics and laws should be expanded to include CRM. Curricula that incorporate training and internships are best created and implemented in partnership with CRM firms, agencies, historic preservation offices, and professional societies and organizations (such as the anthropology-focused Career Readiness Commission). We encourage the use of professors of practice to ensure that students gain firsthand exposure and understanding of the realities of CRM.
• CRM as an overall discipline needs to engage underrepresented communities in order to promote the value of CRM careers to students and young professionals in these communities. Engagement would include, for example, outreach and support (including paid internships) to Historically Black Colleges and Universities (HBCUs), Hispanic Serving Institutions (HSIs), and accredited Tribal Colleges and Universities (TCUs), in partnership with archaeological organizations linked to these communities, such as the Society of Black Archaeologists. The public benefit of CRM's engagement with disadvantaged communities on issues of social and environmental justice as well as contemporary issues, such as climate change and social inequality, needs to be emphasized. Additionally, the cost of training for members of disadvantaged communities and for students in general needs to be brought in line with the debt that can be carried by entry-level CRM employees.
THE ROAD AHEAD
The next decade promises to be filled with tremendous archaeological discoveries, repurposed historic buildings, and enhanced cultural landscapes. These will excite the public imagination and add to the discourse of how we became who we are. Although each CRM subdiscipline faces challenges in the next decade, archaeology in particular seems to be at a crossroads. The project-based nature of CRM has created a situation in which archaeological data from CRM fill holes in regional culture histories but rarely provide a more impactful understanding of how past human behavior has shaped and continues to shape us as a community and as a nation. One way of promoting the value of CRM archaeology is to demonstrate the value of archaeology as a tool for addressing the challenges of modern society and culture. To do so, we need to recognize the structural impediments that currently restrict the use of CRM data in synthetic studies not only of the past but of contemporary issues facing society.
Data Standards and Analytic Tools
Establishing data standards has been difficult in CRM. In part, this result stems from the multitude of disciplines and practices ranging from archaeology to historic architecture that were combined to create the field. Even within a single discipline, such as archaeology, the academic underpinnings of the field led to strong independent attitudes toward what data to record, how to record and analyze data, and how data should be archived and curated. Added to the individualistic nature of archaeological field and analytical practices is the decentralized nature of the discipline. Each federal and state agency has its own requirements, each employs a distinct information framework, and each CRM contractor hired by these agencies has their own method of recording and managing data. The lack of data systematization has hurt, but not crippled, the management of archaeological resources. It has, however, been a barrier to almost any type of comparative research.
Archaeology is not alone in facing these problems. In response to the growing problems of managing and using scholarly data, Wilkinson and colleagues (Reference Wilkinson, Dumontier, Aalbersberg, Appleton, Axton, Baak and Blomberg2016) introduced the FAIR principles. Now a standard in scholarly research, data should be Findable, Accessible, Interoperable, and Reusable. At present, CRM fails on all four categories. Long known as gray literature, CRM reports generally are not published. Instead, they are deposited in mandated state repositories. The data associated with these reports may or may not be archived, and the work products underpinning the analyses are generally not curated with the collections. Even if reports and associated data are archived, they are not necessarily accessible. Access to data may require permission of the landowner, the responsible federal agency, or descendant communities or affiliated Native American tribes. In many jurisdictions, locational site data are so restricted that our ability to address spatial aspects of such issues as climate change, migration, and demography is severely limited. Questions of interoperability abound in archaeology, making reuse of project data difficult, if not impossible.
Although the preceding paragraph focused on CRM, many of the same criticisms apply to academic archaeology. Getting to FAIR in archaeology will require a discipline-wide effort. It will necessitate confronting long-standing disciplinary traditions that cede complete control over decisions on how and what to record to individual researchers. It will require cooperation across agencies, repositories, archaeologists, and descendant communities in developing processes that make data available in ways that protect the rights of landowners and descendant communities without unduly restricting scientific inquiry. Transforming data so that their potential to enrich the lives of the public through comparative and landscape-scale research will necessitate the development of cyber data integrative tools.
Collaborative Research
The purpose of CRM is best expressed in Section 1(b)4 of the NHPA: “The preservation of this irreplaceable heritage is in the public interest so that its vital legacy of cultural, educational, aesthetic, inspirational, economic, and energy benefits will be maintained and enriched for future generations of Americans.”
Over time, we believe that American archaeology has strayed from this charge. CRM has become a process by which the past is documented but left largely uninterpreted. Academic archaeology, although not opposed to CRM, has never embraced it as a repository of data with tremendous potential or seen it as a central part of its purview to use CRM data to benefit the public.
The two communities—CRM and academia—need each other to move beyond project-based studies to large-scale comparative research. We can analyze long-term socioenvironmental processes posed by such issues as warfare, disease, famine, biodiversity, sustainability, wealth inequality, climate variability, and natural disasters only if we collaborate with each other and with other stakeholders, including scientists in allied fields and members of local and descendant communities. Synthetic research in which we use datasets obtained at the behest of the public to address issues of interest to the public in ways that such results can be impactful (see Kohler and Rockman Reference Kohler and Rockman2020) is not only in archaeology's best interest but also a moral imperative.
Project-Based to Landscape-Scale Management
CRM in the United States is a project-based enterprise. Project proponents are responsible for complying with regulations and mandates for their proposed undertaking. Fieldwork is limited to particular project areas, and analysis focuses on the resources being evaluated or documented in these areas. The need to look outside the confines of the project area is largely reduced to placing these resources in their proper historic context. However, as CRM has matured and more projects have taken place, the areas needed to provide context have shrunk in size. As Altschul (Reference Altschul2016a:78) has noted, there is a perverse tendency in CRM to “think small” just when the data are available to “think big.”
Some federal agencies have initiated steps to move away from project-based decisions toward regional or landscape-scale management of cultural resources. In 2013, Secretary of the Interior Sally Jewell issued Secretarial Order 3330, which established a department-wide strategy to use a landscape-scale approach to the management of natural and cultural resources. The order was followed by a report by the Energy and Climate Change Task Force (Clement et al. Reference Clement, Belin, Bean, Boling and Lyons2014) that recommended 15 steps to operationalize the order, one of which was the development of “guidance for landscape-scale mitigation under Section 106 of NHPA” (Clement et al. Reference Clement, Belin, Bean, Boling and Lyons2014:15). Guidance was drafted (Odess Reference Odess2016) but never formally adopted in the transfer from the Obama to the Trump administration. Nevertheless, the need for landscape-scale management of cultural resources has only increased as undertakings have become regional in scope. Sea-level rise will affect not just one community but all communities in coastal and low-lying areas (Anderson et al. Reference David G., Bissett, Yerka, Wells, Kansa, Kansa, Myers, Carl DeMuth and White2017). Hurricanes and forest fires are stronger and larger, affecting hundreds and sometimes thousands of historic properties in a single event. The move from fossil to green energy requires large-scale land disturbance for solar and wind farms as well as the electric grid infrastructure. Adding billions of dollars of infrastructure projects in the next decade will only exacerbate this situation.
Section 106 compliance, built for project-based undertakings, is not equipped to handle the management of cultural resources effectively in the future. Attempts, such as the SAA task forces on landscape management (Altschul Reference Altschul2016b; Doelle et al. Reference Doelle, Barker, Cushman, Heilen, Herhahn and Rieth2016; McManamon et al. Reference McManamon, Doershuk, Lipe, McCulloch, Polglase, Schlanger, Sebastian and Sullivan2016; Wilshusen et al. Reference Wilshusen, Heilen, Catts, De Dufour and Jones2016), have been made to get in front of this problem, but much more needs to bedone. A national strategy is needed. Following the models of the Airlie House seminars (McGimsey and Davis Reference McGimsey and Davis1977) and the 1974 Denver Cultural Resource Management Conference (Lipe and Lindsay Reference Lipe and Lindsay1974), it is time for a new round of focused meetings that can transform CRM to meet the challenges of today and beyond.
SUMMARY AND CONCLUSION
At first glance, US CRM has never been in better shape. The infrastructure bill will add more than $1 billion in CRM spending over the next 10 years to an industry that is already on the rebound from the Great Recession and the economic effects of the COVID-19 pandemic. About 11,000 CRM jobs will be added in all CRM fields, with more than 8,000 of those going to archaeology. Graduates with advanced degrees will be in high demand because current academic programs will produce about half the needed number of CRM positions. Given the structure and orientation of current academic programs, however, graduates entering the labor market will be deficient in many of the skills required to perform CRM services, leading to inefficiencies and possible bottlenecks in meeting CRM regulatory requirements. In many respects, this article is a call to action to (a) stop the trend to close or decrease the size of current graduate programs and (b) reorient those programs to give a greater emphasis to the skills needed to be successful in CRM and to understand the ethical challenges posed by working in an applied setting.
American archaeology, in particular, has a lot a stake in the next decade. The vast amount of money ensures that a large number of projects—some sizable and complex—will provide glimpses into the past heretofore unavailable. But to move beyond the what, where, and when of the past to address fundamental questions of how and why we became who we are—and how best to use that knowledge to chart the future of our community, country, and planet—we must beat down structural barriers that keep academic and applied archaeologists from fully embracing that challenge. The next decade is full of promise. Fulfilling that promise is a challenge we must all face together.
Acknowledgments
The authors would like to acknowledge the 20 state Departments of Transportation and 11 State Historic Preservation Offices that responded to our survey. Additionally, individuals from these offices who provided specific comments on the article included State Historic Preservation Office representatives Katherine Marcopul, Elizabeth Moore, Lynda Ozan, Elizabeth Johnson, Romana Bartos, and Cathy Labadia; and state Department of Transportation representatives Erica Schneider, Jody Brown, James Robertson, Brennan Dolan, Kara Russell, Julie Schablitsky, Steve Archer, Michael Meinkoth, and Sigrid Bergland. Representatives from federal agencies commenting on the article or providing information included Joshua Torres, Matthew Forcier, Douglas Stephens, Dierdre Remley, and David Clarke. Comments were also received from representatives of professional organizations, including Deborah Nichols, Oona Schmid, Kimball Banks, Daniel Ginsberg, Edward Liebow, Barbara Heath, Deborah Rotman, Erik Hein, and Peter Hinton. Individuals commenting on the article were Michael Heilen, Keith Kintigh, Timothy Kohler, Christopher Dore, Charles Niquette, Gerald Wait, and Ran Boytner. Sarah Herr kindly provided posters regarding employment in CRM, Daniel Ginsberg provided Figure 4 (numbers of MA and PhDs awarded in anthropology), Oona Schmid and the Society for American Archaeology's Government Affairs Committee made their student loan survey available, Amanda Stratton provided the 2019 ACRA salary survey, and Sandra L. Lopez Varela graciously translated the abstract into Spanish. We would also like to thank the four anonymous reviewers. All comments helped sharpen our arguments. We alone are responsible for any errors or misrepresentations. Finally, the senior author would like to thank the German Archaeological Institute and, in particular, Friedrich Lüth for hosting him in Berlin as a resident scholar during the fall of 2021, which is where most of the article was conceived and written.
Data Availability Statement
Survey data summarized in Supplemental Texts 1–3 have been placed in tDAR and made publicly available in the following two files: State Department of Transportation Survey (DOI:10.48512/XCV8468908) and State Historic Preservation Office Survey (DOI:10.48512/XCV8468906).
Supplemental Material
For supplemental material accompanying this article, visit https://doi.org/10.1017/aap.2022.18.
Supplemental Text 1. State Departments of Transportation Survey: CRM Budgets and Full-Time Staffing.
Supplemental Text 2. State Departments of Transportation Survey: State DOT Staffing and CRM Contractor Capacity and General Comments.
Supplemental Text 3. State Historic Preservation Officers Survey.
Competing Interests
The authors declare none.


 Open access