


1 Introduction
This paper aims to present a study on the spectral and temporal properties of palatalization in Estonian consonants and in the vowels that precede them. Palatalization is a complex phonological process common in world languages. It can be found in a variety of languages such as English, Russian, Japanese, French, Mandarin Chinese, Greek, and elsewhere, including Estonian (Bateman Reference Bateman2011). The term palatalization can cover various underlying phonological processes like coronalization or fronting (Hume Reference Hume1994), velar softening (Chomsky & Halle Reference Chomsky and Halle1968), or spirantization (Bhat Reference Bhat, Greenberg, Fergusion and Moravcsik1978), where a coarticulatory assimilation of a consonant and a neighboring high front vowel or a glide /j/ occurs (Kochetov Reference Kochetov2011). The trigger, the target, and the outcome of palatalization can vary cross-linguistically. For example, it is common for high and front vowels or glide /j/ to trigger palatalization, but it has been shown that, for example, in Tohono O’Odham, Coatzospan Mixtec, Maori, and Sentani languages that high back and central vowels can trigger palatalization as well (Bateman Reference Bateman2007).
Palatalization can be divided into full and secondary types by looking at the change in the target consonant since the trigger generally does not determine the type of palatalization. With full palatalization, the consonant changes its place and manner of articulation while moving to the palatal region of the mouth. With secondary palatalization, the consonant’s main place of articulation remains the same, but the tongue raising during the articulation of the following segment gives the consonant a secondary place of articulation on the hard palate. Secondary articulations are common, and the secondary raising of the tongue or retracting the tongue root can make the consonant palatalized, velarized, uvularized, pharyngalized, or laryngalized (for an overview, see Catford 1977: 188–196). This article will focus on the secondary palatalization of four Estonian coronal consonants. Labial and dorsal consonants do not palatalize in Estonian. It is not uncommon that only coronal consonants palatalize in a language (Bateman Reference Bateman2007).
The typological distribution of the palatalization targets varies. They can involve coronal and dorsal consonants independently or together, and labial consonants can be targeted only when coronals and dorsals are targeted in a language (Kochetov Reference Kochetov2011). The position of the trigger can precede or follow the target consonant, but it has been found that prepalatalization, which also exists in Estonian, is more common (Bhat Reference Bhat, Greenberg, Fergusion and Moravcsik1978, Bateman Reference Bateman2007, Kochetov Reference Kochetov2011). Regardless of the process described, the result is that the consonant’s place of articulation is changed or the consonant becomes palatalized because of the nearby vowel or glide; this results in the consonant becoming more similar to the palatalization trigger. In a more recent study of Brazilian Portuguese, Battisti & Hermans (Reference Battisti and Hermans2020) argue that palatalization is structurally motivated, and the process affects consonants that are similar to the trigger vocoids because high vocoids have a high degree of consonantality.
We chose Estonian, a Balto-Finnic language of the Uralic language branch, for our study because Estonian has contrastive secondary palatalization in only four coronal consonants /l n s t/ and it presents a comparable binary dataset of minimal pairs in which palatalization differentiates meaning. The high variability of the possible targets and triggers and their outcomes motivated us to pursue the topic and to assess whether palatalization in Estonian follows the same patterns as it does in other languages. This article builds upon the knowledge and uses data from the same test subjects and recordings used in previous articles, namely a preliminary study preceding this paper by Malmi (Reference Malmi, Sascha Calhoun, Tabain and Warren2019) and an articulatory study by Malmi & Lippus (Reference Malmi, Sascha Calhoun, Tabain and Warren2019).
On the basis of palatalization, two series of alveolar phonemes can be defined in Estonian: non-palatalized /l n s t/ and palatalized /lj nj sj tj/ (Asu & Teras Reference Asu and Teras2009). Estonian contrastive palatalization is realized in monosyllabic words after the first vowel and in disyllabic words on the boundary of the first stressed and following unstressed syllable (Kask Reference Kask1972: 118; Teras & Pajusalu Reference Teras and Pajusalu2014). This results in an inventory of word pairs like tulp ‘column’ [tulpː] ∼ tulp ‘tulip’ [tuljpː] or kott ‘worn out shoe’ [kotː] ∼ kott ‘bag’ [kotjː]. These kinds of phonologically contrastive pairs were historically introduced into Estonian through the apocope of word final /i/ (Kask Reference Kask1972: 118). Palatalization in Estonian is regressive, which means that the word final /i/ affected the place of articulation of previous alveolar consonant or all alveolar consonants in a cluster. Palatalization of a consonant was marked in orthography up until the beginning of the 20th century but got lost after the written language standard changed. This resulted in words with identical orthographic forms but different pronunciations. Some other pairs might not have a counterpart in the same grammatical case or the same quantity degree, but the contrast between the segmental sequences still remains, for example, laste ‘child, pl.gen’ [lɑste] ∼ laste ‘cargo, pl.part’ [lɑsjːte]. The existence of such pairs allows us to compare and study the spectral and temporal properties of palatalization.
Phonetically, palatalization in Estonian is a result of regressive assimilation of neighboring segments in which the trigger for palatalization immediately follows the consonant target. However, in spontaneous speech, examples of progressive palatalization can be found as well, e.g. when an /i/ in the second part of a diphthong (e.g. kuidas ‘how’ [kutjɑs]) gets reduced or assimilated, the consonant is still articulated with palatalization (Teras & Pajusalu Reference Teras and Pajusalu2014). Non-contrastive palatalization in Estonian is, in many cases, optional and gradually variable, as the degree of palatalization can vary regionally or idiomatically (Teras & Pajusalu Reference Teras and Pajusalu2014, Põld Reference Põld2016, Piits & Kalvik Reference Piits and Mari-Liis2019). For this reason, in this study, only phonologically contrastive palatalization will be analyzed.
Acoustically, palatalization can be defined by the change in the quality of the vowel which precedes the palatalized consonant. A number of studies of different languages have found that the increase of the F2 value in the vowel preceding the palatalized consonant is the most persistent correlate of palatalization, but researchers have also observed that there is a decrease in F1 and an increase in F3 as well (Ní Chiosáin & Padgett Reference Chiosáin2012 for Connemara Irish; Lehiste Reference Lehiste1965, Liiv Reference Liiv1965a, b, Vihman Reference Vihman1967, Teras & Pajusalu Reference Teras and Pajusalu2014 for Estonian; Derkach, Fant & De Serpa-Leitao 1970, Purcell Reference Purcell1979, Howie Reference Howie2001, Kochetov Reference Kochetov2011 for Russian; Kim Reference Kim2012 for Korean; Ćavar Reference Ćavar2004 for Polish). Vowels that have a higher F2 go through a smaller change in F2 than vowels with a lower F2 (Lehiste Reference Lehiste1965). Similar patterns can be expected to occur in other languages that exhibit secondary palatalization because articulatorily, the process involves raising the body of the tongue to the hard palate. The transition from the vowel to the consonant is said to have an [i]-like quality compared to the non-palatalized context. The majority of those previous studies of palatalization have focused on describing the transition from the vowel to the consonant, or they have described the quality of the vowel and the consonant from a single or few time points.
Along with the changes in the formants of the preceding vowel, the effect of palatalization can be seen in the quality of the consonant itself as well. The center of gravity (COG; the average of the frequencies in a selected time window of the spectrum) of palatalized fricative consonants is lower for /s/ (Padgett & Żygis 2003, Hamann & Heriberto Reference Hamann and Heriberto2007, Kochetov & Radisic Reference Kochetov, Radisic, Babyonyshev, Kavitskaya and Reich2009, Malmi Reference Malmi, Sascha Calhoun, Tabain and Warren2019). Labial and alveolar palatalized stops have higher frequencies in the spectrum of the burst (Shupljakov, Fant & De Serpa-Leitao Reference Shupljakov, Fant and De Serpa-Leitao1968, Kochetov Reference Kochetov2011, Kavitskaya Reference Kavitskaya, Whalen and Best2006, Botinis, Chaida & Magoula Reference Botinis, Chaida and Magoula2011, Ní Chiosáin & Padgett Reference Chiosáin2012). /lj/ is described as having a higher F2 and F3 and lower F1 values compared to non-palatalized /l/ (Lehiste Reference Lehiste1965, Vihman Reference Vihman1967, Remmel & Eek Reference Remmel and Eek1971, Eek Reference Eek1972) and a higher COG (Malmi Reference Malmi, Sascha Calhoun, Tabain and Warren2019). Researchers have had difficulties findings differences in F1 and F2 of non-palatalized and palatalized /n/ (Lehiste Reference Lehiste1965, Iskarous & Kavitskaya Reference Iskarous and Kavitskaya2018, Nance & Kirkham Reference Nance and Kirkham2020). Because of the high dampening effects of the soft nasal cavity and the anti-formant that forms in the oral cavity, which overlaps with F2, nasal consonants are characterized by low intensity and wide bandwidths (Fant Reference Fant1960, Derkach et al. Reference Derkach, Fant and de Serpa-Leitao1970, Eek Reference Eek1972, Tabain et al. Reference Tabain, Butcher, Breen and Beare2016). Lehiste (Reference Lehiste1965) found that the F3 values of /n/ showed a tendency to be lower with palatalization, and Malmi (Reference Malmi, Sascha Calhoun, Tabain and Warren2019) found that the COG of /n/ was lower with palatalization. Researchers have stated that palatalization tends to only affect the beginning of Estonian consonants (Lehiste Reference Lehiste1965; Liiv Reference Liiv1965a, b; Eek Reference Eek1972, Reference Eek1973). It is not known whether palatalization also affects the spectral properties of Estonian consonants in the midpoint. In addition to spectral properties, palatalization affects the temporal structure of the phonemes.
Research has shown that the duration of the vowels preceding palatalized consonants and the duration of /s/ and the burst of /t/ show a tendency to be lengthened (Liiv Reference Liiv1965a, Bolla Reference Bolla1981, Zsiga Reference Zsiga2000, Ćavar Reference Ćavar2004, Kavitskaya Reference Kavitskaya, Whalen and Best2006, Kochetov Reference Kochetov2006, Ordin 2010, Stoll, Teras & Pajusalu Reference Teras and Pajusalu2014, Harrington & Hoole 2015). This lengthening presumably comes from tongue raising and is also used to enhance the perception of palatalization (Ordin 2010). We had trouble with reproducing these findings in our articulatory study (Malmi & Lippus Reference Malmi, Sascha Calhoun, Tabain and Warren2019), as the effect of vowel lengthening did not show a clear pattern. This topic will be revisited in the current study.
Speech is a dynamic process in which phonemes do not occur in isolation; they are coarticulated with nearby segments, and to some extent, they become similar. The term coarticulation describes an unconscious process where the movements of different articulators and targets overlap and interact with one another. Palatalization arises from coarticulation of adjacent or nearby segments. Coarticulation can affect the quality of individual segments (Lindblom Reference Lindblom1963a, b; Öhman Reference Öhman1966; Amerman, Daniloff & Moll Reference Amerman, Raymond and Kenneth1970; Hammarberg Reference Hammarberg1976; Lisker Reference Lisker, Bell and Hopper1978; Farnetani & Recasens Reference Farnetani, Recasens, Hardcastle, Laver and Gibbon2013; Malmi Reference Malmi2014, Reference Malmi2016) but also the whole syllable (Xu Reference Xu2020) or even extend beyond a syllable boundary (Öhman Reference Öhman1966). Coarticulation arises from the need for minimal articulatory effort in conveying information. While palatalizing consonants, the raising of the anteo-dorsum towards the hard palate already begins in the first part of the vowel and continues until the end of a palatalized consonant (Malmi & Lippus Reference Malmi, Sascha Calhoun, Tabain and Warren2019).
We offer a new perspective into the realization of palatalization and suggest that the transition takes place throughout the whole vocalic segment rather than having a stable vowel target section followed by a transition as previously described. The current paper supplements the results from our articulatory study and provides a wider view on the realization of palatalization in Estonian and in other languages with secondary palatalization. Based on previous findings, the research questions and hypotheses of this study are as follows:
-
(i) Firstly, we want to observe possible acoustic cues that describe palatalization in Estonian vowels. We hypothesize that the vowels preceding palatalized consonants will have lower F1, higher F2, and F3 values. We also want to specify the properties of the so-called [i]-like the transition from the vowel to the palatalized consonant and to find a way to formally determine the beginning of the transition in order to compare it in palatalized and non-palatalized contexts. We hypothesize that, because of coarticulation, it might be difficult to find a clear transition following a stable ‘target’ segment, and we expect that the formants are continuously moving throughout the whole vowel.
-
(ii) Secondly, we want to observe the possible acoustic cues that describe palatalization in Estonian consonants. We hypothesize that with /l/, the F2 and F3 values will be higher, and F1 will be lower with palatalization. F2 and F3 values of /n/ will be lower with palatalization. The COG of /s/ will be lower, and the burst of /t/ will be higher with palatalization. We also want to quantify the scope of palatalization. We hypothesize that the effect of palatalization reaches further than just the beginning of the consonant, as has been previously stated. This hypothesis is also based on our previous articulatory study (Malmi & Lippus Reference Malmi, Sascha Calhoun, Tabain and Warren2019), in which the tongue was higher with palatalization and which stayed higher throughout the consonant.
-
(iii) Thirdly, we want to know whether the vowel is lengthened by the palatalization of the consonant and whether the consonant is lengthened as well. In alignment with what previous research has shown, we hypothesize that the duration of the vowel, the duration of /s/, and the burst of /t/ are longer for palatalized than for non-palatalized consonants. We expect then that the durations of /l/ and /n/ will be longer too.
2 Materials and method
2.1 Materials used in the study
To study the spectral and temporal properties of palatalization, an acoustic experiment was conducted at the University of Tartu and Tallinn University of Technology with 43 native Standard Estonian speaking participants (20 male, 23 female), aged 20–78 years (median 29 years).
In this study, 18 monosyllabic word pairs with phonemic contrast in palatalization (i.e. a total of 36 words) were analyzed (Table 1). The test words were embedded in written carrier sentences and presented to the participants in a randomized order using the software SpeechRecorder (Draxler & Jänsch Reference Draxler and Jänsch2004). The dataset also included 55 sentences that were not analyzed in this study.
Table 1 Test word pairs from the experiment; for these, palatalization differentiates meaning. All nouns in the table are sg.nom if not listed otherwise.

The test words were embedded in the middle of the carrier sentence followed by a comma and a word starting with mi-, e.g. Kevadel sündis väike tall [tɑlː], mitte vasikas ‘In the spring a small lamb was born, not a calf’, Hobustele ehitati uus tall [tɑljː], mis pakub neile peavarju kogu aasta ‘A stable was built for the horses, which provides shelter for them throughout the year’.
Twenty-eight participants were recorded in Tartu using an AKG 414 microphone and Focusrite Scarlett 18i20 sound card, and 15 participants were recorded in Tallinn using an Audiotechnica ATM33a microphone and Sound Devices Mixpre 6 or M-Audio Fast Track Pro USB sound card. The recordings were saved as 44.1 kHz/16-bit wave files. In both locations, the recordings were carried out in a soundproof room. All of the speakers spoke wide-spread Standard Estonian. The recording sessions consisted of two trials. In the first trial, the recording was made using an electromagnetic articulograph (EMA; the results were reported in Malmi & Lippus, Reference Malmi, Sascha Calhoun, Tabain and Warren2019); in the second trial, in order to get more natural speech, the same sentences were read without the five EMA sensors glued on the tongue, and only the acoustic signal was recorded. In this paper, the data from the second trial are analyzed.
2.2 Segmentation of test words
The test words were first automatically segmented using Automatic Speech Recognition-based force alignment software developed at the Tallinn University of Technology (Alumäe, Tilk & Asadullah Reference Alumäe and Tilk2018) and then manually corrected by visually analyzing the corresponding spectrograms. The boundary between the vowel and the following /s/ was set where the periodic oscillation of the vowel became aperiodic. The beginning of the closure phase of /t/ was set where the F2 of the preceding vowel did not show any periodic oscillations anymore. The boundary between a vowel and a following /l/ or /n/ was set by looking at the F2 movement and concentration of energy. For /n/, we drew a boundary where there is a drop in F2 because of the anti-formant that forms in the nasal cavity, which dampens the values in the F2 region. For /l/, the movement of F2 and the relative intensity of the vowel and the lateral were compared, and the boundary was set where the intensity was lower after the vowel. The boundary for the beginning of the vowel was also set by keeping these parameters in mind: periodicity, the movement of F2, and by looking at the intensity of the spectrogram. The final boundary of /l/ and /n/ was set where the periodic oscillations of F2 ended or became aperiodic. For /s/ and /t/, the boundary was set where the aperiodic oscillations faded out or where the presumable aspiration started.
2.3 Analysis of vowels that precede consonants
The acoustic analysis was carried out using the software Praat (Boersma & Weenink, Reference Boersma and Weenink2021). For the analysis of vowels /ɑ o u/ preceding consonants, an Optimized Formant Ceiling method (Escudero et al. Reference Escudero, Boersma, Schurt Rauber and Bion2009) implemented as a Praat script was used to extract F1, F2, and F3 values from 30 equidistant time points spanning the duration of each vowel. A unique formant ceiling was searched for each vowel between 4000 Hz and 8000 Hz at 10 Hz intervals. The ceiling with the smallest variance within each vowel was chosen for the analysis. After the ceiling was chosen, a new analysis with the selected ceiling was carried out. This allowed us to dynamically analyze the movements of formants with minimalized number of measurement errors. We also measured the total duration of each of the vowels. We analyzed 331 vowel tokens before /l/, 171 before /n/, 172 before /s/ and 237 before /t/. The results concerning spectral properties of vowels are presented in Section 3.1, and for temporal properties in Section 3.3.
2.4 Analysis of consonants
For /n/ and /l/ we used the same formant extraction method as for vowels. For /s/ and /t/, the spectral center of gravity (COG), the spectral standard deviation, and the duration were measured using Praat. The COG is the weighted average of the frequency components of the spectrum over the selected time window from which it is measured; the standard deviation of the spectrum is the square root of the central moment of the spectrum and shows how much the frequencies in a spectrum deviate from the COG. For /s/, the measurements were taken with a 40 ms Hamming window (following the method of Jongman, Wayland & Wong Reference Jongman, Wayland and Wong2000) from the beginning and the middle of the consonant. To avoid overlapping of the measurement points, all segments with a duration below 80 ms were excluded. For /t/, the COG and spectral standard deviation were measured with a 10 ms Hamming window from the beginning and the middle of the release burst. As the burst can be very short, all segments with a duration below 15 ms were excluded from the analysis. We followed the method of Forrest et al. Reference Forrest, Weismer, Milenkovic and Dougall1988, but used a shorter window as the durations were shorter in our data. The exclusion of data points on the basis of duration was motivated by the fact that two measurement points should not overlap more than 50 $\%$
. The results for the temporal properties of consonants are presented in Section 3.3. Overlapping of the measurement points could not always be avoided, and we disregarded 6 data points for /t/ out of 349 tokens and 10 for /s/ out of 267 tokens. For /n/ we analyzed 171 tokens and for /l/ 647.
$\%$
. The results for the temporal properties of consonants are presented in Section 3.3. Overlapping of the measurement points could not always be avoided, and we disregarded 6 data points for /t/ out of 349 tokens and 10 for /s/ out of 267 tokens. For /n/ we analyzed 171 tokens and for /l/ 647.
In order to prevent short spectral peaks and remove unnecessary outliers, a 200 Hz cepstral smoothing was applied before the analysis of /s/ and /t/ (see Breithaupt, Gerkmann & Martin Reference Breithaupt, Gerkmann and Martin2007). The data were manually checked for very high or low values, and measurement errors were corrected. The results for consonants are presented in Section 3.2.
2.5 Statistical analysis
Statistical data analysis and visualization were carried out using R (R Core Team, 2021). A Generalized Additive Mixed Model (GAMM) from the mgvc (Wood Reference Wood2017) package was used to analyze the spectral properties of the vowels /ɑ o u/, and the consonant /l/. A GAMM is a regression model that is able to assess non-linearity in time-varying data. It differs from a linear regression model in that it allows one to smooth the data for a better fit, and it applies penalization to overcome overfitting by adding wiggliness to the regression line where applicable. For the estimation of smoothing parameters, fREML (fast restricted maximum likelihood estimation) was used; for smoothing, we used cubic regression splines. The residuals of the final models were checked for normality, and the auto correlative structure from the residuals was removed as far as possible by adding an autocorrelation parameter. For a more in-depth description of GAMMs, see Wieling (Reference Wieling2018), which we followed for this study.
For the analysis of /n/, we found that it is more suitable to use a linear mixed model (LMM) instead of a GAMM because there was a high degree of linearity in the data. GAMMs that were initially used for the analysis of /n/ also showed that the effect of palatalization was weak. To reduce the risk of over-fitting the model, we took mean values from 30 formant points of each consonant in a word and used that as a dependent variable in LMM. For the analysis of /s/, /t/, and /n/, LMM was used from the lme4 package (Bates et al. Reference Bates and Mächler2015). Linear models assume that there is a linear relationship between dependent and independent variables. They allow for both fixed and random effects.
To compare all pairs of non-palatalized vs. palatalized tokens, we used the formant values (F1, F2, F3) or the log-transformed duration as the dependent variables, and palatalization, vocalic context, and speaker gender as independent variables. After that, we carried out a series of post-hoc tests. The estimated values of non-palatalized and palatalized pairs, standard errors, and p-values were acquired by changing the intercept level of the model and then re-running it. In this pairwise comparison, the p-values were corrected by using the Bonferroni-Holm method with the p.adjust function. In post-hoc testing of segmental durations, the p-values were corrected with the Benjamini-Hochberg method. When there were no statistically significant interactions between pairs, an optimal model was chosen to describe the data. In all of the models, random intercepts for participants were included; if it improved the model fit, the test words were also used as a random intercept.
2.6 Formant trajectory visualization
For formant trajectory visualization, GAMM plots were made with the itsadug package (van Rij et al. Reference van Rij, Wieling, Baayen and van Rij2017); this plots the contours and the 95 $\%$
confident intervals from model predictions. We determined the time points (TP) that represent the relative locations where the formant trajectories of non-palatalized and palatalized segments differed significantly from each other. TPs were acquired using the plot_diff function from the itsadug package; this plots the different curves based on GAMM predictions. The function also gives the time points for which the compared contours differ significantly from each other. These points were added to the formant contour plots and to the model estimate tables. For /l/, we looked at the last timepoint where the difference was significant to assess the scope of palatalization in the consonant. If there was no difference, there was no effect of palatalization, the point was not plotted, and it is marked with an X in the tables.
$\%$
confident intervals from model predictions. We determined the time points (TP) that represent the relative locations where the formant trajectories of non-palatalized and palatalized segments differed significantly from each other. TPs were acquired using the plot_diff function from the itsadug package; this plots the different curves based on GAMM predictions. The function also gives the time points for which the compared contours differ significantly from each other. These points were added to the formant contour plots and to the model estimate tables. For /l/, we looked at the last timepoint where the difference was significant to assess the scope of palatalization in the consonant. If there was no difference, there was no effect of palatalization, the point was not plotted, and it is marked with an X in the tables.
3 Results
3.1 The quality of the vowels preceding the consonants
The following section analyzes the formants of the vowels preceding /l/, /n/, /s/ and /t/ using GAMMs.

Figure 1 Fitted F1, F2 and F3 values from the GAMMs for the vowels preceding /l/ in test words produced by the female (left panel) and male (right panel) speakers. The light colors represent the vowels in a palatalized context and the dark colors in a non-palatalized context: /a/ – red, /u/ – black. The relative location of the timepoint from where the difference between the palatalized and non-palatalized conditions occur is marked with a dot.
Table 2 The summary of outputs of the post-hoc GAMMs for the vowel formants with pairwise comparisons of palatalization for each vowel and gender. The table presents the estimates of the formant values of the vowels preceding non-palatalized /l/, the standard error (SE), the estimates of formant values of the vowels preceding palatalized /l/ and their standard error; the difference (Diff.) between the non-palatalized and palatalized conditions, the p-value (p) of the significance of the difference and the relative location ( $\%$
) of the timepoint from where the difference between the palatalized and non-palatalized conditions occur (TP; marked with X if there was no significant TP).
$\%$
) of the timepoint from where the difference between the palatalized and non-palatalized conditions occur (TP; marked with X if there was no significant TP).

3.1.1 Formant values of the vowels preceding /l/
Figure 1 shows the fitted F1, F2, and F3 values of vowels preceding /l/ from the GAMMs. Table 2 shows the outputs of the post-hoc models with multiple comparisons for each combination of vowel and gender.
F1 values of /ɑ/ preceding /l/ (Figure 1, Table 2) were approximately 70–100 Hz lower with palatalization for both genders (p < .001). The difference between the palatalized and non-palatalized conditions occurred at 27 $\%$
of the vowel duration for female speakers and at 25
$\%$
of the vowel duration for female speakers and at 25 $\%$
for male speakers. The F1 of /u/ was not affected by palatalization. F2 values of vowels were approximately 400–600 Hz higher with palatalization from the beginning of the vowel for both genders (all contexts p < .001). F3 values of /ɑ/ were 231 Hz lower from the beginning only for male speakers (p < .001). F3 values of /u/ for male speakers and F3 values of /ɑ/ and /u/ for female speakers were not affected by palatalization.
$\%$
for male speakers. The F1 of /u/ was not affected by palatalization. F2 values of vowels were approximately 400–600 Hz higher with palatalization from the beginning of the vowel for both genders (all contexts p < .001). F3 values of /ɑ/ were 231 Hz lower from the beginning only for male speakers (p < .001). F3 values of /u/ for male speakers and F3 values of /ɑ/ and /u/ for female speakers were not affected by palatalization.
3.1.2 Formant values of the vowels preceding /n/
Figure 2 shows the fitted F1, F2 and F3 values of vowels preceding /n/ from the GAMMs. Table 3 shows the outputs of the post-hoc models with multiple comparisons for each combination of vowel and gender.
F1 values of /ɑ/ preceding /n/ (Figure 2, Table 3) were approximately 70–90 Hz lower with palatalization for both genders (p < .001). F1 of /o/ was 50–70 Hz lower for both genders (p < .002). The difference between the palatalized and non-palatalized conditions in /ɑ/ occurred at 27 $\%$
of the whole duration for female speakers and at 30
$\%$
of the whole duration for female speakers and at 30 $\%$
for male speakers. The difference in /o/ was at 3
$\%$
for male speakers. The difference in /o/ was at 3 $\%$
for female speakers and at 24
$\%$
for female speakers and at 24 $\%$
for male speakers. F2 values of /ɑ/ were 350–410 Hz higher with palatalization for both genders (p < .001). F2 values of /o/ were significantly higher for female as well as male speakers (160–210 Hz; p = .024 and p = .002, respectively). The difference between the palatalized and non-palatalized conditions in /ɑ/ occurred at 6
$\%$
for male speakers. F2 values of /ɑ/ were 350–410 Hz higher with palatalization for both genders (p < .001). F2 values of /o/ were significantly higher for female as well as male speakers (160–210 Hz; p = .024 and p = .002, respectively). The difference between the palatalized and non-palatalized conditions in /ɑ/ occurred at 6 $\%$
for females and 9
$\%$
for females and 9 $\%$
for male speakers. In the context of /u/, the difference was at 44
$\%$
for male speakers. In the context of /u/, the difference was at 44 $\%$
for both genders. F3 values of /ɑ/ were 157 Hz higher with palatalization than without for female speakers (p = .009). The difference between the palatalized and non-palatalized conditions occurred at 61
$\%$
for both genders. F3 values of /ɑ/ were 157 Hz higher with palatalization than without for female speakers (p = .009). The difference between the palatalized and non-palatalized conditions occurred at 61 $\%$
. In the other contexts, palatalization did not have an effect on F3 values.
$\%$
. In the other contexts, palatalization did not have an effect on F3 values.
3.1.3 Formant values of the vowels preceding /܃/
Figure 3 shows the fitted F1, F2 and F3 values of vowels preceding /s/ from the GAMMs. Table 4 shows the outputs of the post-hoc models with multiple comparisons for each combination of vowel and gender.
F1 values of /ɑ/ preceding /s/ (Figure 3, Table 4) were 60–96 Hz lower with palatalization for both genders (p < .001). The difference between the palatalized and non-palatalized conditions in /ɑ/ was at 7 $\%$
for female speakers and at 39
$\%$
for female speakers and at 39 $\%$
for male speakers. The F1 value of /u/ was not affected by palatalization. F2 values of vowels were approximately 280–300 Hz higher from the beginning of the vowel with palatalization for both genders (all contexts p < .001). Male speakers’ F3 values for /ɑ/ were 161 Hz lower (p < .001) and those for /u/ were 130 Hz lower (p = .013) with palatalization than without. The difference between the palatalized and non-palatalized conditions in /ɑ/ occurred at 15
$\%$
for male speakers. The F1 value of /u/ was not affected by palatalization. F2 values of vowels were approximately 280–300 Hz higher from the beginning of the vowel with palatalization for both genders (all contexts p < .001). Male speakers’ F3 values for /ɑ/ were 161 Hz lower (p < .001) and those for /u/ were 130 Hz lower (p = .013) with palatalization than without. The difference between the palatalized and non-palatalized conditions in /ɑ/ occurred at 15 $\%$
and in /u/ at 24
$\%$
and in /u/ at 24 $\%$
of the whole duration. Female speakers’ F3 values were not affected by palatalization.
$\%$
of the whole duration. Female speakers’ F3 values were not affected by palatalization.
3.1.4 Formant values of the vowels preceding /瀄/
Figure 4 shows the fitted F1, F2 and F3 values of /t/ from the GAMMs. Table 5 shows the outputs of the post-hoc models with multiple comparisons for each combination of vowel and gender.

Figure 2 Fitted F1, F2, and F3 values from the GAMMs for the vowels preceding /n/ in test words produced by the female (left panel) and male (right panel) speakers. The light colors represent the vowels in a palatalized context and the dark colors in a non-palatalized context: /a/ – red, /u/ – black. The relative location of the timepoint from where the difference between the palatalized and non-palatalized conditions occur is marked with a dot.
Table 3 The summary of outputs of the post-hoc GAMMs for the vowel formants with pairwise comparisons of palatalization for each vowel and gender. The table presents the estimates of formant values of the vowels preceding non-palatalized /n/, the standard error (SE), the estimates of formant values of the vowels preceding palatalized /n/ and their standard error; the difference (Diff.) between the non-palatalized and palatalized conditions, the p-value (p) of the significance of the difference and the relative location ( $\%$
) of the timepoint from where the difference between the palatalized and non-palatalized conditions occur (TP; marked with X if there was no significant TP).
$\%$
) of the timepoint from where the difference between the palatalized and non-palatalized conditions occur (TP; marked with X if there was no significant TP).

F1 values of the /ɑ/ and /o/ preceding /t/ (Figure 4, Table 5) were 34–99 Hz lower with palatalization than without for both genders (all contexts p < .001). F1 values of /u/ were 17 Hz higher with palatalization (p = .002) for female speakers but not for male speakers. The location of the difference between the palatalized and non-palatalized conditions varied: for /ɑ/ it was at 5 $\%$
of the vowel for female speakers and at 18
$\%$
of the vowel for female speakers and at 18 $\%$
for male speakers; for /o/ at 37
$\%$
for male speakers; for /o/ at 37 $\%$
for female speakers and at 32
$\%$
for female speakers and at 32 $\%$
for male speakers and for /u/ at 38
$\%$
for male speakers and for /u/ at 38 $\%$
for female speakers. For male speakers, the difference was not significant. F2 values of the vowels were higher with palatalization for both genders (all contexts p < .001). For the vowels /ɑ/, /o/, and /u/, the location of the difference between the two conditions was at 3
$\%$
for female speakers. For male speakers, the difference was not significant. F2 values of the vowels were higher with palatalization for both genders (all contexts p < .001). For the vowels /ɑ/, /o/, and /u/, the location of the difference between the two conditions was at 3 $\%$
of the whole duration. F3 values of vowels preceding /t/ were not affected by palatalization.
$\%$
of the whole duration. F3 values of vowels preceding /t/ were not affected by palatalization.

Figure 3 Fitted F1, F2, and F3 values from the GAMMs for the vowels preceding /s/ in test words produced by the female (left panel) and male (right panel) speakers. The light colors represent the vowels in a palatalized context and the dark colors in a non-palatalized context: /a/ – red, /u/ – black. The relative location of the timepoint from where the difference between the palatalized and non-palatalized conditions occur is marked with a dot.
Table 4 The summary of outputs of the post-hoc GAMMs for the vowel formants with pairwise comparisons of palatalization for each vowel and gender. The table presents the estimates of formant values of the vowels preceding non-palatalized /s/, the standard error (SE), the estimates of formant values of the vowels preceding palatalized /s/ and their standard error; the difference (Diff.) between the non-palatalized and palatalized conditions, the p-value (p) of the significance of the difference and the relative location ( $\%$
) of the timepoint from where the difference between the palatalized and non-palatalized conditions occur (TP; marked with X if there was no significant TP).
$\%$
) of the timepoint from where the difference between the palatalized and non-palatalized conditions occur (TP; marked with X if there was no significant TP).
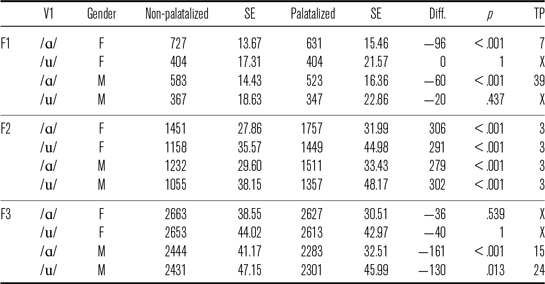

Figure 4 Fitted F1, F2, and F3 values from the GAMMs for the vowels preceding /t/ in test words produced by the female (left panel) and male (right panel) speakers. The light colors represent the vowels in a palatalized context and the dark colors in a non-palatalized context: /a/ – red, /u/ – black and /o/ – blue. The relative location of the timepoint from where the difference between the palatalized and non-palatalized conditions occur is marked with a dot.
Table 5 The summary of outputs of the post-hoc GAMMs for the vowel formants with pairwise comparisons of palatalization for each vowel and gender. The table presents the estimates of formant values of the vowels preceding non-palatalized /t/, the standard error (SE), the estimates of formant values of the vowels preceding palatalized /t/ and their standard error; the difference (Diff.) between the non-palatalized and palatalized conditions, the p-value (p) of the significance of the difference and the relative location ( $\%$
) of the timepoint from where the difference between the palatalized and non-palatalized conditions occur (TP; marked with X if there was no significant TP).
$\%$
) of the timepoint from where the difference between the palatalized and non-palatalized conditions occur (TP; marked with X if there was no significant TP).

3.2 Quality of the consonants
The following section analyzes the spectral properties of consonants. The formant values of /l/ were analyzed with GAMMs. For /n/, the GAMMs did not show significant interactions in post-hoc testing, and the data had non-linearity; thus, the mean of 30 formant points was taken and analyzed with a more suitable Linear Mixed Model. COG and the standard deviation of the spectrum of /s/ and /t/ were also analyzed with a Linear Mixed Model; the main effect of palatalization by vocalic context and gender is visualized on the boxplots.
3.2.1 Formant values of /l/
Figure 5 shows the fitted F1, F2, and F3 values of /l/ from the GAMMs. Table 6 shows the outputs of the post-hoc models with multiple comparisons for each combination of vowel and gender.

Figure 5 Fitted F1, F2, and F3 values from the GAMMs for /l/ in test words produced by the female (left panel) and male (right panel) speakers. The light colors represent /l/ in a palatalized context and the dark colors in a non-palatalized context: /a/ – red, /u/ – black. The dot marks the relative location of the last time point at which a difference between the palatalized and non-palatalized conditions exists.
Table 6 The summary of outputs of the post-hoc GAMMs for the formants of /l/ with pairwise comparisons of palatalization for each vowel and gender. The table presents the estimates of formant values of non-palatalized /l/, the standard error (SE), the estimates of formant values of palatalized /l/ and their standard error; the difference (Diff.) between the non-palatalized and palatalized conditions, the p-value (p) of the significance of the difference and the relative location ( $\%$
) of the timepoint from where the difference between the palatalized and non-palatalized conditions occur (TP; marked with X if there was no significant TP).
$\%$
) of the timepoint from where the difference between the palatalized and non-palatalized conditions occur (TP; marked with X if there was no significant TP).

F1 values of /l/ (Figure 5, Table 6) were 52–63 Hz lower with palatalization than without in the context of /ɑ/ for both genders (p < .001). The time point at which non-palatalized and palatalized contours were no longer different occurred at 78 $\%$
for female speakers and at 98
$\%$
for female speakers and at 98 $\%$
for male speakers. /l/ in the context of /u/ was 45 Hz lower with palatalization (p = .05) with a time point at 73
$\%$
for male speakers. /l/ in the context of /u/ was 45 Hz lower with palatalization (p = .05) with a time point at 73 $\%$
for male speakers. For female speakers, the difference was not significant. F2 values of /l/ were approximately 420–650 Hz higher with palatalization for both genders and vocalic contexts, and the values stayed higher until the end of /l/ (all p < .001). F3 values of /l/ were 181–365 Hz higher with palatalization for both genders in the context of /ɑ/ for female speakers (p < .001) and male speakers (p = .005) and in the context of /u/ (both genders p < .001) and stayed higher until the end of /l/.
$\%$
for male speakers. For female speakers, the difference was not significant. F2 values of /l/ were approximately 420–650 Hz higher with palatalization for both genders and vocalic contexts, and the values stayed higher until the end of /l/ (all p < .001). F3 values of /l/ were 181–365 Hz higher with palatalization for both genders in the context of /ɑ/ for female speakers (p < .001) and male speakers (p = .005) and in the context of /u/ (both genders p < .001) and stayed higher until the end of /l/.
3.2.2 Formant values of /n/
Figure 6 shows the formant values of /n/. We used the mean from 30 formant points for this analysis. The outputs of the Linear Mixed Model are reported in the text. The base values in the models were the non-palatalized productions of female speakers’ /n/ in the context of /ɑ/.

Figure 6 The mean formant values of non-palatalized (gray) and palatalized (pink) /n/ in different vocalic contexts. The top panel is for F3 mean values, the middle one for F2 mean values, and the bottom one for F1 mean values from 30 measurement points of /n/.
F1 is presented in the lower panel of figure 6. There was no significant effect of palatalization on the F1 value of /n/. Compared to female speakers ( $\beta$
= 342 Hz), the value was lower for male speakers (
$\beta$
= 342 Hz), the value was lower for male speakers ( $\beta$
= –41 Hz, t(41) = –3.02, p = .004).
$\beta$
= –41 Hz, t(41) = –3.02, p = .004).
F2 is presented in the middle panel of figure 6. Female speakers’ F2 of /n/ (base $\beta$
= 1696 Hz) was lower with palatalization (
$\beta$
= 1696 Hz) was lower with palatalization ( $\beta$
= –144 Hz, t(127) = –2.72, p = .007). In the case of male speakers, F2 was lower compared to female speakers (
$\beta$
= –144 Hz, t(127) = –2.72, p = .007). In the case of male speakers, F2 was lower compared to female speakers ( $\beta$
= –321 Hz, t(62) = –3.65, p < .001). In the interaction with palatalization, the F2 values were higher (
$\beta$
= –321 Hz, t(62) = –3.65, p < .001). In the interaction with palatalization, the F2 values were higher ( $\beta$
= 250 Hz, t(127) = –3.21, p = .002).
$\beta$
= 250 Hz, t(127) = –3.21, p = .002).
F3 of /n/, presented in the upper panel of figure 6, had a significant effect of gender (female base $\beta$
= 2780 Hz) and was lower for male speakers (
$\beta$
= 2780 Hz) and was lower for male speakers ( $\beta$
= –360 Hz, t(41) = –4.67, p < .001) but there was no significant effect of palatalization.
$\beta$
= –360 Hz, t(41) = –4.67, p < .001) but there was no significant effect of palatalization.
3.2.3 Spectral moments of /s/
Figure 7 shows the spectral center of gravity (COG) and the standard deviation of the spectrum measured at the beginning and at the middle of /s/. The base values in the models were the values at the beginning of the non-palatalized /s/ in the context of /ɑ/ of the female speakers.

Figure 7 The top panel is COG, and the bottom panel is the standard deviation of the spectrum from the beginning and the middle of /s/ in different vocalic contexts. Gray boxes represent non-palatalized productions, and pink boxes palatalized productions.
The COG (presented at the top of Figure 7) of the spectrum of /s/ had a significant main effect of vowel, palatalization, gender and the position of the measurement point. There was also a significant interaction between measurement point and palatalization. Compared to female speakers’ non-palatalized /s/ in the context of /ɑ/ (base β = 4402 Hz), the COG was lower with /u/ (β = –339 Hz, t(465) = –4.16, p < .001) and lower with palatalization (β = –550 Hz, t(465) = –4.67, p < .001). The COG was lower for male speakers (β = –673 Hz, t(41) = –2.99, p = .005) than for female speakers. The COG was higher at the midpoint (β = 946 Hz, t(465) = 8.71, p < .001) than at the beginning of /s/. COG values of non-palatalized /s/ were higher at the midpoint with palatalization (β = 593 Hz, t(465) = 3.86, p < .001).
The standard deviation of the spectrum (presented at the bottom of figure 7) was not affected by palatalization. Compared to the beginning of /s/ (base β = 2560 Hz), standard deviation was smaller at the midpoint (β = –334 Hz, t(297) = –7.06, p < .001).
3.2.4 Spectral moments of the burst of /t/
Figure 8 shows the spectral center of gravity and the standard deviation of the spectrum measured at the beginning and at the middle of the burst of /t/. The base values in the models were the value at the beginning of the non-palatalized /t/ in the context of /ɑ/ of the female speakers.

Figure 8 The top panel is the COG, and the bottom panel is the standard deviation of the spectrum from the beginning and middle of the burst of /t/ in different vocalic contexts. Gray boxes represent non-palatalized productions, and pink boxes palatalized productions.
The COG of the spectrum of the burst of /t/ is presented in the top panel of Figure 8. There were significant main effects of the vowel and the measurement points and a significant interaction between measurement points and palatalization. Compared to /t/ in the context of /ɑ/ (base β = 5923 Hz), COG was lower with palatalization (β = –587 Hz, t(405) = –2.01, p < .045). The COG was also lower in the context of /o/ (β = –2709 Hz, t(402) = –6.96, p < .001) and /u/ (β = –2722 Hz, t(403) = –8.04, p < .001). COG was higher at the midpoint (β = 1213 Hz, t(405) = 4.37, p < .001) than at the beginning of the burst. Compared to the non-palatalized /t/ in the context of /ɑ/, /t/ in the context of /u/ had a higher COG with palatalization (β = 923 Hz, t(407) = 2.31, p = .010). The COG was lower at the midpoint with the vowels /o/ (β = –967 Hz, t(406) = –2.31, p = .021) and /u/ (β = –794, t(406) = –2.21, p = .027)
The standard deviation of the spectrum of the burst of /t/ is presented in the bottom panel of Figure 8; it was not affected by palatalization. Compared to the beginning of /t/ (base β = 3529 Hz), standard deviation was smaller at the midpoint (β = –486 Hz, t(408) = –6.92, p < .001). The standard deviation of the spectrum was also smaller with the vowels /o/ (β = –681 Hz, t(408) = –6.82, p < .001) and /u/ (β = –557 Hz, t(408) = –6.48, p < .001).
4 Segmental duration
The following section analyzes the duration of consonants and the preceding vowels with Linear Mixed Models. The duration of vowels are plotted in Figure 9 and the duration of consonants in Figure 10. The mean values with the estimated difference between non-palatalized and palatalized conditions are presented in Table 7.
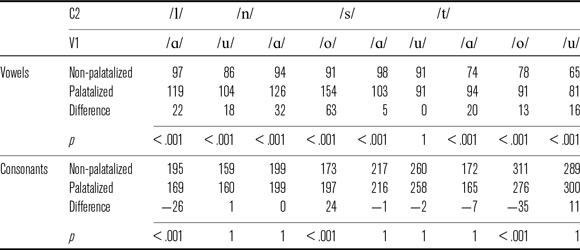
Post-hoc testing subsequent to a Linear Mixed Model in which the dependent variable was the duration of the vowels showed that /ɑ/ was 22 ms and /u/ was 18 ms longer (both p = .001) when preceding /lj/. This difference is also visible in Figure 9 and the corresponding mean values are presented in Table 7. /ɑ/ was 32 ms and /o/ 63 ms (both p = .001) longer when preceding palatalized /n/; /ɑ/ was 5 ms longer (p = .001) when preceding palatalized /s/ but /u/ was not longer in the same context. /ɑ/ was 20 ms, /o/ was 13 ms, /u/ was 16 ms longer (all p < .001) when preceding palatalized /t/.
Post-hoc testing subsequent to a Linear Mixed Model where the dependent variable was the duration of the consonant showed that /l/ was 26 ms shorter with palatalization in the context of /ɑ/ (p < .001), but not in the context of /u/. This difference is also visible in Figure 10; the corresponding mean values are presented in Table 7. /n/ was 24 ms longer with palatalization in the context of /o/ (p < .001), but not in the context of /ɑ/; the duration of /s/ was not affected by palatalization in either vocalic context; the whole duration of /t/ was 35 ms shorter in the context of /o/ with palatalization (p < .001), but not in other vocalic contexts.

Figure 9 The duration (in milliseconds) of vowels preceding non-palatalized (gray) and palatalized (pink) consonants.

Figure 10 The duration (in milliseconds) of non-palatalized (gray) and palatalized (pink) consonants in the context of vowels.
5 Discussion
This study investigated the realization of Estonian palatalization by analyzing the spectral and temporal properties of consonants and their preceding vowels.
5.1 The quality of the vowels preceding consonants
In order to capture the fine details of Estonian palatalization, we studied the acoustic cues that describe palatalization in Estonian vowels and quantified the beginning of formant transitions that distinguish non-palatalized and palatalized conditions. We hypothesized that the vowels preceding palatalized consonants would have higher F2, lower F1, and higher F3 values and, because speakers coarticulate segments in speech, it might be difficult to find a clear transition following a stable target segment. We also hypothesized that the formants are continuously moving throughout the whole vowel without a separate [i]-like the transition at the end of the vowel.
As expected, the mean F2 values of vowels in this study were always higher with palatalization, and F1 values tended to be lower. Contrary to the hypothesis, the palatalization effect on F3 values was weak and did not show any systematic variation. As the tongue moves up to the palate, the F2 values rise as the front cavity of the mouth becomes smaller and F1 values lower as the pharyngeal cavity becomes longer and wider as a consequence (Fuchs, Winkler & Perrier Reference Fuchs, Winkler, Perrier, Sock, Fuchs and Laprie2008, Lee, Shaiman & Weismer Reference Lee, Shaiman and Weismer2016). In that, secondary palatalization is realized by the same pattern in Estonian as in other languages.
Table 7 The duration (in milliseconds) of vowels and non-palatalized consonants and the durational difference between the non-palatalized and palatalized conditions. The p-values in the table are Benjamini–Hochberg corrected.
Previous research on palatalization has focused on describing palatalization through the properties of the transition from the preceding vowel to the consonant, often measuring the quality from a single or a few timepoints (Lehiste Reference Lehiste1965, Liiv Reference Liiv1965a, b, Vihman Reference Vihman1967, Derkach et al. Reference Derkach, Fant and de Serpa-Leitao1970, Purcell Reference Purcell1979, Howie Reference Howie2001, Kochetov Reference Kochetov2011, Ćavar Reference Ćavar2004, Kim Reference Kim2012, Ní Chiosáin & Padgett Reference Chiosáin2012, Teras & Pajusalu Reference Teras and Pajusalu2014, Põld Reference Põld2016, Piits & Kalvik Reference Piits and Mari-Liis2019). We wanted to get a more dynamic view of the movements of the formants and to objectively quantify the time point where the formant values in non-palatalized and palatalized consonants and the vowels preceding them were significantly different. This allowed us to assess how far the scope of palatalization extends into the preceding vowel.
We confirmed our hypothesis that it is difficult to define a stable vocalic segment and a following [i]-like transition. Our results in the current study showed similar results as in our articulatory study of the same data (Malmi & Lippus Reference Malmi, Sascha Calhoun, Tabain and Warren2019), namely that the movement from vowel to consonant was mostly continuous. The F2 values of the vowels that preceded palatalized consonants were almost always higher from the beginning of the vowel compared to those vowels preceding non-palatalized consonants. We attribute this finding to a natural coarticulatory pattern where adjacent segments affect the place of articulation of following segments (Lindblom Reference Lindblom1963a, b, Amerman, Öhman Reference Öhman1966, Daniloff & Moll 1970, Hammarberg Reference Hammarberg1976, Lisker Reference Lisker, Bell and Hopper1978, Farnetani & Recasens Reference Farnetani, Recasens, Hardcastle, Laver and Gibbon2013; Malmi Reference Malmi2014, Reference Malmi2016). At least with short vowels that precede palatalized consonants, we found that the speakers adjust for the movement early on and under-articulate these vowels. The F1 values of vowels were lower with palatalization, but the relative location of the turning point did not show a clear pattern. It varied across consonant contexts and genders in an unclear pattern.
5.2 The quality of consonants
We wanted to observe the possible acoustic cues that describe palatalization in Estonian consonants and to quantify the scope of palatalization. We hypothesized that F2 and F3 values of /l/ are higher and F1 is lower with palatalization. In addition, we expected F2, and F3 values of /n/ would be lower with palatalization, and the COG of /s/ would be lower, and the burst of /t/ would be higher. Additionally, based on a previous articulatory study on the same material (Malmi & Lippus Reference Malmi, Sascha Calhoun, Tabain and Warren2019), we hypothesized that the effect of palatalization reaches beyond just the beginning of the consonant as had previously been stated.
As expected, F2 and F3 values of /l/ were higher with palatalization, and F1 values were lower. F2 and F3 values were higher throughout /l/. This also correlates with the findings from our articulatory study, where we found that the place of articulation of /l/ was higher and more fronted with palatalization up until the end of /l/. Higher F2 and F3 values were also shown in previous acoustic studies (Lehiste Reference Lehiste1965, Vihman Reference Vihman1967, Remmel & Eek Reference Remmel and Eek1971). The rise in F2 shows that the tongue is more fronted and has moved towards the palate. The rise in F3 suggests that the lips might be less protruded or rounded with palatalization.
The F2 values of /n/ were lower with palatalization, while F3 and F1 were not affected. We know from our articulatory study (Malmi & Lippus Reference Malmi, Sascha Calhoun, Tabain and Warren2019) that the place of articulation of /n/ is definitely higher and fronted with palatalization, but as it has been noted by other researchers as well (Lehiste Reference Lehiste1965, Iskarous & Kavitskaya Reference Iskarous and Kavitskaya2018, Nance & Kirkham Reference Nance and Kirkham2020), this rise of the tongue body has a weak effect on the F2 of /n/. The lowering of F2 values in our study comes from the anti-formant that forms in the oral cavity and from the dampening effect of the nasal cavity the frequencies in the F2 region (Eek Reference Eek1972, Tabain et al. Reference Tabain, Butcher, Breen and Beare2016). Interestingly, the F2 values for /nj/ of female speakers varied and had a wider dispersion than male speakers. This is something that we cannot find an explanation for in the context of our study.
The analysis of spectral moments of /s/ confirmed our hypothesis and showed that there was a significant main effect of palatalization where the COG of /sj/ was lower compared to a non-palatalized context. This is in line with previous studies (Padgett & Żygis 2003, Hamann & Heriberto Reference Hamann and Heriberto2007, Kochetov & Radisic Reference Kochetov, Radisic, Babyonyshev, Kavitskaya and Reich2009, Malmi Reference Malmi, Sascha Calhoun, Tabain and Warren2019). The articulatory data showed that the tongue is higher and fronted with palatalization, and it would be expected that the COG would be higher with palatalization as well. Palatographic studies in Estonian (Ariste 1943, Eek Reference Eek1973) have shown that with palatalization, the passage through which air can flow over the tongue is narrower, and this might be the reason why the mean spectral energy is lower. Contrary to the preliminary findings of this study (Malmi Reference Malmi, Sascha Calhoun, Tabain and Warren2019), we found that the COG was higher at the midpoint of /s/. It might be that the consonant constriction is starting to be released at the midpoint, and the air can thus flow more freely. We also measured the standard deviation from COG from the beginning and the middle of /s/ and whether palatalization had any effect on this. We found that it did not. The only difference was that the standard deviation was smaller in the midpoint than at the beginning of /s/. This suggests that there is more movement at the beginning of /s/ as less in the middle.
The analysis of spectral moments of /t/ showed that there was a lot of variability in the production. Although the place of articulation of /t/ was higher throughout the consonant with palatalization in our articulatory study, the COG was only affected at the beginning of the burst; here, the values were lower. When we looked at the standard deviation of the spectrum of /t/ in the burst phase, we found that it was smaller with palatalization at the midpoint. Palatalization had no effect in the midpoint. A study on Russian (Kochetov Reference Kochetov2011) states that the COG is higher in the burst of /t/. It is probably this way because of the high degree of aspiration that comes with it in Russian; however, aspiration is not a feature of palatalization in Estonian.
Our acoustic data suggest that the effect of palatalization on the quality of /n/, /s/, /t/ is weak, and it only affects the quality of the first part of the consonant, as stated above. This means that the most important and persistent cue for palatalization in Estonian is the change in the quality of the preceding vowel. Interestingly, the formant values of /l/ were affected throughout. This might be because of the high degree of sonority, which makes this lateral consonant highly vowel-like.
As consonants in this study varied in regard to the manner of articulation, we struggled to find a unified spectral characteristic that would describe palatalization in consonants in the same way that the rise in F2 describes vowels. The COG values reported in the preliminary paper (Malmi Reference Malmi, Sascha Calhoun, Tabain and Warren2019) showed that the values of /l/ were higher and those of /n/ were lower. This follows the same pattern as the F2 values of /l/ and /n/ in this study. It could be concluded that although it is not common to analyze the quality of /l/ and /n/ through the COG, it might be a suitable unified spectral characteristic that describes palatalization in Estonian consonants.
5.3 The duration of vowels and consonants
Thirdly, we wanted to know whether the duration of the vowel is lengthened in the palatalization context and if palatalized consonants are longer than the corresponding non-palatalized consonants. In alignment with what previous research has shown, we hypothesized that the duration of the vowel that precedes palatalized consonants is lengthened. We expected that the duration of /s l n/ and the burst of /t/ are also longer.
The duration of the vowels were, as hypothesized, longer with palatalization. This longer duration has been explained (Lehiste Reference Lehiste1965, Liiv Reference Liiv1965a, Kochetov Reference Kochetov2006, Ordin 2011, Teras & Pajusalu Reference Teras and Pajusalu2014, Stoll, Harrington & Hole 2015, Piits & Kalvik Reference Piits and Mari-Liis2019) by the tongue raising towards the hard palate, which brings about the [i]-like the transition from the vowel into the consonant that accompanies secondary palatalization.
The duration of the consonants varied and did not show a systematic pattern. Both /l/ in the context of /ɑ/, and /t/ in the context of /o/ were shorter, while /n/ in the context of /o/ was longer with palatalization. The duration of /s/ and /t/ in the context of /ɑ/ is noticeably shorter than in other vocalic contexts. This is probably due to the fact that in the context of /ɑ/, the consonant was followed by another consonant, while in other vocalic contexts, it was not. The results are not fully in line with the results from our articulatory study, where we did not find that there was a strong effect of palatalization on the duration of the vowels and consonants. The reason for this inconsistency may lie in the fact that the sensors attached to the tongue in the EMA experiment could have had an effect on the temporal resolution of the tongue movements, adding variability and preventing the effect of palatalization from reaching a significant level. Researchers have found that there is a lengthening effect of palatalization on the duration of /s/ and on the burst of /t/ in other languages (Bolla Reference Bolla1981, Zsiga Reference Zsiga2000, Kavitskaya Reference Kavitskaya, Whalen and Best2006, Stoll et al. Reference Stoll, Harrington and Hoole2015).
5.4 Limitations and future perspectives
The current study is limited in that we could not control for the vocalic context of the consonants because we used a large selection of word pairs for the analysis, and thus these could not make a homogenous group. As the vowels that were analyzed in this study were short, we wonder if palatalization would affect long vowels from the beginning as well.
We analyzed all palatalized–unpalatalized consonant pairs that are available in Standard Estonian. Although they were all alveolar consonants, we chose to treat them separately because they differ in their manner of articulation. This means that we could not analyze the effect of palatalization on the quality of consonants with the same approach, and so we had to use different methods. Further, some of the consonants that we analyzed were in a word final consonant cluster. It could be argued that the consonant that follows the palatalized consonant affects its quality, but our current study and our articulatory study (Malmi & Lippus Reference Malmi, Sascha Calhoun, Tabain and Warren2019) shows that there are similar patterns in the realization of palatalization regardless of the following context.
If we compare the mean durations in the current study and in our articulatory study (Malmi & Lippus Reference Malmi, Sascha Calhoun, Tabain and Warren2019) that is based on the same data, we find that the durations seemed to be shorter with palatalization in the articulatory study. Although it might have been that the speech tempo was faster in the articulatory study, our results suggest that there are differences in how temporal properties of palatalization are realized in those two test conditions. Analyzing the effect of the articulograph on the quality of speech would be an interesting topic to look into as well.
6 Conclusions
In this study, the spectral and temporal properties of non-palatalized /l t n s/ and palatalized /lj tj nj sj/ and the preceding vowels were analyzed. For vowels and the consonants /l/ and /n/, the dynamics of F1, F2, and F3 values were analyzed; for /s/ and /t/, the center of gravity (COG) and the standard deviation from the COG were measured.
We applied a dynamic formant analysis on the vowels that preceded consonants and wanted to assess the scope of palatalization in the vowels by using a method based on statistics. The results showed that palatalization increased the F2 values of the vowels such that these values were almost always higher from the beginning of the vowels. F1 values decreased with palatalization, but the effect was weaker, and the scope was not as far-reaching as for F2. We found that speakers initiate the palatalization gesture early on and adjust their articulators in anticipation.
A formant analysis of /l/ showed an increase in the F2 and F3 values with palatalization, and the values continued to be higher throughout the lateral consonant, while F1 values were lower. F2 values of /n/ were lower with palatalization. The COG of /s/ was lower at the beginning of the segment with palatalization. At the midpoint of /s/, the COG values were higher with palatalization. The COG of the burst of /t/ was lower at the beginning with palatalization.
The durations of the vowels preceding palatalized consonants were longer, just as expected. However, the data did not show any systematic variation of duration in consonants with palatalization; this was unexpected.
The data suggest that the most persistent acoustic cues for palatalization of consonants in Estonian are the change in the quality and the lengthened duration of the preceding vowel. The effect of palatalization on the consonant is weaker and seems to only affect it in the first part. This was unexpected because the results from our articulatory study on the same data showed that the tongue stayed higher throughout the consonant. Acoustic and articulatory data are not always comparable and need to be complemented by each other to get a complete picture of how palatalization is realized.
Acknowledgments
The authors are grateful to the participants of this study. We would also like to thank Eva Liina Asu, Katrin Leppik, Helen Türk, Tuuli Tuisk, Pire Teras, and Joshua Wilbur for their feedback on this manuscript and two anonymous reviewers for their helpful comments.


 Open access