

Introduction: why charitable pay attracts controversy
In periods of fiscal austerity and rising income inequalities, the rewards available to senior executives have been the subject of criticism. The pay and bonuses of private sector staff are regularly in the media spotlight, while the salaries of senior employees in important public institutions have also attracted attention. A prominent example was the negative reaction to proposals in 2012 for an increase in the salary of British MPs to £74,000 (IPSA, 2013), prompting the leaders of the main political parties to urge MPs to decline the awards. A review of high salaries in the public sector chaired by the prominent journalist Will Hutton (Reference Hutton2011) acknowledged public concerns and made suggestions designed to allay them, while also warning that too much negative publicity would decrease the attractiveness of the public sector to high-fliers.
Attention has recently turned to salaries paid by charities to their senior staff, with prominent press reports highlighting apparent excess and drawing attention to the propensity of particular types of charities to pay high salaries. It is entirely understandable that there is debate about the appropriateness of salary levels, given the stated purposes of charitable organisations and the importance of maintaining donor confidence. Of course, the range and complex nature of activities undertaken by large charities, combined with the multiple demands for accountability from a range of stakeholders, mean that management and leadership is demanding. Charities also operate in a competitive labour market in which executive talent is (or is at least perceived to be) in short supply. Thus, one might expect salaries of senior staff in charities to be competitive. However, charities are also under pressure to demonstrate their cost-effectiveness, particularly at times of austerity.
Nevertheless, the criticisms have been forcefully expressed, albeit based on limited evidence: one report looked at the 150 largest charitiesFootnote 1 while another focused on a still smaller subset of the charity population, organisations affiliated to the Disasters Emergency Committee.Footnote 2 Another analysis chose fifty organisations on the grounds that they were among the best-known charities according to a charity awareness monitor (nfpSynergy, 2013). The most recent press reports were based on data for the one thousand largest charities, albeit with some carefully specified exclusions (e.g. independent schools, universities, quangos and NHS-run charities – Mostrous and Kenber, Reference Mostrous and Kenber2015). In none of these cases can inferences be made about the wider population of charities. The only academic article known to have investigated the issue for the UK concentrated on the 100 largest charities (Jobome, Reference Jobome2006). In response to these concerns, the House of Commons Public Administration Select Committee called for written evidence and held one oral evidence session, but the written submissions cited no academic evidence nor did they rebut the anecdotal reports appearing in the press (Public Administration Select Committee, 2013). The Committee never produced a report on the issue. The present article is based on our own submission to that Committee.
Clearly, criticisms could adversely affect public support for charities at precisely a time when there are great expectations of what they can deliver. An evidence-based perspective is therefore very important. An obvious difficulty is that there are no normative guidelines which might be used for determining what salaries might be appropriate. We would expect variation, because the population of charities in England and Wales is very heterogeneous. Organisations which might appear broadly comparable (in terms of aggregate levels of expenditure) may vary considerably in terms of organisational complexity (e.g. national or international scope of their activities), the nature of the needs to which they respond, their funding sources, and the numbers and types of external stakeholders. Individual organisations are responsible for their own decisions about salaries; the Charity Commission regards this as a matter for the trustees of charities and does not specify how they should arrive at their decisions. There are no explicit regulatory limits on excessive compensation and nor is there any mechanism for providing general recommendations which could be expected to be widely implemented.
In this article, we provide a robust analysis, drawing on data gathered from a representative starting sample of 10,500 charities in England and Wales, and we compare the statistics generated with national survey data on individuals. Charities whose annual income or expenditure exceeds £500,000 must disclose the numbers of paid staff who receive salaries in excess of £60,000, and also the numbers in each £10,000 salary band above this threshold figure. This allows two kinds of analysis: a comparison of the prevalence of high salaries between different sectors of the economy, and an investigation of the distribution of high salaries within the charitable sector. In more detail, we assess:
-
1. How many individuals employed by registered charities receive salaries above the £60,000 threshold, and above other relevant thresholds for comparison, such as chief executive salaries in private sector companies?
-
2. What proportion of staff employed by charities receive such salaries, and how does that figure compare with the distribution of those salaries across other sectors of the economy?
-
3. What are the characteristics of charitable organisations paying such salaries, and how do those characteristics differ from those of the charity population as a whole?
The structure of the article is as follows. In the next section, we review theories of wage setting and their relevance to discussions of remuneration in charitable organisations; we also consider the characteristics of such organisations that might be associated with the propensity to pay high salaries. We then provide a description of the survey and administrative data, on individuals and charities respectively, which we use in our analyses. The final section presents our results.
Research questions
Theories of wage setting
Within basic economic theory, a wage is simply the price of labour and is determined by supply and demand, if there is a sufficiently free market. Wages are likely to be higher when the availability of labour is scarce – hence high wages for chief executives may be justified as reflecting rarity of management talent. In practice, and in the non-profit sector, this model of wage setting is unlikely to apply. Rutherford (Reference Rutherford2015: 125) divides the relevant literature into two separate strands – one that looks at the self-selection of workers into the sector (associated with a warm glow or feelings of altruism), and one that looks at the limits on what a non-profit is able to do given its organisational status. Rutherford (Reference Rutherford2015) provides an account of theories of wage setting in the voluntary sector, drawing on theoretical and empirical literature; we focus on those elements more relevant to issues of higher pay in charities, which constitute the largest single element of the voluntary sector in the UK.
The difficulties associated with observing effort and performance have prompted other approaches to wage setting, including efficiency wages and (particularly at the higher-paid end) principal-agent theory. Within economics, the approach of ‘principal and agent’ has been deployed to consider the setting of executive pay, and also to analyse the setting of high pay in non-profit organisations (Jegers, Reference Jegers2009) and the public sector (Francois, Reference Francois2000). This model characterises situations in which managers have their own interests, and stakeholders (such as trustees) want to find ways to ensure that the incentives of managers are aligned with those of the organisation, when monitoring is costly and imperfect. Of course, the assumption that managers are essentially selfish may not be perceived as an appropriate characterisation for those seeking to work in non-profits. However, Nikolova (Reference Nikolova2014) shows using empirical analysis that the degree of monitoring of those on high pay within charities is relatively effective, and acts to reduce the scope of independent action by executives.
Other research has looked at the notion of fairness in setting of wages, and the effects of different levels of inequality – with more narrow bands of equality more typically found in the non-profit sector (e.g. in Hamann and Ren's (Reference Hamann and Ren2013) analysis of private and non-profit care homes). This seems to be linked to the intrinsic motivation of those attracted to working in this sector (Leete, Reference Leete2000). Again, Rutherford (Reference Rutherford2015) summarises the literature on pay differences between sectors.
Possible influences on prevalence of high salaries
Organisational size, complexity and performance
A consistent theme is that higher levels of remuneration are related in some ways to measures of performance, which can include measures of size (employment, turnover), or income derived from a particular level of input (e.g. Carroll et al., Reference Carroll, Hughes and Luksetich2005; Grasse et al., Reference Grasse, Davis and Ihrke2014). We would therefore expect levels of compensation to be larger among the larger charities. Even so, the links between pay and performance may be weaker in the non-profit sector than among for-profits – something found by Cheng (Reference Cheng2014) for presidents of public universities in the USA. Jobome (Reference Jobome2006) also drew attention to the large fixed component of remuneration for staff in charities, with bonuses and other performance-related pay playing a much smaller part in charities than in the corporate sector. Conversely, Mesch and Rooney (Reference Mesch and Rooney2008) found an important link between pay and performance for those staff engaged in fundraising in non-profit organisations.
We further hypothesise that, in addition to size (measured in financial terms), organisational complexity might influence the propensity to pay high salaries. One proxy for this is the geographical scope of the activities of a charity: whether or not it operates just in the geographical region in which it is based, or whether it has a national or indeed international reach. Most British charities are small and local (Clifford, Reference Clifford2012; Mohan and Breeze, Reference Mohan and Breeze2016: chapter 3), but significant numbers operate across several regions of the UK, and internationally. The latter, in particular, generate demands, especially in terms of accountability and political sensitivity.
Labour markets
There are persistent and large disparities in living costs and unemployment rates within England and Wales, seen in large variations in housing costs and wage levels. Many charities are located in high-cost regions, particularly London and the South-East of England. Survey data suggest that charities which describe themselves as ‘head offices’ are significantly over-represented in London (Mohan and Breeze, Reference Mohan and Breeze2016: 47–8). Whatever one's view on the desirability or otherwise of this concentration, it does mean that charities must respond in order to recruit and retain staff. We therefore hypothesise that there will be regional variations in the likelihood of paying high salaries, with London particularly relevant as a very high cost location.
Volunteers
There has been some discussion of the effect of having volunteers on the pay levels of the paid workers. Pennerstorfer and Trukeschitz (Reference Pennerstorfer and Trukeschitz2012) review a number of possible connections between pay levels and the presence of volunteers. These include the idea that workers may be expected to ‘donate’ a degree of labour in a context where some people are donating the entirety of their labour (as volunteers), and that having volunteers may reduce the stress levels of paid workers and hence the need for more compensation. Conversely, having volunteers may represent a saving on labour costs that might be used to pay more to paid workers. However, in their empirical analysis, it was clear that having volunteers contributed to lower levels of pay – of around 13 per cent. Similarly, Haider and Schneider (Reference Haider and Schneider2010) used Austrian data to find that the presence of volunteers (although not the number of volunteers) acted to reduce average wage levels (though not specifically rates of higher pay) in non-profit organisations. Given that this past research has tended to look at the link between volunteers and general pay, we should be cautious about expecting these kinds of links to hold when we turn to issues of higher rates of pay.
Funding mix
Haider and Schneider (Reference Haider and Schneider2010) found a positive relationship between the proportion of charitable income received through donations and the wages of higher-paid workers in the organisation, but this did not apply to charitable employees more generally. In their study, of Austria, they found that public subsidies acted to increase the wages of all workers. In the USA, however, Gaver and Im (Reference Gaver and Im2014) suggest that compensation for chief executives was generally lower for organisations that received government funding, but tended to be higher where income was largely recouped from investments.
Overview
There are a number of variables identified in the literature regarding wage setting in the non-profit sector. Some relate to wage levels more generally, others focus on those of the chief executive or other very highly paid staff. There are also indications of a very diverse sector, with some parts more sensitive to performance issues than others. We use this literature to guide the empirical analysis below. We also include variables relating to scale of operation and to region, which provide proxies for organisational complexity and for within-country variation in labour markets. Note that we do not, at this stage, possess longitudinal data, which would allow the assessment of any potential link between changes in charity performance and the effects on changing compensation of senior staff.
Data and models
In taking forward our analysis, we look at data of two kinds. The first is from a large sample survey – the Annual Population Survey – which has the advantage that it enables us to compare pay levels between private, public and third sectors. The disadvantages are that such surveys of individuals are voluntary, and may well under-represent the very highest paid. The comparative scarcity of those on the highest incomes means that few will be identified in such sample surveys.
We then look at administrative data on the sector. This has the advantage of providing accurate data from individual organisations, since reporting is mandatory; moreover, the sample of charities used was designed to be weighted to those organisations that constitute the great majority of the economic weight of the sector. The sample was constructed by the Third Sector Research Centre (TSRC) in conjunction with the National Council for Voluntary Organisations (NCVO) (Kane et al., Reference Kane, Clark, Clifford, Mohan, Dobbs and Bass2013) and is used in authoritative analyses of the third sector such as NCVO's annual Almanac, but it is true that the data do not permit comparisons between different economic sectors.
Charities whose income or expenditure exceeds £500,000 in the financial year must report the number of employees who earn above £60,000 per annum, and the numbers of employees, if any, in each £10,000 income band above that threshold. This disclosure requirement was introduced in the 1995 Statement of Recommended Practice (SORP) for the preparation of charity accounts – at that time, the threshold was £40,000. Our understanding is that this was an intuitive figure rather than one based on a particular position in the income distribution, or on the thresholds for higher tax bands.Footnote 3 A precedent for such reporting had been set by the 1985 Companies Act which had required disclosure starting at £30,000. Note that the regulatory requirements do not extend to reporting of other rewards, which might be offered to senior staff, such as accommodation or health insurance, so the focus is purely on monetary compensation.
Data were gathered from charity accounts, and notes to the accounts, on the numbers of people paid at higher levels and above for the financial year 2011–12. Note that the data include information on the most highly paid members of staff; this is likely to be (or to include) the charity's chief executive in most cases, but it could instead be other persons, particularly for the highest paid (e.g. a highly paid artiste in a cultural institution or an expert surgeon in a hospital). However, this limitation also applies to previous reports and studies in this field in the UK, and our interest is in the prevalence of high salaries, rather than accounting for the salaries of chief executives per se.
The administrative data we hold also include several further items of information about the characteristics of the charities. Firstly, it includes classification of charities according to the ICNPO (International Classification of Non-Profit Organisations) schema. This was developed because most non-profits are concentrated in a relatively small part of the Standard Industrial Classification (SIC) and there was a desire to provide greater detail about subsets of the non-profit population (Salamon and Anheier, Reference Salamon and Anheier1996). Secondly, the National Council for Voluntary Organisations (NCVO) use what they term a ‘General Charities’ classification, designed to identify a broad population of entities that conform to the public understanding of charity, and to pinpoint other entities which do not conform to that understanding, either because they are ultimately controlled by government (non-departmental public bodies, charities ultimately controlled by health authorities); provide benefits to limited classes of the population (benefit societies, some professional associations); or provide limited public benefits (independent schools). We differentiate between these types in our analysis.
Finally, we include geographical identifiers. Although working out precisely where charities operate is a long-standing challenge, we can identify the scale of operation of charities because they are asked to report a description of their ‘area of operation’ by listing the local authorities (naming up to ten) and countries in which they are operating. We therefore construct a variable with four categories, which ranges from charities operating within a single English or Welsh local authority to the international scale. This provides a proxy for organisational complexity. The geographical region in which a charity is located allows us to capture labour market and living cost issues (e.g. the need to pay higher salaries in competitive labour markets).
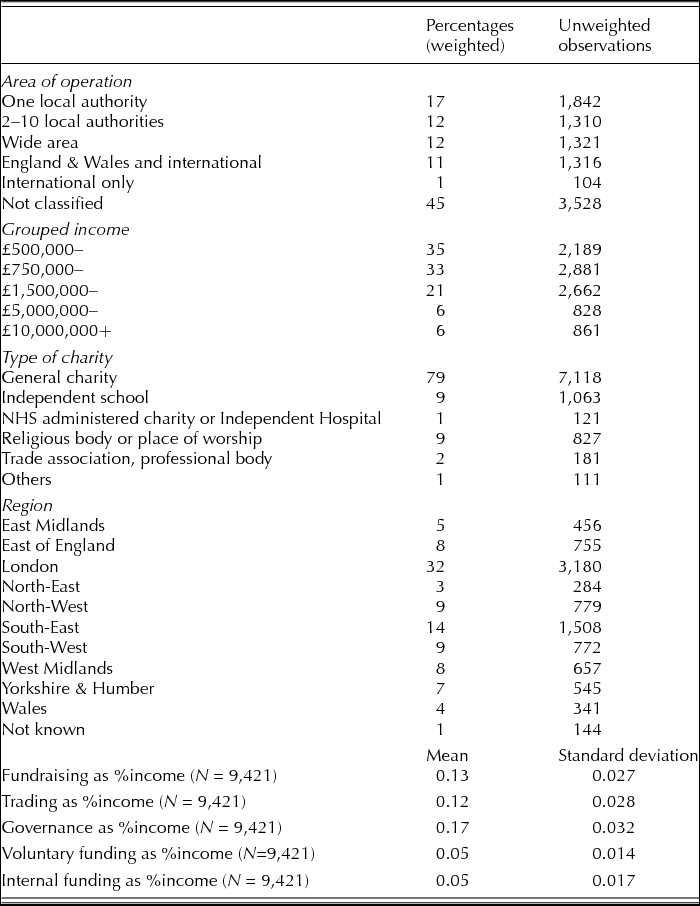
Some organisations were not, in the financial year for which we captured the data, required to report numbers of employees; these included housing associations. We therefore excluded such organisations. There are also several universities in our sample, but since not all universities file reports with the Charity Commission, we also excluded these from analysis, along with private schools. We also drop those organisations in the sample with annual incomes or expenditures of below £500,000; they are not required to report in as much detail as entities above that threshold so we cannot be certain whether or not they have no staff paid above £60,000 or whether they have simply not reported it. The combined effect of this was to reduce the sample size, but at over 9,400 cases the basis for analysis is robust.
We focus on two types of dependent variables. First, whether an individual is highly paid (in the survey data) and whether a charity employs someone on a high salary (and, if so, the number). We present basic descriptive statistics to show bivariate associations with a range of different variables. In each case, we then model this outcome using logistic regression. The (binary) logistic regression model is used where a dependent variable may only have two values – in this instance, whether a person was on a high salary, yi , takes the value 1 if the individual is highly paid, and 0 otherwise:
 $$\begin{eqnarray*}
{\bm{y}_{\bm{i}}} = \left\{ {\begin{array}{l} {1} \\ {0} \end{array}} \right.
\end{eqnarray*}
$$
$$\begin{eqnarray*}
{\bm{y}_{\bm{i}}} = \left\{ {\begin{array}{l} {1} \\ {0} \end{array}} \right.
\end{eqnarray*}
$$
 $$\begin{eqnarray*}
\Pr \left( {{\bm{y}_{\bm{i}}} = 1{\rm{|}}\bm{x}} \right) = \frac{{{\bm{e}^{\bm{x}\prime\bm{\beta }}}}}{{1 - {\bm{e}^{\bm{x}\prime\bm{\beta }}}}}
\end{eqnarray*}$$
$$\begin{eqnarray*}
\Pr \left( {{\bm{y}_{\bm{i}}} = 1{\rm{|}}\bm{x}} \right) = \frac{{{\bm{e}^{\bm{x}\prime\bm{\beta }}}}}{{1 - {\bm{e}^{\bm{x}\prime\bm{\beta }}}}}
\end{eqnarray*}$$
In this equation, x is the set of explanatory variables that capture the set of independent variables, such as individual socio-economic characteristics, demographics and characteristics of the employing organisation where applicable.
In the administrative data, we are also able to consider the number of employees who are on high salaries. These kind of count data require a different kind of statistical model. Often such data are modelled using Poisson regression, but instead we use a negative binomial model, to model the number of staff who are highly paid. This is a more flexible approach than the Poisson model as it does not require the mean and variance to be the same. An alternative would be to consider various ‘zero-inflated’ models, if we suspect that the process giving rise to a zero outcome (i.e. having no staff paid above the £60,000 threshold) is somewhat separate.
Descriptive findings
Survey estimates
The Annual Population Survey (APS) is the largest survey sample available for looking at third sector workers – the closest that the UK has to a ‘micro-census’. We analyse the survey for July 2012–June 2013 (ONS, 2013), with a sample size of close to 3,000 in this sector on whom we have salary data. As well as those employed by charities, the survey will include people working in the broader third sector (such as many housing associations). University employees are separately identified, however.
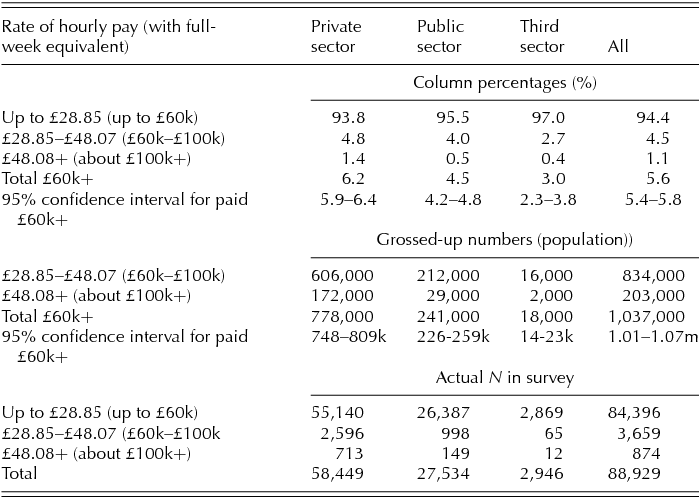
In Table 1 we show raw numbers, estimates of population figures, and percentages. So, we find that 0.4 per cent of those in the third sector were earning £48.08 or more per hour, which equates to an annual salary of around £100,000. This roughly equates to 2,000 people in the UK population, but this number cannot be regarded as reliable because it is based on only twelve people in the actual survey – so the true national figure could be a lot higher or a lot lower. Despite the small numbers of respondents, it seems clear that the proportions of employees paid the equivalent of £60k or more are highest in the private sector, and are higher in the public sector than in the voluntary sector. The proportions of staff paid at this level comprised 6.2 per cent (95% confidence interval 5.9–6.4 per cent) in the private sector, 4.5 per cent in the public sector (95% CI: 4.2–4.8 per cent) and 3.0 per cent in the third sector (95% CI: 2.3–3.8 per cent). The large gaps between these non-overlapping confidence intervals provide some confidence that there is a distinct ranking from private, to public, to third sector in the proportion of staff paid £60,000 or more.

Administrative data
In our sample, we found reports of banded salaries covering 9,935 organisations, on the basis of which we estimate that there are some 11,600 staff in English and Welsh charities who were paid at least £60,000. This compares to a Labour Force Survey estimate of the third sector workforce, for 2011, of around 800,000 – or approximately 1.3 per cent of the total workforce in the sector, although the figure of 800,000 would also include non-charitable third sector organisations. Focusing only on charities, reports from their annual accounts suggest an absolute minimum employment figure for English and Welsh charities of around 650,000 and our estimate equates to 1.7 per cent of this total. Other estimates, drawn from survey data on organisations, suggest that employment in charities in England alone was around 800,000 in 2010 and that was based on a survey which excluded significant numbers of charities, such as private schools (Geyne Rajme and Mohan, Reference Geyne Rajme and Mohan2012). Thus, the proportion of personnel in receipt of salaries over £60,000 could be as low as 1 per cent. Therefore our view is that the APS figure (3 per cent) is likely to be an overestimate of the percentage of charity sector workers who are paid salaries of £60,000 or more.
What are the characteristics of charities which pay salaries at this level?
The proportion of charities with higher-paid staff rises quite sharply with the income level of the charity (Table 2). Where the charity's annual income is between £500,000 and £750,000 only 2 per cent had workers with salaries of £60,000 or more. This reached close to three quarters (72.5 per cent) where the income was £10 million or higher, though there are fewer than a thousand charities of this magnitude.
Table 2 Proportions of higher paid staff by income of charity

Source: TSRC/NCVO sample of charity accounts.
We may also look at the distribution of higher-paid staff across the sector, by income levels (Table 3). So, 66 per cent of higher-paid staff are found in the 9 per cent of organisations above the £500,000 reporting threshold with an income exceeding £10m per year. Under 2 per cent were found in charities with an annual income of between half and three-quarters of a million pounds.
Table 3 Distribution of higher paid staff by income of charity
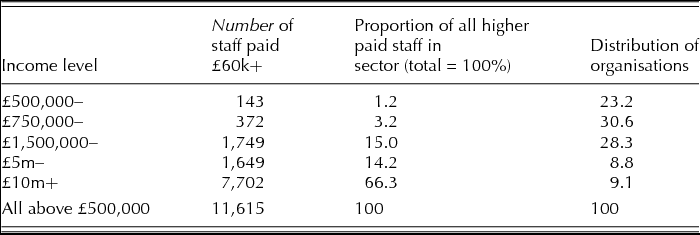
Source: TSRC/NCVO sample of charity accounts.
We also provide a breakdown of those subsectors, classified in terms of the ICNPO schema, that have higher and lower proportions of well-paid staff. We see a preponderance of the education sector, business/professional associations, nursing homes and medical research charities among the most likely to have some staff paid £60,000 or more. The largest proportions are in private educational establishments (where 50 per cent of all organisations have at least one member of staff paid over £60,000), followed by professional associations (44 per cent, though these are numerically small), then medical research and nursing homes (the latter includes a number of hospices). The base proportion is around 22 per cent, so it could be argued that these organisations are over-represented.
Another way of looking at this is to consider the types of organisation with the largest share of people paid a high salary, compared to their share of the number of organisations in the dataset. Thus, private educational establishments constitute around 9 per cent of the number of organisations, but account for 27 per cent of organisations which have at least one employee paid over £60,000. Conversely, in the broad social service category there are 12 per cent of organisations paying at least one member of staff over £60,000, but this category constitutes 15 per cent of the total number of organisations. Charities operating in the sphere of economic, social and community development account for 3.4 per cent of organisations but less than half (1.6 per cent) of the share of organisations paying salaries of £60,000 or more. Organisations classed in the ICNPO ‘religious’ classification constitute some 14 per cent of organisations, but account for only 6 per cent of the organisations which pay at least one person a salary of £60,000 or more.
The numbers of staff in receipt of salaries in excess of £100,000 is small, particularly at the top end of the distribution where fewer than 100 salaries above £250,000 were recorded, largely in private hospitals and medical research. In the range between £100,000 and £150,000, private schools account for over 30 per cent of the total but otherwise the shares of the numbers by ICNPO classification are broadly consistent with the share of the total number of organisations.
The small numbers who earn salaries in excess of £150,000 (approximately 350 people in our sampled organisations) are generally found in health-related charities (medical research or hospitals), or in educational charities. But these are exceptional figures. They do not approach the sorts of rewards offered to executive staff in large private companies. In a wider context, discussion of financial rewards often focuses on FTSE 100 companies. Few, if any, charities approach the annual revenues of these organisations, in which the median pay (i.e. excluding bonuses and other rewards) for Chief Executives was £830,000 (KPMG, 2012). We found only two salaries in the charitable sector exceeding this level – one the artistic director of a major cultural institution and the other a very highly paid employee of a private hospital. These are high numbers by (almost) any standards, and somewhat removed from the levels found in other charities. When we consider that only a small minority of charitable organisations come anywhere near the size of the largest private companies, this should not surprise us, but some small and medium-sized enterprises clearly pay higher salaries than are typically found in charities.
An Institute of Directors study showed that a typical salary for a small business with a turnover of up to £5 million per annum was £70,000; for enterprises with a turnover between £5 million and £50 million it was £100,000; and for larger enterprises, salaries averaged £128,000. Since these figures were obtained in autumn 2010, they are broadly comparable with our charity data, which relate to 2010–11.Footnote 4 In contrast, only 22 per cent of those charities reporting a turnover of up to £5 million in 2010–11 reported that they had any employees paid over £60,000. These comparisons are broadly consistent with our survey data and hardly suggest that charity pay is excessive.
Multivariate analysis
Survey data
In Table 4 we show the results from a logistic regression model, using survey data on individuals, of the likelihood of being paid more than £60,000 (or the equivalent in terms of hourly pay). We show three models: one just with sectors identified, which explains very little of the variation in earnings; a more developed model with demographic factors; and a third model that also adds occupation and industry. The results are shown in terms of odds ratios.
Table 4a Logistic regression of being highly paid – earning £60,000+ (odds ratios)
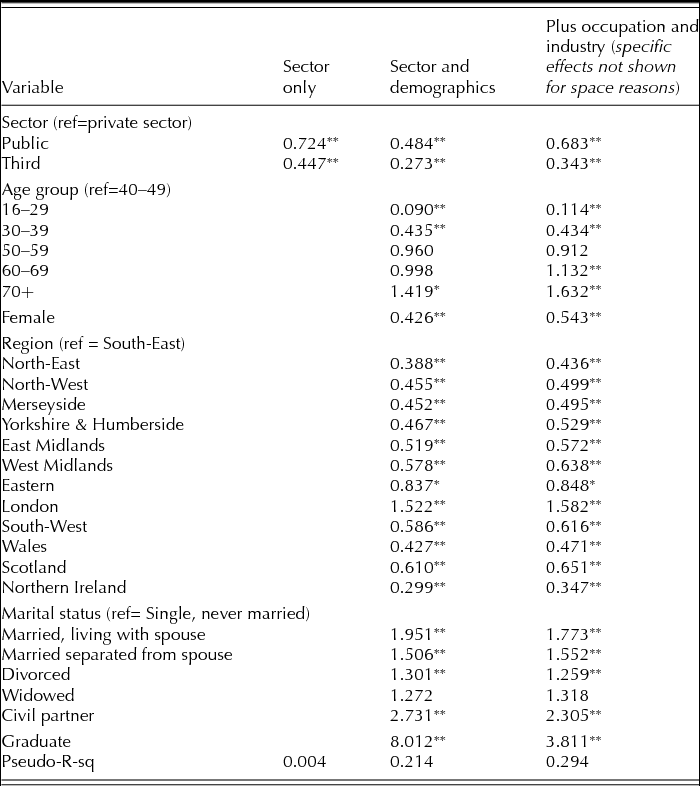
Note: ** = significant at the 1% level, * = significant at the 5% level. N = 88,929.
Source: ONS (2013).
Table 4b Independent variables, distribution in the estimation sample (N = 88,929)
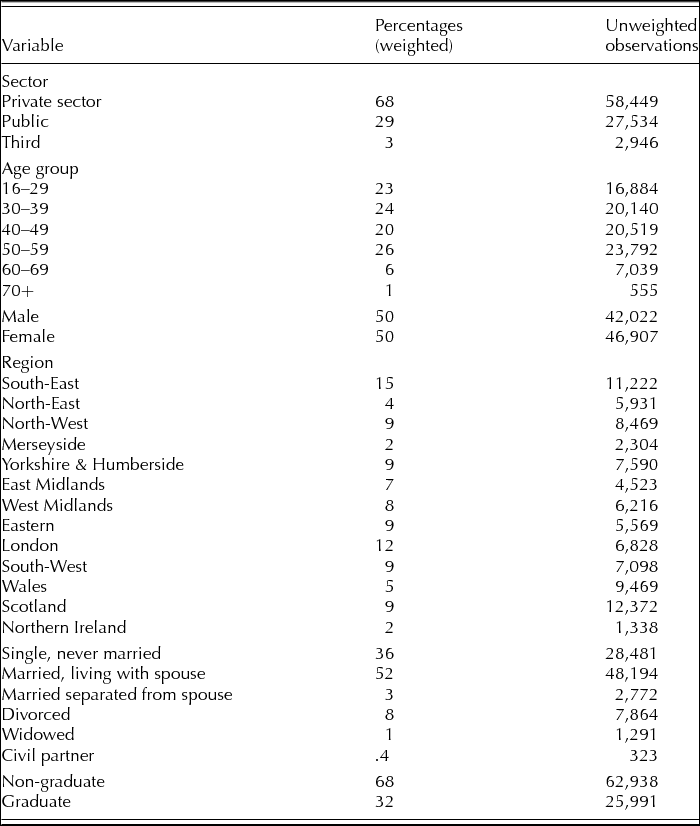
Note: ** = significant at the 1% level, * = significant at the 5% level. N = 88,929.
Source: ONS (2013).
The negative effect of working in the third sector (compared with the private sector) on the chance of being highly paid was stronger in the more developed model than in a simple model just including sector. Thus, the odds of being highly paid dropped from 0.45 (sector-only model) to 0.34 (most developed model). In other words, third sector workers are even less likely to be highly paid than their personal circumstances (such as older age, and better qualifications) might suggest. Among other factors, being highly paid was statistically associated with:
-
• Working in the private sector (and individuals working in the public sector were also more likely to be highly paid than those in the third sector).
-
• Being aged 60+, although fewer are in work at such ages. Younger workers were the least likely to be in the highly paid group, and by a large degree.
-
• Gender – men were considerably more likely than women to receive high salaries.
-
• Working in London, particularly, or the rest of the South-East. Those least likely to be highly paid were working in Wales, Northern Ireland and the Northern regions of England.
-
• Having a degree.
-
• Being married (or in a civil partnership), or having previously been so.
The size of the effect of working in the public sector, and having a degree, were considerably reduced once information on occupation and industry were added, in the third model. The incidence of high pay was greatest for those who were managers and directors, and in particular industries (energy and water, transport and communication, banking and finance).
Administrative data
A number of factors might influence the likelihood that a charitable organisation pays one or more members of staff a salary of £60,000 or more (see section on ‘research questions’). These include the size of the organisations (measured, for these purposes, in financial terms); its location; the proportion of income from trading activities; and the subsector within which it operates (education, environment, international development, etc.).
We used a binary logistic regression model to explore the probability that organisations did, or did not, employ someone with a salary of £60,000 or greater. This was supplemented by a negative binomial model, which models the number of staff who are highly paid. It turned out, however, that the models give rise to relatively similar conclusions – for results see Table 5. We restrict the sample for the statistical models in a number of ways, giving a sample size of 9,421 for the statistical estimates.Footnote 5 Referring to Table 5, the following points may be noted:
Table 5a Logistic regression of organisations having highly paid staff, and negative binomial model for number (odds ratios and incidence rates respectively)
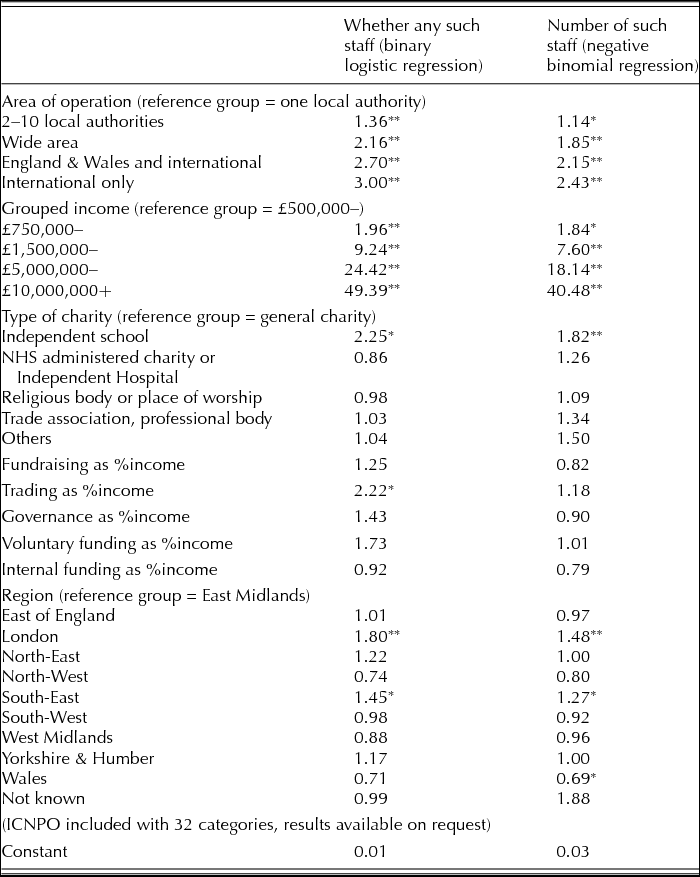
Notes: The results are robust to the removal of cases with high ‘leverage’ that might potentially affect regression results. The results are also robust to dropping cases that are from higher education or from hospitals, which have a high incidence of higher-paid staff. All results run using survey software, taking account of sampling weights and stratification.
** = significant at the 1% level, * = sig at 5% level. Number of obs = 9,419.
Source: TSRC/NCVO sample of charity accounts.
Table 5b Independent variables, distribution in the estimation sample (N = 9,421)
Source: TSRC/NCVO sample of charity accounts.
Clearly, the most important variables here were related to size, both the overall income of the charity – consistent with Table 2, the proportion paying such salaries rose substantially with income – and the number of paid employees. Moreover, charities involved in any kind of international work were more likely to be paying higher salaries than charities operating on a national or regional basis, which in turn were more likely to have higher-paid staff than those working within one or a small number of local authorities. This is independent of the size of income, and suggests a strong association between the complexity of an organisation and remuneration. Not only are such organisations larger, the fact that they are operating across countries and continents means that their activities are inherently more complex and, in the case of international organisations, they must also operate with due regard to local political circumstances.
We also note a regional effect. Charities based in London, or in the South-East outside of London, were more likely to pay high salaries. This is likely to reflect the presence of many headquarters of national or international charitable organisations, and also the generally competitive labour market in those regions. This mirrors the findings from the survey analysis, based on the location of employees. The proportion of income coming from trading activities – which will include sales of services, such as the purchase of education or health care to individuals – also tended to be associated with the presence of highly paid staff, and the number of them within organisations.
Conclusions
The proportion of employees in the charitable sector who are in receipt of salaries above £60,000 is clearly lower than in the public or private sectors. We see this pattern clearly in bivariate tables and it is demonstrated even more strongly in multivariate analyses. This conclusion is drawn from national survey data, and is confirmed by information from charity reports and accounts. At most, some 3 per cent of paid staff in charities received such salaries but this estimate from surveys of individuals is based on fewer than 100 respondents (see Table 1). Where we have direct reports of salaries in charity accounts, we are able to estimate that approximately 11,600 people in charities which have incomes in excess of £500,000 receive such salaries. This is approximately 1.3 per cent of total employment in charities in England and Wales – and since there are some estimates which suggest that previous work has underestimated employment in the third sector, that proportion itself may be an overestimate. This clearly indicates that – while there may be a debate about individual salaries at particular organisations – there cannot be a widespread problem of high salaries in the charitable sector.
How do we account for the distribution of high salaries across organisations? The size and complexity of the organisation is key here. The proportion of organisations paying salaries of £60,000 or more is strongly associated with charity income and measures of organisational complexity such as scale of operation and numbers of employees. This is broadly consistent with what we would expect based on previous literature in the field.
When we seek to account for the numbers of highly paid staff – as opposed to the distribution of organisations paying at least one person more than the threshold value of £60,000 – we find that most employees in receipt of such salaries are in fields such as health care. However, the organisational characteristics that are associated with those numbers are very similar to those features associated with the likelihood of paying anyone such salaries.
Where does this evidence leave the debate about salary levels in charities? As stated above, there was a Parliamentary inquiry on the subject, but fewer than twenty evidence submissions were made (Public Administration Select Committee, 2013). Aside from defences of the complexity of individual organisations and explanations of the considerations they had taken into account when setting salaries, the proposals put forward by these submissions generally amounted to little more than good practice recommendations to the trustees of charities in relation to the criteria they should take account in benchmarking senior staff salaries against comparators. Some charities made reference to pay multiples, e.g. that the salary of the chief executive should not be more than 4 times that of the median salary (itself rather narrower than the suggestion of the inquiry chaired by Will Hutton (Reference Hutton2011) of a 10:1 ratio in public bodies, itself later abandoned). Others suggested that the paramount consideration was the impact of the charity and its activities, and that appropriate salaries were required in order to maximise that impact. There was no enthusiasm for salary caps of some kind, such as pegging senior salaries to those of MPs. Nor were there proposals to set an overall limit on the proportion of charitable resources that could be absorbed by senior salaries. Our calculations (not shown here) indicate that these would release marginal amounts of resource for charities while most likely rendering the attraction and retention of staff more difficult. Whatever the Committee's views of the evidence, the issue was quietly dropped: no report was published about the findings of the inquiry, though the reasons for non-publication are not known. Mechanisms used to determine rewards in other fields – such as Pay Review Bodies, as used for groups such as doctors or the armed forces – would seem unlikely to find favour in the charitable world, given its heterogeneity. Others recommend approaches that limit executive pay in the interests of reducing inequality (e.g. McKnight et al., Reference McKnight, Duque and Rucci2016), but the rarity of very high salaries in charities means that such measures would not have much affect on overall inequality. At most, we can expect variants of good practice guidance, such as the ‘good pay guide’ that has been produced recently by the Association of Chief Executives of Voluntary Organisations (ACEVO, 2013). This identified five principles of decision-making around senior staff pay – transparency, proportionality, performance, recruitment and retention, and process – but ACEVO is a membership organisation, which has no statutory powers.
There are some limitations to this study, particularly if efforts are to be made at comparisons with other countries. Further research is certainly needed into the wider non-profit sector. These figures underestimate the total numbers of employees in the non-profit sector who receive high salaries because our sources do not allow us to include universities in a systematic way. Though charitable, these organisations are not required to report to the Charity Commission in England because they are regulated by HEFCE. With professorial salary bands now starting in the region of £60,000 at most universities, inclusion of such institutions and their staff would add several thousand highly paid employees to the numbers, and this would be particularly important if international comparisons were being made.
We can only make our estimates because of the transparency provided by Charity Commission reporting. Other third sector organisations taking a non-profit legal form (Company Limited by Guarantee, Community Interest Company, Industrial and Provident Society) are not required to disclose this information so we are unable to make systematic estimates of numbers of highly paid employees in these subsets of the non-profit population. Given the current policy priority accorded to third sector delivery of public services, for example, it would be ironic if one outcome were to be salary levels in mutual and social enterprises that were comparable with public or private sector counterparts. For now, however, we can conclude that the third sector is not generally characterised by high salaries, that senior salaries in the third sector generally lag behind the private sector, and that the variation within the charitable sector is largely explicable by reference to the scale and complexity of charitable organisations themselves.
Acknowledgements
We thank the UK Data Service for supplying data from the Annual Population Survey, which was collected by the Office for National Statistics (ONS, 2013). Such data are crown copyright material and results are reproduced with the permission of the Controller of HMSO and the Queen's Printer for Scotland. Any errors or omissions are the responsibility of the authors.
Data from the accounts of registered charities are captured by the Centre for Data Digitisation and Analysis (Queen's University, Belfast). We acknowledge their work, and also that of our partners in this data entry operation, the National Council of Voluntary Organisations, particularly David Kane and Pete Bass. We refer to this in the text as the “TSRC / NCVO sample of charity accounts” and the data are deposited at the UK Data Service (available at http://reshare.ukdataservice.ac.uk/850933/)
The support of the Economic and Social Research Council (ESRC), the Office for Civil Society, and the Barrow Cadbury UK Trust, who funded the work of the Third Sector Research Centre (www.tsrc.ac.uk; RCUK project reference ES/G028877/1), is gratefully acknowledged.


 Open access