


Introduction
Peste des petits ruminants virus (PPRV, family Paramyxoviridae, genus Morbillivirus) causes a contagious disease of high morbidity and mortality in sheep, goat and other small ruminant populations. Estimated mortality varies widely in the literature from <10% to as high as 90% in naïve herds [1, Reference Munir2], but typically is reported between 50% and 80% [Reference Munir2]. The virus is spread by direct contact with infected hosts, aerosols, or fomites [Reference Munir2]; however, the infection can be prevented through vaccination [Reference Kumar3]. First discovered in 1942 in Cote d'Ivoire [Reference Munir2], PPRV now has a broad geographic range and has been reported in over 70 countries in Africa, the Middle East and Asia. The Food and Agricultural Organization (FAO) estimates that PPRV threatens nearly 80% of the global small ruminant population and impacts the livelihood of over 330 million farmers who rely on small ruminant husbandry [4]. Low-income households can more easily afford small ruminants so the impact of PPRV on global opportunity for those in poverty is large. FAO estimates that PPRV causes approximately $1.45–2.1 billion USD in global annual losses, with half of these losses impacting Africa and a quarter affecting Asia [4]. These economic losses are due to livestock mortality, impaired production and treatment and vaccination of morbid animals. Cost-benefit analyses estimate the net benefit of PPRV eradication at $74.2 billion USD and a benefit-cost ratio of 33.8, based on a 15-year program [Reference Jones5].
Given its socio-economic importance and the availability of a vaccine that provides demonstrated protection up to 3 years [Reference Zahur6], PPRV is an attractive target for eradication. In 2015, the FAO launched a global campaign to eradicate PPRV by 2030 [4, 7]. However, questions remain about specific ecological mechanisms driving PPRV transmission [Reference Baron8], including which risk factors and management systems are important for transmission and whether there are additional, unidentified domestic or wildlife reservoir hosts for PPRV. Given the historically high prevalence of the related rinderpest virus, PPRV has classically been thought of as a disease of small ruminants so cattle have not been routinely sampled during PPRV investigations under the presumption that they are not a competent host. However, there is mounting evidence that cattle can be infected and seroconvert [Reference Abraham9–Reference Abubakar23], but to our knowledge, there have been no studies in which the exposure of sheep, goats and cattle have been investigated simultaneously to look for correlated epidemiologies. Furthermore, while there is increasing evidence of the importance of differing management (production) practices on PPRV transmission [Reference Kivaria24–Reference Salih26], these have not been explored in detail for PPRV among sheep, goats and cattle managed together.
To fill these gaps we conducted a cross-sectional serosurvey of sheep, goats and cattle managed together in the same households under differing production systems across 20 villages in northern Tanzania. In Tanzania, the first report of PPRV came from the northern border in late 2008. Within 2 years infection spread southward along known animal trade routes and PPRV is now present throughout the country [Reference Kivaria24]. Large-scale serosurveys conducted during 2008–2011 estimated PPRV seroprevalence to be 22%–45.8% in small ruminants in various regions of Tanzania [Reference Kivaria24, Reference Swai25, Reference Muse27, Reference Mbyuzi28]. Government-led PPRV vaccination campaigns targeting sheep and goats were conducted in 2009–2011 in northern and southern districts and along livestock marketing routes and again in 2013 near Mikumi National Park, central Tanzania (Roos, 2016, unpublished MSc). However, no other major control efforts have occurred and PPRV is believed to be endemic across the majority of Tanzania.
Historically, cross-reactivity with rinderpest virus (RPV) has been a challenge for assessing PPRV seroprevalence during serosurveys, but this is no longer a significant concern as RPV was eliminated and vaccination ceased in Tanzania in 1997–1998 [29] and RPV was declared globally eradicated in 2011 [30]. Any small ruminant populations in Tanzania that may have been exposed to RPV infection have since been replaced (based on an average lifespan of approximately 1–3 years [Reference Kivaria24]) and although cattle are longer lived, only Tanzanian cattle 17 years or older in our study would have received a RPV vaccination. Thus, the current status and distribution of PPRV in Tanzania among sheep, goats and cattle can be clarified through serology. In this study, we address the following research aims: (i) to describe the current distribution of PPRV seroprevalence and the force of infection (per capita rate of infection) in northern Tanzania, (ii) to identify risk factors associated with PPRV seroprevalence and (iii) to determine if PPRV risk is correlated among sheep, goats and cattle.
Methods
Blood samples were collected from February to November 2016 from clinically healthy sheep, goats and cattle in 20 northern Tanzanian villages in Arusha and Manyara Regions as part of the Social, Economic and Environmental Drivers of Zoonoses (SEEDZ) study which originally sought to investigate brucellosis infection. A total of 7576 animals from 417 households were sampled and 404 household surveys were conducted. The sample size was based on the assumption of 40% within herd brucellosis prevalence and type 1 and 2 errors of 10%. Using multistage sampling, study villages were randomly selected from a spatially referenced list of 1012 villages (2012 national census, Tanzanian National Bureau of Statistics) using a generalised random tessellation stratified sampling (GRTS) approach. This provides a spatially balanced, probability-based sample [Reference Stevens and Olsen31, Reference Stevens and Olsen32]. Prior to selection, all villages in the study area were classified according to dominant livelihood type by local experts (District Veterinary or Livestock Officers). ‘Pastoral’ (P) villages were those in which livestock rearing, rather than crop agriculture, was considered to be the primary livelihood activity while ‘agropastoral’ (AP) were those villages in which a mix of crop and livestock were important. The GRTS procedure was stratified to select nine villages classified as agropastoral and 11 villages classified as pastoral (Fig. 1). Study villages comprised between two and four sub-villages, from which two or three were selected for inclusion in the study. The availability of animal restraint (livestock crush) was considered; otherwise, sub-village selection was random. Within each sub-village, a ‘central point’ sampling approach was adopted, in which livestock keepers were invited to bring their animals to a pre-selected point within the sub-village, such as a livestock crush or dip tank. The invitation included a 3-day advance notice to the sub-village chairperson and a meeting with the sub-village chairperson and as many compound leaders as possible 24 h before the event. These leaders notified livestock keepers of the event and encouraged as many herds as possible to attend and advised them to bring animals of all ages and both sexes. During the sampling event, a list of all attending households was generated and a maximum of 10 households was selected using a random number generator. A maximum of 10 cattle, 10 sheep and 10 goats was randomly selected for sampling from selected households to be able to detect herd level infection (estimated at 40% for the SEEDZ target pathogen, brucellosis). Animals were selected as every Xth animal (e.g. 2nd, 3rd, etc based on a number of animals present) moving through a livestock crush or, if corralled, by selecting at random points throughout the herd. Among cattle, five animals between 6 and 18 months of age and five animals over 18 months of age were selected. Among sheep and goats, five animals between 6 and 12 months of age and five animals over 12 months were selected. At least two of the animals were male in each of the groups and all animals were old enough to be expected to lack maternally derived PPRV immunity [Reference Bodjo33].

Fig. 1. Study villages in northern Tanzania and village management system type. Inset of Tanzania highlights the three regions in main figure.
Animal age was assessed by dentition, namely incisor tooth eruption and wear (Fig. 2). This age estimation method was used because the exact recorded ages were not available. Maximum age cut-offs for sheep and goat age categories were: 1, 1.5, 2, 3, 5 and 5 + years [Reference Mitchell34, Reference Casburn35] and for cattle: 1.5, 2.5, 3.5, 4.5, 6 and 6 + years [Reference Turton36]. Among samples containing complete species, sex, age and location data, we tested a total of 7538 serum samples in duplicate using a commercial competitive ELISA kit (Pirbright Institute, Surrey, England) directed against the hemagglutinin protein of PPRV [Reference Anderson, McKay and Butcher37, Reference Couacy-Hymann38]. Samples had been heat inactivated (56°C, 2 h) prior to shipment to the University of Glasgow for testing. We removed 42 samples (0.6% of total) from the analysis that were from households that self-reported PPRV vaccination in the past 24 months. However, we retained 427 samples (5.7% of total) that lacked a household survey from which to discern self-reported PPRV vaccination as the exclusion of these samples from analysis yielded qualitatively and quantitatively similar results. Our final analysis sample included 7496 animals, representing 2080 sheep, 2419 goats, 2997 cattle.
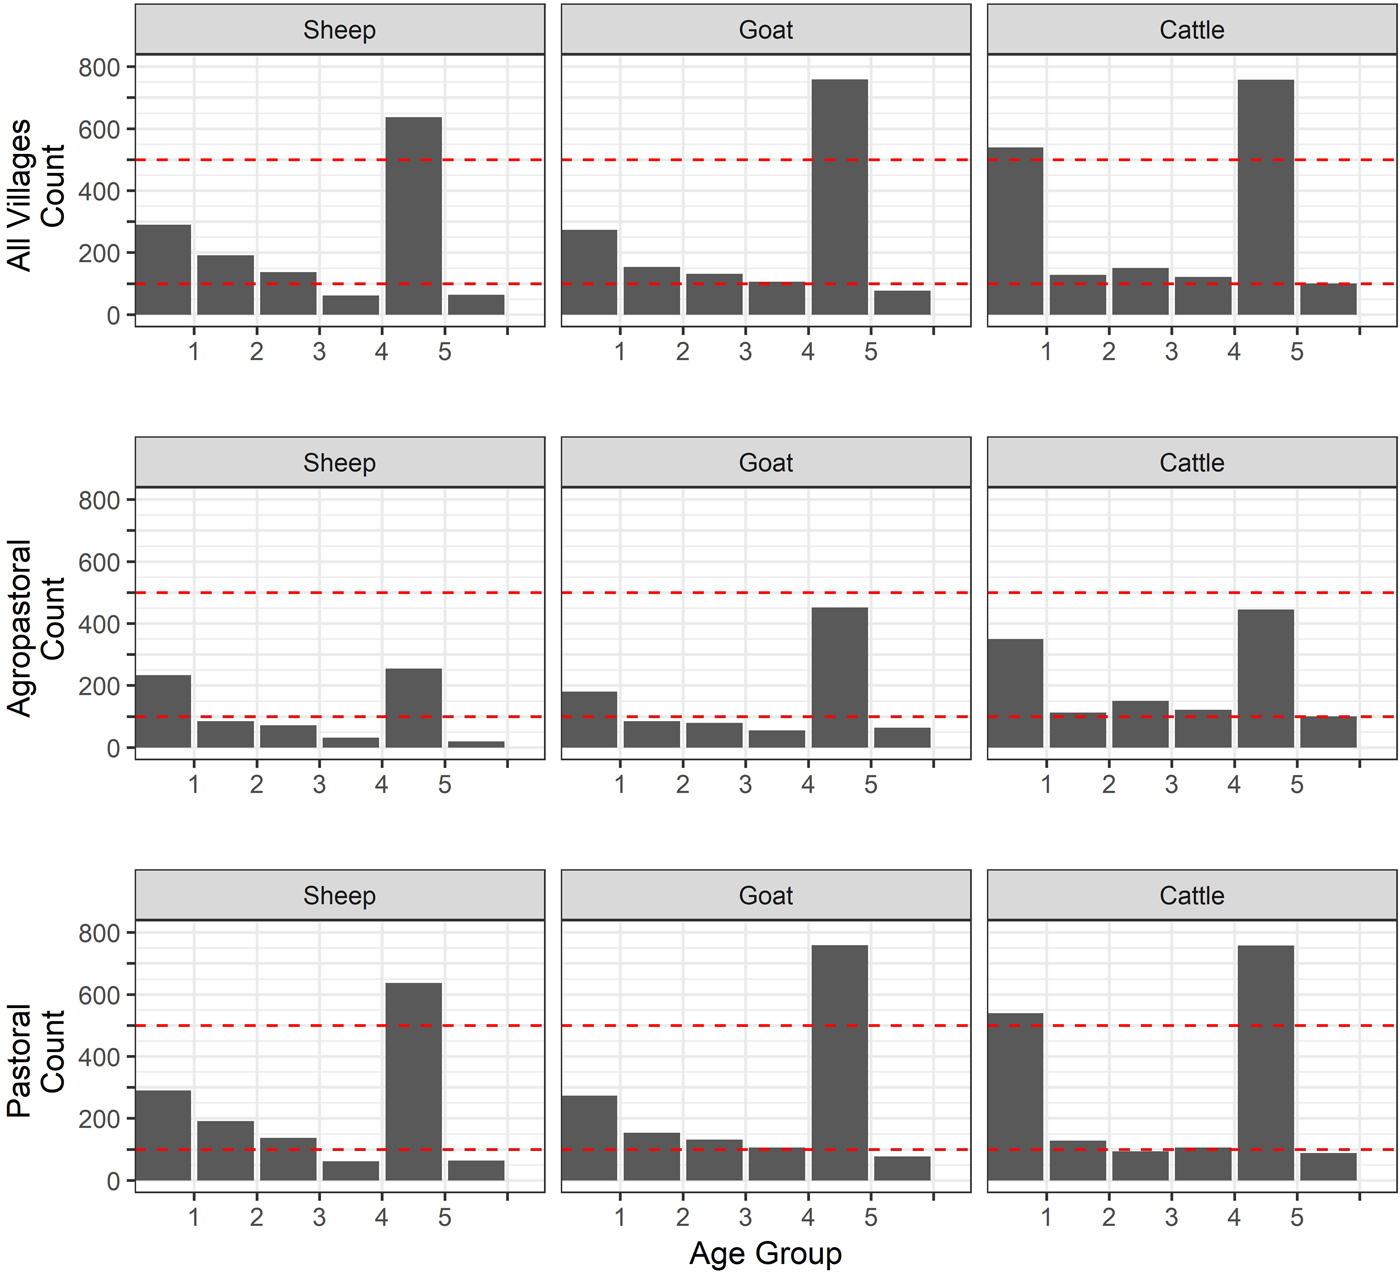
Fig. 2. Age distribution of sheep, goats and cattle. Age was measured in the animals by dentition (age group 1 = temporary teeth, 2 = one pair, 3 = two pair, 4 = three pair, 5 = 4 pair, 6 = full and worn (over 5 years old). Dashed lines are included for comparison and all set at 100 and 500.
To explore the characteristics of PPRV transmission in greater detail, we calculated the basic reproductive ratio (R0) and the force of infection (FOI). Since PPRV is fully immunizing (i.e. natural infection elicits an immune response detectable for the lifespan of the animal), we calculate R0 according to R0 = 1/seronegatives for each species, management system and village under the assumptions of endemic equilibrium, random mixing and that seronegatives are fully susceptible [Reference Anderson and May39]. We calculated the FOI, the rate of infection of susceptible hosts, using the catalytic framework [Reference Hens40]. The catalytic model provides the framework for calculating the FOI from age-specific seroprevalence data from cross-sectional surveys [Reference Hens40–Reference Muench42]. Given that the rate at which immunity builds up with age depends on rates of circulation, this approach allows us both to elucidate the rate of circulation (FOI, λ) and to determine which age classes are most important for continued transmission. According to the catalytic model, age-specific seroprevalence, P(a), can be expressed as:
where (1-P(a)) is the proportion of susceptible hosts of age a and λ(a) is the age-specific FOI. Integrating and rearranging yields
which describes how the cumulative FOI up to a given age will deplete a susceptible cohort, where P(a) represents the probability of having been infected before age a. Age-specific seroprevalence curves are direct empirical observations on this probability.
For this study, we are primarily interested in contrasting PPRV circulation among species and between management systems; therefore, we make the simplifying assumption of a constant FOI across ages. This assumption averages across age-specific heterogeneities and allows us to simultaneously estimate the FOI and explore the significance of risk factors on PPRV circulation. With a constant FOI, equation (2) simplifies to:
which upon rearrangement corresponds to the expectation of a binomial generalised linear model with a complementary log-log link:

In (4), the intercept, log(ϕ), represents an estimate of the log FOI as long as we use log(a) as a regression offset (i.e. has a regression coefficient fixed at unity). We applied this approach to a combined, all-species model with species as a fixed effect as well as to each of three individual-species models. We used sex and management system type as additional covariates. We used village as a random effect to explore spatial covariation in the PPRV risk among species. The effect of interactions (species × management type, sex × management type, sex × species) were also explored (Table S1). We identified the best fitting all-species model and individual-species models using the Akaike Information Criterion [Reference Akaike43]. For the all-species model, the reference group was a male cow in an agropastoral system. We calculated the village-level random effects from individual-species generalised linear mixed models using the lme4 package. Spatial variation in FOI rates and correlations in FOI between pairs of species were investigated via the random effects. Spatial autocorrelation in FOI was tested for using Moran's I statistic. All analyses were conducted in R version 3.5.3 [44].
All participants provided written informed consent or assent. Questionnaires collected household demographic and socio-economic information, assessed knowledge about common practices for livestock management and disease and documented animal movement in the region. In this study, the questionnaires were used solely to determine the PPRV vaccination status of household herds in the past 12 months. The protocols, questionnaire and consent/assent procedures were approved by the following ethical review committees: Kilimanjaro Christian Medical Centre (KCMC/832) and National Institute of Medical Research (NIMR/2028) in Tanzania; College of Medical, Veterinary and Life Sciences, University of Glasgow in the UK. Approval for animal work was provided by the Clinical Research Ethics Committee at the University of Glasgow School of Veterinary Medicine (39a/15).
Results
Demographic characteristics of the 7496 samples analysed are presented in Table 1. In this section, ranges indicate 95% exact confidence intervals. The overall observed PPRV seroprevalence was 21.1% (20.1%–22.0%). Seroprevalence was 26.2% in sheep (24.3%–28.1%), 28.8% in goats (27.0%–30.6%) and 11.3% in cattle (10.2%–12.5%). There was significant variation within specific management systems: 0.8%–20.6% in agropastoral (AP) systems (overall AP: 5.8%, 5.0%–6.7%) and 3.3%–47.2% in pastoral (P) villages (overall P: 30.7%, 29.3%–32.0%) (Fig. 3, Fig. S1). Additionally, within each species, seroprevalence varied significantly by management system type (sheep AP: 6.0%, P: 36.4%; goats AP: 7.0%, P: 42.1%; cattle AP: 4.9%, P: 16.1%).
Table 1. Sample population characteristics
a Age groups by dentition correspond to approximately the following ages in cattle: temporary teeth: 1 month to 1.5 years; 1 pair: 1.5–2.5 years; 2 pair: 2.5–3.5 years, 3 pair: 3.5–4.5 years, 4 pair: 4.5–7 years; full + worn: above 7 years. For sheep and goats: temporary teeth: <1 year; 1 pair: 1–1.5 years; 2 pair: 1.5–2 years, 3 pair: 2–3 years, 4 pair: 3–5 years; full + worn: above 5 years.
b Denominators for the villages were the n of the corresponding management system type.
CI, confidence interval.
Fig. 3. Variation in village PPRV seroprevalence by species and management type. Agro = Agropastoral, Past = Pastoral.
Based on seroprevalence, reproductive number estimates were 1.36 (1.32–1.39), 1.40 (1.37–1.44) and 1.13 (1.11–1.14) for sheep, goats and cattle, respectively. Stratified by management system, we see higher R0 values for each species in the pastoral management systems: sheep AP: 1.06 (1.05–1.09), P: 1.57 (1.51–1.64); goats AP: 1.08 (1.06–1.10), P: 1.73 (1.65–1.81); cattle AP: 1.05 (1.04–1.07), P: 1.19 (1.17–1.22). At a village level, R0 estimates range from 1.00 to 2.77 for sheep, 1.00–3.18 for goats and 1.00–1.53 for cattle, with 1, 4 and 2 villages (out of 20) having a result of 1.00 in each species, respectively. These estimates are at or above the threshold for invasion but are likely to be underestimated as they have not been corrected for infection-associated mortality and PPR is known to cause high mortality in small ruminants (but not in cattle). Although our study lacked case fatality data (sampled animals were clinically healthy), one can calculate plausible biases introduced by infection-associated mortality. For example, for a 50% case mortality rate, one would expect R0 to be underestimated by 25%–45% depending on the true value of R0 (between 2 and 10) using the 1/seronegatives calculation. The bias results because infection killed animals are not present among the seropositives.
For the best fitting all-species model containing one interaction (species:management, see Table S1), sex, management and the species:management interaction were significant, with the change in management system exhibiting the strongest hazard ratio (HR: 3.8, 1.4–10.3) (Table 2). The species:management interaction is implicit in the individual-species models that the rest of our results are based on. In individual-species models, the hazard ratio of seroconversion between pastoral and agropastoral systems was 9.4 for sheep (3.6–24.55), 9.5 for goats (3.1–29.4) and 4.0 for cattle (1.6–10.1) (Table 2).
Table 2. Generalised linear mixed model results for all-species and individual-species models
HR, hazard ratio estimate.
a Reference group: male cattle in an agropastoral system. See Table S1 for interaction (species:management) selection.
b Wald confidence interval.
Spatial variation in FOI is presented in Figure 4. There was significant spatial autocorrelation in village-level FOI for goats and cattle but not for sheep. Spatial FOI were strongly correlated among species (Fig. 5) after adjustment for sex and management system and showed a significant positive association (P < 0.001) between each pair of species: goats and sheep (R2: 0.71), sheep and cattle (R2: 0.68) and goats and cattle (R2: 0.61). This pattern is consistent with similar within-village transmission rates between each species and the presence of either cross-species transmission and/or common, external risk factors affecting all species.
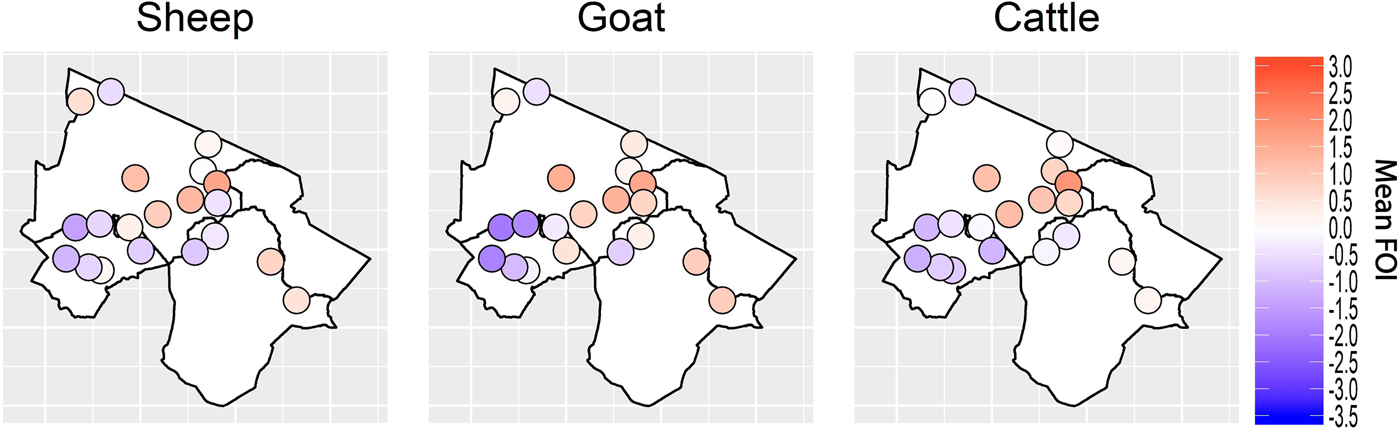
Fig. 4. Spatial variation in village-level standardised force of infection (FOI) estimates. Blue colouring indicates a village FOI that was lower than the mean FOI (standardised to zero) and red colouring indicates a village FOI that was higher than the standardised mean FOI. There was strong evidence of spatial autocorrelation (Moran's I) in FOI for goats and cattle (P < 0.001) but weak evidence in sheep (P = 0.08).

Fig. 5. Village-level standardised force of infection (FOI) estimates by species pairs. Mean FOI is standardised to zero and is in middle of both axes. Where the village FOI was higher or lower than the mean FOI for one species, it was also higher or lower than the mean for the second species plotted. All correlations are significant (P < 0.001).
Discussion
Our study has (i) described the current distribution of PPRV seroprevalence and force of infection (FOI) among sheep, goats and cattle in northern Tanzania, (ii) identified management system and sex (overall in sheep and goats) as significant risk factors for PPRV seroprevalence and (iii) provided evidence of transmission patterns among sheep, goats and cattle consistent with cross-species circulation. PPRV seropositivity was found in all species but was higher in small ruminants than in cattle, higher in females than males and increased across dentition-based age groups as would be expected with a fully immunizing infection and consistent with an endemic pattern of circulation. PPRV exposure was widespread and varied across the northern Tanzanian landscape and seroprevalence was significantly higher for all three species under pastoral management than under agropastoral management. Significant spatial autocorrelation in FOI after controlling for sex and management system was seen in cattle and goats, but not in sheep, suggesting other landscape effects (market proximity and attendance, veterinary service access) may impact PPRV seroprevalence. Lastly, our study found a significant positive association in the spatial variation in FOI between each pair of species suggesting cross-species transmission is occurring in sheep, goats and cattle and/or that common external forces are affecting transmission within each species. Given the multi-host aetiology seen with other morbilliviruses, such as canine distemper [Reference Craft45] and phocine distemper viruses [Reference Jo, Osterhaus and Ludlow46], the former explanation is an interesting hypothesis for future study.
Our finding that management system type has a significant effect on PPRV seroprevalence parallels previous findings, as does our find that sex (in sheep and goats) has a significant effect (Supplementary Text). In Tanzania, Kivaria et al. [Reference Kivaria24] and Swai et al. [Reference Swai25] reported a significant effect of pastoral management systems (odds ratios: 3.56 (95% CI 3.02–4.21) and 2.08 (95% CI 1.55–2.78), respectively). Beyond Tanzania, pastoral management systems have also been associated with an increased risk of PPRV transmission in Ethiopia and Sudan ([Reference Salih26], Dejene 2016 unpublished MSc). Density dependence in PPRV transmission remains to be investigated and herd size may be a contributor to the difference in PPRV infection hazard between management system types as pastoral herds are generally larger than agropastoral herds. Additionally, management type variation should be investigated at finer geographic scales. If household-level management classification were available it may be possible to correlate household specific management practices obtained by questionnaire to variation in PPRV transmission risk within the classification. Additionally, pastoral livelihoods are changing, with crop cultivation, migration and wage jobs on the rise among the Masaai in northern Tanzania [Reference McCabe47]; thus, getting a finer view of household practices is essential. Variation in herd size, age structure, mixing patterns (grazing, confinement, watering, migration practices), acquisition rates and sources of new stock, wildlife exposure and access to veterinary services of herds in each management system should be explored. Opportunities exist for increasing veterinary service provisions that improve access to routine, preventative veterinary care including education (i.e. promotion of changing common production system practices in ways that reduce transmission risk) and vaccination.
Our work adds to a growing literature that has investigated PPRV in cattle. In our investigation, cattle were managed in the same households as the sheep and goats sampled. Our study found an overall cattle seroprevalence of 11.3% (AP: 4.9%, P: 16.1%) which is comparable to the seroprevalence range reported by most other studies that have tested cattle (range: 1.8–18%, n = 24–1158) [Reference Abraham9–Reference Haroun20, Reference Abubakar23] (Kundu 2013, unpublished MSc), save two which reported cattle seroprevalence at 41.9% (n = 43, by our calculations a 95% CI 27.0–57.9) [Reference Khan10] and 42% (n = 1,000, by our calculations a 95% CI 38.9–45.1) [Reference Ali15]. Additionally, experimental infections [Reference Sen21, Reference Dardiri, DeBoer and Hamdy22] have demonstrated that cattle can be infected by PPRV via inoculation or contact with infected small ruminants. Cattle are thought to be a less competent host for PPRV; however, it is not known if cattle are able to transmit PPRV or whether infections are merely spillovers from small ruminants. This is an area where carefully controlled experimental studies are needed. Prior to RPV eradication, it is possible that PPRV was blocked in cattle due to cross-immunity between the viruses [Reference Couacy-Hymann, Bodjo and Danho48–Reference Couacy-Hymann51]. Post RPV eradication, PPRV may have further adapted to cattle. It is possible that PPRV spillover from cattle to small ruminants may be an additional route of transmission that is currently present or may develop as PPRV adapts to the vacated niche left by RPV [Reference Baron8, Reference Lloyd-Smith52]. Our analysis of village-level FOI adds support to several alternative hypotheses regarding cattle transmission: (i) that cross-species PPRV transmission is occurring among sheep, goats and cattle, (ii) that independent, within-species chains of transmission are enhanced or reduced by common external factor(s) affecting all species, or (iii) both are occurring. Additionally, to resolve the role of cattle in PPRV transmission (and the directionality of transmission), longitudinal field investigations of viral excretion, strain characterisation by species and species contact patterns by management system should be pursued in multi-species herds.
Our study methods assumed PPRV endemicity in Tanzania. Our results showed a pattern of increasing seroprevalence with age, which is consistent with an endemic infection pattern in that individuals' cumulative exposure increases with age. Given that PPRV has arrived in Tanzania relatively recently, future studies with increased temporal and geographic granularity may be able to confirm PPRV endemicity in Tanzania or resolve areas where PPRV is still epidemic. Cross-sectional analyses such as ours cannot distinguish stable endemicity from recurrent epidemics, but statistical investigations into the impact of epidemics on FOI and R0 estimates for mumps and rubella derived from serological data have demonstrated that they remain mostly insensitive to regular epidemic cycles [Reference Whitaker and Farrington53]. Furthermore, the authors expected the same conclusions for irregular epidemics with a period less than the average age of infection. We expect these results to be generalisable to PPRV; hence, we believe that our assumption of endemicity is a reasonable first approximation in this analysis.
Our model purposely assumed an age-invariant FOI to enable us to simultaneously estimate the FOI and explore the significance of risk factors on PPRV circulation in different host species. However, FOI may vary by age. Using an age-varying FOI model (e.g. piecewise-constant model) could identify which age cohorts experience the highest burden of PPRV circulation and is the subject of our future research. The results from an age-varying model could also better inform hypotheses about the mechanisms driving the significant difference that our study and several other studies (Supplementary Text) saw by sex: namely, females had significantly higher seroprevalence than males. For example, an age-varying model may reveal that females experience higher FOI during peak reproductive ages. If so, this could be due to biological factors, such as increased susceptibility due to immune changes during pregnancy, or social factors, such as mixing more with young animals under a year old who, after losing maternal immunity and prior to vaccination, become infected and pass PPRV to their mothers. Additionally, infection-associated mortality, seasonal susceptible influxes and preferential animal slaughter by a specific species, sex, age, or weight (age proxy) as part of cultural or religious festivals may impact dynamic patterns and be revealed by this model.
Our study did not collect animal contact data and assumed homogenous mixing among animals. This is likely a plausible first approximation as herds are often grazed and watered together during the day and although adult cattle are often separated from sheep and goats at night, calves are not. Study animals were kept in the areas they were sampled in but may have originated elsewhere. Detailed studies of contact patterns and trade movements in various production systems are needed to specify alternate mixing patterns and improve epidemiological parameter estimates. Our study sampling methodology strived to reduce selection bias by using random selection at all stages of sampling and stressing that all households in the area should bring all animals for sampling. However, there was evidence that households closer to the sampling point, with larger herd sizes and lower socioeconomic status were more likely to attend (unpublished observation). There may have also been animal selection based on health (e.g. sick or frail animals purposely brought/left at home). Lastly, our work assumes that a positive cELISA result indicates past PPRV infection and current protection and a negative result indicates no past exposure and current susceptibility. Misclassifications would result in underestimation of seroprevalence and our R0 estimates. The BDSL cELISA test in our study has been previously used on Tanzanian cattle and wildlife samples [Reference Lembo16]. With a threshold of 50%, the test demonstrated high specificity; however, sensitivity could be improved for all species [Reference Couacy-Hymann38], especially cattle (possibly by lowering the threshold <50% [Reference Singh54]) and other unusual PPRV hosts such as camels [Reference Abraham9] and wildlife. As the test may be less sensitive in cattle, our seroprevalence results are likely to be underestimated.
Our study has highlighted the importance of the pastoral production system and the need to further investigate the role of cattle in PPRV transmission risk. Resolving the ecological mechanisms driving PPRV transmission will lead to improved prevention strategies and better inform upcoming eradication campaigns.
Supplementary material
The supplementary material for this article can be found at https://doi.org/10.1017/S0950268819001262
The anonymised dataset used in this study will be made available on http://researchdata.gla.ac.uk/
Author ORCIDs
C. M. Herzog, 0000-0003-3021-888X.
Acknowledgements
We thank all members of the SEEDZ field and laboratory team, including Kunda Mnzava, Eurphrasia Mariki, Zanuni Kweka, Rigobert Tarimo, Fadhili Mshana, Mamus Toima, Tauta Maapi, Raymond Mollel, Matayo Lazaro, Ephrasia Hugo, Nelson Amana, Elizabeth Kasagama and Victor Moshi. C. M. H. was supported by the Bill & Melinda Gates Foundation grant ‘Programme For Enhancing the Health and Productivity of Livestock (PEHPL)’ (OPP1083453). Additional funding for this study was provided by the Biotechnology and Biological Sciences Research Council, the Department for International Development, the Economic & Social Research Council, the Medical Research Council, the Natural Environment Research Council and the Defense Science & Technology Laboratory, under the Zoonoses and Emerging Livestock Systems (ZELS) programme (BB/L018926/1).
Conflict of interest
None.


 Open access