


1. Introduction
Recently, several experiments using large data sets of galaxies imaged by several different instruments have shown evidence of non-random distribution of the spin directions of spiral galaxies (Slosar et al. Reference Slosar2009; Longo Reference Longo2011; Shamir Reference Shamir2012, Reference Shamir2013; Hoehn & Shamir Reference Hoehn and Shamir2014; Shamir Reference Shamir2016b, Reference Shamir2017a, Reference Shamir2017b, Reference Shamir2017c; Lee et al. Reference Lee, Pak, Lee and Song2019a, 2019b; Shamir Reference Shamir2019, Reference Shamir2020a, Reference Shamir2020b, Reference Shamir2020c). The asymmetry is reflected by differences in the number of galaxies with opposite spin directions (Shamir Reference Shamir2012, Reference Shamir2019, Reference Shamir2020c, 2019b), and it changes with the directions of observation (Shamir Reference Shamir2012) and the redshift (Shamir Reference Shamir2016a, Reference Shamir2019, Reference Shamir2020c). Other experiments showed differences in the brightness of the galaxies (Shamir Reference Shamir2016b, Reference Shamir2017a).
Early experiments used galaxies annotated manually by a large number of volunteers showed no statistically significant difference between the number of galaxies with opposite spin directions (Land et al. Reference Land2008). However, it was also found that volunteers annotating the same galaxies tended to classify elliptical galaxies with no apparent spin direction as spiral galaxies that spin clockwise, and therefore leading to a difference in the number of galaxies (Hayes, Davis, & Silva Reference Hayes, Davis and Silva2017). Another experiment that used manual analysis of the data was based on five undergraduate students annotating  $\sim1.5\cdot10^4$ galaxies. In that experiment, the galaxies were also mirrored in an attempt to correct for a possible human bias, and the results showed a difference of $\sim$7% between the number of clockwise and counterclockwise galaxies (Longo Reference Longo2011).
With the availability of very large astronomical databases, the ability to automate the annotation of the spin directions of spiral galaxies allowed to annotate far larger data sets. These large data sets of galaxies annotated by their spin direction can provide strong statistical signal and profile a possible asymmetry between galaxies with opposite spin directions. It should be noted that the advantage of eliminating the human perception bias is compromised when using machine learning for the annotation, since machine learning algorithms are based on ‘ground truth’ training data that are annotated manually, and the trained model can therefore still be biased by the data it were trained with.
By using model-driven automatic annotation algorithms (Shamir Reference Shamir2011b), large data sets of galaxies showed asymmetry between the number of galaxies with opposite spin directions and the asymmetry direction and magnitude change based on the direction of observation (Shamir Reference Shamir2012, Reference Shamir2019, Reference Shamir2020b, Reference Shamir2020c) and the redshift (Shamir Reference Shamir2016a, Reference Shamir2019, Reference Shamir2020c). The asymmetry was identified in data collected by the Sloan Digital Sky Survey (Shamir Reference Shamir2012, Reference Shamir2016b) and showed good agreement with the asymmetry identified in data collected by the Panoramic Survey Telescope and Rapid Response System (Shamir Reference Shamir2017a, Reference Shamir2020a, Reference Shamir2020c).
Experiments with smaller data sets annotated manually also showed patterns of spin directions of galaxies (Slosar et al. Reference Slosar2009), and alignment of spin directions was identified with quasars (Hutsemékers et al. Reference Hutsemékers, Braibant, Pelgrims and Sluse2014). More recently, consistency in spin directions was also observed with galaxies that are too distant from each other to have any kind of gravitational interactions (Lee et al. Reference Lee, Pak, Song, Lee, Kim and Jeong2019b). These links are defined as ‘mysterious’, leading to the assumption of a link between galaxy rotation and the motion of the large-scale structure (Lee et al. Reference Lee, Pak, Song, Lee, Kim and Jeong2019b).
This paper shows an analysis of the asymmetry between galaxies with opposite spin directions observed when using spiral galaxies from different parts of the sky. The main data set used in this study is taken from HST, and the asymmetry in that data set is compared to the asymmetry in a galaxy data set from SDSS used in previous experiments (Shamir Reference Shamir2019, Reference Shamir2020c).
2. Data
The data set of spiral galaxies was taken from the Cosmic Assembly Near-infrared Deep Extragalactic Legacy Survey (Grogin et al. Reference Grogin2011; Koekemoer et al. Reference Koekemoer2011). The initial data set contained 114 529 galaxies taken from the Great Observatories Origins Deep Survey North (GOODS-N), the Great Observatories Origins Deep Survey South (GOODS-S), the Ultra Deep Survey (UDS), the Extended Groth Strip (EGS), and the Cosmic Evolution Survey (COSMOS) fields. The galaxy images were separated from the F814W band FITS images using the mSubimage tool included in the Montage package (Berriman et al. Reference Berriman2004) and were converted into 122 $\times$122 TIF (Tagged Image File) images.
The separation of the galaxies into galaxies with clockwise and counterclockwise spin directions was done manually. In previous experiments, automatic analysis was used (Shamir Reference Shamir2013, Reference Shamir2017b, Reference Shamir2019, Reference Shamir2020c). However, while model-driven automatic analysis is unbiased and capable of analysing very large databases, it is limited by its ability to classify all galaxies. Therefore, the spin direction of many galaxies cannot be determined, and these galaxies are excluded from the analysis. In sky surveys such as SDSS, the number of galaxies is high, and therefore sacrificing some of the galaxies still leaves a sufficient number of accurately annotated galaxies and does not affect the analysis as long as the algorithm is fully symmetric. However, the HST fields are far smaller than sky surveys such as SDSS, and sacrificing some of the galaxies can reduce the number of galaxies in the data set. Another reason for using manual annotation is to use an accurate method that is different from the methods used in previous experiments.
The annotation was done by first randomly mirroring half of the images and then identifying all galaxies with clockwise spin direction and separating them from the rest of the galaxies. Then, all galaxy images were mirrored, and the clockwise galaxies were again separated from the rest of the galaxies. Each of these two data sets was then inspected to ensure that all galaxies are classified correctly. In the end of the process, 200 galaxies with clockwise spin direction, 200 galaxies with counterclockwise spin direction, and 200 galaxies that their spin direction could not be determined were inspected carefully. The examination showed that all 600 galaxies were annotated correctly. That provided a very clean data set that is also symmetric in the annotations of the galaxies due to the random mirroring and the identification of just clockwise galaxies. But unlike previous data sets, it is also complete in the sense that all galaxies that their spin direction could be determined are indeed annotated. The process was labour-intensive and required  $\sim$250 h of work to complete. It provided a clean data set of 8 690 galaxies with identifiable spin direction. The distribution of the galaxies in the different fields is summarised in Table 1. The Subaru g magnitude and the photometric redshift distribution of these galaxies are shown in Figure 1.
Table 1. The number of galaxies in each of the five fields.


Figure 1. The redshift and g magnitude distribution of the HST galaxies.
The distribution of spin directions in the HST galaxies was compared to data sets of SDSS and Pan-STARRS galaxies that were used in previous experiments (Shamir Reference Shamir2017c, Reference Shamir2017b, Reference Shamir2019, Reference Shamir2020c). These data sets were annotated automatically by the Ganalyzer (Shamir Reference Shamir2011b, Reference Shamir2011a) algorithm. Ganalyzer is a model-driven algorithm that is based on clear and defined rules. It is not based on machine learning or deep neural networks, and therefore cannot be biased by the training set or by complex non-intuitive rules typical to machine learning systems. In addition to the theoretical analysis of the algorithm, it also showed empirical evidence obtained by mirroring a large number of galaxy images. Full details about the galaxy annotation method can be found in Shamir (Reference Shamir2017a, Reference Shamir2017b, Reference Shamir2017c, Reference Shamir2020b), and the data set is described in Shamir (Reference Shamir2020c).
3. Results
The distribution of galaxies in HST shows that the number of clockwise galaxies is higher, but the number of galaxies in the different fields is too low to allow statistical analysis. The only exception is the COSMOS field, where the number of galaxies is far higher than in any of the other HST fields used in this study. To compare the asymmetry in that field to galaxies imaged by SDSS and Pan-STARRS, the SDSS and Pan-STARRS galaxies in the 10 $\times10$ degrees around the centre of COSMOS were examined. The reason for using a larger field is because COSMOS is far deeper than SDSS and Pan-STARRS, and therefore SDSS and Pan-STARRS have a much smaller number of galaxies in a field of the same size. The difference between the size of the fields naturally makes the comparison indirect, as the fields being compared are different. But although the fields are not identical, such comparison can provide certain information regarding the agreement between the populations of galaxies in that part of the sky.
Data sets that were used in previous studies were examined, all of them were annotated automatically. These included a data set of SDSS (Shamir Reference Shamir2017b) and a data set of Pan-STARRS objects (Shamir Reference Shamir2020c). Because the data set used in Shamir (Reference Shamir2017b) contained photometric objects of extended sources, some of the photometric measurements were made from photometric objects inside the same extended source. To avoid the presence of duplicate objects, all objects that had another object within 0.01 degrees or less were removed. Detailed information about these data sets and the distribution of redshift and magnitude of the galaxies they contain are described in the relevant papers (Shamir Reference Shamir2017a, Reference Shamir2017b, Reference Shamir2020c).
Table 2 shows the number of galaxies by their spin directions in each of the three instruments. As the table shows, all data sets show a higher number of clockwise galaxies in that field. The statistical significance is not strong in the Pan-STARRS field, as expected due to the lower number of galaxies compared to COSMOS, but these fields do not conflict with the distribution of galaxy population in COSMOS. Assuming equal probability of having clockwise and counterclockwise galaxies, the probability of having that asymmetry in all of these fields is  $2\times0.027\times0.017\times0.06\simeq5\cdot10^{-5}$.
Previous experiments showed evidence of non-random patterns of the asymmetry between the number of galaxies with opposite spin directions in different parts of the sky (Shamir Reference Shamir2012, Reference Shamir2019, Reference Shamir2020c). That was done by identifying the  $(\alpha,\delta)$ at which the asymmetry of the galaxy spin directions had best fit to cosine dependence. The HST data used in this experiment include several different fields in different parts of the sky. That allows to fit the distribution of the spin directions of these galaxies to cosine dependence. Fitting the galaxy spin directions to cosine dependence can indicate whether the galaxy spin directions are aligned in a form of a possible dipole axis and can also provide the statistical significance of such axis.
Table 2. Number of clockwise and counterclockwise galaxies in the COSMOS field and in the  $10^{\rm o}\times10^{\rm o}$ field of SDSS and Pan-STARRS centred around COSMOS. The P value reflects the binomial probability of having asymmetry equal or greater than the observed asymmetry when assuming that a galaxy has 0.5 probability of having clockwise or counterclockwise spin direction. All of these data sets were annotated in an automatic process.

To test the probability that the spin direction asymmetry exhibits a dipole axis, the same method used in (Shamir Reference Shamir2012, Reference Shamir2019, Reference Shamir2020c) was applied. Each galaxy was assigned with a value within the set  $\{-1,1\}$. Galaxies with clockwise spin direction were assigned with 1, and galaxies with counterclockwise spin direction were assigned with $-1$. Then, $\chi^2$ statistics was used such that for each possible integer $(\alpha,\delta)$ combination, the angular distance $\phi$ between $(\alpha,\delta)$ and the celestial coordinates of each galaxy in the data set was computed. The $\cos(\phi)$ of the galaxies were then fitted into $d\cdot|\cos(\phi)|$, such that d is the spin direction of the galaxy (a value within the set $\{-1,1\}$). The $\chi^2$ was computed 1 000 times such that in each time the galaxies were assigned with random spin directions, and the mean and standard deviation were computed for each possible $(\alpha,\delta)$. The mean $\chi^2$ computed with the random spin directions was then compared to the $\chi^2$ computed when d was assigned the real spin directions. The $\sigma$ difference between the $\chi^2$ of the real spin directions and the mean $\chi^2$ when using the random spin directions shows the likelihood of an axis at $(\alpha,\delta)$. When the likelihood of all $(\alpha,\delta)$ was computed, the
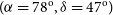
  $(\alpha,\delta)$ of the most likely dipole axis could be identified. Figure 2 shows the probability of a dipole axis in all integer $(\alpha,\delta)$ combinations. The most likely axis was identified at $(\alpha=78^{\rm o},\delta=47^{\rm o})$, with probability of $\sim2.83\sigma$. The 1 $\sigma$ error for that axis is $(58^{\rm o},184^{\rm o})$ for the right ascension, and $(6^{\rm o},73^{\rm o})$ for the declination.

Figure 2. Probability of cosine dependence of the spin directions of HST galaxies from every possible integer  $(\alpha,\delta)$ combination.
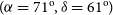
The dipole axis identified in the HST galaxies was compared to the dipole axis identified in SDSS galaxies that were annotated automatically (Shamir Reference Shamir2020c). Figure 3 shows the probability of a dipole axis identified in each possible pair of integer  $(\alpha,\delta)$ in the SDSS galaxies, when using the galaxies with $z>0.15$ used in (Shamir Reference Shamir2020c). That data set included 15 863 galaxies annotated automatically by their spin direction. The most likely axis is identified at $(\alpha=71^{\rm o},\delta=61^{\rm o})$, with $\sigma\simeq7.38$. That most likely axis is close to the most likely dipole axis identified in the HST galaxies, and well within the 1 $\sigma$ error. Figure 4 shows the most likely dipole axis when the galaxies are assigned with random spin directions. As expected, the dipole axis disappears when the galaxy spin directions are random.

Figure 3. Cosine dependence probability of the spin directions of SDSS galaxies from every possible integer  $(\alpha,\delta)$ combination.

Figure 4. Probability of cosine dependence of the spin directions of SDSS galaxies from every possible integer  $(\alpha,\delta)$ combination when the galaxies are assigned with random spin directions.
4. Conclusion
Results from two different data sets of galaxies imaged by two different instruments show similar asymmetry between galaxies with opposite spin directions. Each data set contains different galaxies, and the galaxies in each data set were annotated using a different method. Both data sets show a statistically significant dipole axis, and the location of the most likely axis is consistent in both data sets. Despite the difference in redshift, the two data sets show fairly similar location of the most likely dipole axis, and well within 1 $\sigma$ error.
While the observations are clearly provocative, it is difficult to identify an error that could lead to such results. The experiments are based on two different instruments and two different galaxy annotation methods. One of the instruments is space-based, reducing the possibility that the results are driven by an atmospheric effect. These results are consistent with previous similar experiments (Shamir Reference Shamir2013, Reference Shamir2016b, Reference Shamir2017a, Reference Shamir2017b, Reference Shamir2017c, Reference Shamir2019, Reference Shamir2020c). The automatic annotation method is model-driven, does not rely on machine learning, and consistent when the galaxy images are mirrored (Shamir Reference Shamir2017b). Previous experiments also showed that the asymmetry changes in different parts of the sky, which is not expected if the annotation method is biased (Shamir Reference Shamir2017a, Reference Shamir2019, Reference Shamir2020c).
It should be noted that while the vast majority of spiral galaxies are trailing, in some rare cases, galaxies are counter-winding (Grouchy et al. 2008). A small number of counter-winding galaxies can therefore lead to difference between the number of galaxies with opposite spin directions. However, if counter-winding galaxies are equally distributed between galaxies that spin clockwise and galaxies that spin counterclockwise, no statistically significant difference between the galaxies is expected. Therefore, to explain the observation with counter-winding galaxies, such galaxies need to have a certain preference based on the actual spin direction of the galaxy.
Analysis of the distribution of galaxies is limited by the fluctuations in large-scale galaxy population, known as ‘cosmic variance’ (Moster et al. Reference Moster, Somerville, Newman and Rix2011). However, here the measurement is a comparison between the number of galaxies with opposite spin directions identified inside the same exposures and same fields. It is therefore expected that fluctuations in galaxy population that affect the number of galaxies with a certain spin direction have the same impact on galaxies with the opposite spin direction. That reduces the possibility that the asymmetry is driven by changes in galaxy population, as any such change is expected to affect both clockwise and counterclockwise galaxies. This relative measurement is different from some other probes that are based on absolute measurements, such as the frequency of short GRBs or Ia supernovae. The use of a relative measurement can also handle effects such as Milky Way obstruction, as any obstruction that affects the ability to detect clockwise galaxies is expected to have a similar effect on the ability to detect counterclockwise galaxies in the same field.
It is naturally difficult to identify an immediate explanation for the observations. Lee et al. (Reference Lee, Pak, Song, Lee, Kim and Jeong2019b) identified consistency of spin directions of galaxies even if the galaxies are too far to interact gravitationally and defined the observation as ‘mysterious’ (Lee et al. Reference Lee, Pak, Song, Lee, Kim and Jeong2019b). Explanations of the asymmetry can be related to parity-breaking gravitational waves, which can affect galaxy shape during inflation (Biagetti & Orlando Reference Biagetti and Orlando2020), and can provide an explanation to the asymmetry without violating the basic cosmological assumptions. Cosmological-scale anisotropy has been observed in the past with cosmic microwave background (Cline, Crotty, & Lesgourgues Reference Cline, Crotty and Lesgourgues2003; Gordon & Hu Reference Gordon and Hu2004; Zhe, Xin, & Sai Reference Zhe, Xin and Sai2015). These observations also challenge the basic cosmological assumptions and led to theories that differ from the standard cosmological models (Feng & Zhang Reference Feng and Zhang2003; Piao, Feng, & Zhang Reference Piao, Feng and Zhang2004; Rodrigues Reference Rodrigues2008; Piao Reference Piao2005; Jiménez & Maroto Reference Jiménez and Maroto2007; Bohmer & Mota Reference Bohmer and Mota2008). These observations also led to the model of ellipsoidal universe (Campanelli, Cea, & Tedesco Reference Campanelli, Cea and Tedesco2006; Campanelli, Cea, & Tedesco Reference Campanelli, Cea and Tedesco2007; Gruppuso Reference Gruppuso2007), as well as a rotating universe (Gödel Reference Gödel1949; Ozsváth & Schücking Reference Ozsváth and Schücking1962; Ozsvath & Schücking Reference Ozsvath and Schücking2001; Sivaram & Arun Reference Sivaram and Arun2012; Chechin Reference Chechin2016).
Cosmological isotropy and homogeneity are basic assumptions used in most standard cosmological theories, although spatial homogeneity is an assumption that cannot be verified directly (Ellis Reference Ellis1979). Some evidence of cosmological isotropy violation has been observed through other messengers such as radio sources (Bengaly, Maartens, & Santos Reference Bengaly, Maartens and Santos2018), luminosity–temperature ratio (Migkas et al. Reference Migkas, Schellenberger, Reiprich, Pacaud, Ramos-Ceja and Lovisari2020), short gamma ray bursts (Mészáros Reference Mészáros2019), Ia supernova (Javanmardi et al. Reference Javanmardi, Porciani, Kroupa and Pflam-Altenburg2015), distribution of galaxy morphology (Javanmardi & Kroupa Reference Javanmardi and Kroupa2017), and cosmic microwave background (Aghanim et al. Reference Aghanim2014; Hu & White Reference Hu and White1997; Cooray, Melchiorri, & Silk Reference Cooray, Melchiorri and Silk2003; Ben-David, Kovetz, & Itzhaki Reference Ben-David, Kovetz and Itzhaki2012; Eriksen et al. Reference Eriksen, Hansen, Banday, Gorski and Lilje2004). Future instruments such as the Earth-based Rubin observatory and the space-based Euclid can be used to validate whether the asymmetry is observed also in other instruments and provide better profiling of the asymmetry.
Given the multiple reports on anomaly in the distribution of galaxies with opposite spin patterns (Longo Reference Longo2011; Shamir Reference Shamir2012, Reference Shamir2019; Lee et al. Reference Lee, Pak, Song, Lee, Kim and Jeong2019b; Shamir Reference Shamir2020c), it is important to continue the examination of such observations, verifying and profiling the distribution, and identifying whether the reported observations can have non-astronomical explanations.
Acknowledgments
The author would like to thank the anonymous reviewer for the insightful comments. This study was supported in part by NSF grants AST-1903823 and IIS-1546079. The research was funded by NSF grant AST-1903823. The research is based on observations made with the NASA/ESA Hubble Space Telescope and obtained from the Hubble Legacy Archive, which is a collaboration between the Space Telescope Science Institute (STScI/NASA), the Space Telescope European Coordinating Facility (ST-ECF/ESA) and the Canadian Astronomy Data Centre (CADC/NRC/CSA). SDSS-IV is managed by the Astrophysical Research Consortium for the Participating Institutions of the SDSS Collaboration including the Brazilian Participation Group, the Carnegie Institution for Science, Carnegie Mellon University, the Chilean Participation Group, the French Participation Group, Harvard-Smithsonian Center for Astrophysics, Instituto de Astrofisica de Canarias, The Johns Hopkins University, Kavli Institute for the Physics and Mathematics of the Universe (IPMU)/University of Tokyo, the Korean Participation Group, Lawrence Berkeley National Laboratory, Leibniz Institut fur Astrophysik Potsdam (AIP), Max-Planck-Institut fur Astronomie (MPIA Heidelberg), Max-Planck-Institut fur Astrophysik (MPA Garching), Max-Planck-Institut fur Extraterrestrische Physik (MPE), National Astronomical Observatories of China, New Mexico State University, New York University, University of Notre Dame, Observatario Nacional/MCTI, The Ohio State University, Pennsylvania State University, Shanghai Astronomical Observatory, United Kingdom Participation Group, Universidad Nacional Autonoma de Mexico, University of Arizona, University of Colorado Boulder, University of Oxford, University of Portsmouth, University of Utah, University of Virginia, University of Washington, University of Wisconsin, Vanderbilt University, and Yale University.


